Bill Williams’ Indicators Analysis 29.10.2013 (USD/CAD, NZD/USD)
29.10.2013
Analysis for October 29th, 2013
USD/CAD
At the H4 chart of the USD/CAD currency pair, the Alligator is moving upwards. The indicators are in the red zone; the price is forming a bearish fractal; there is a Squat bar on the MFI. A bearish fractal may reach the Alligator’s teeth (red line), and then I expect the price to move upwards.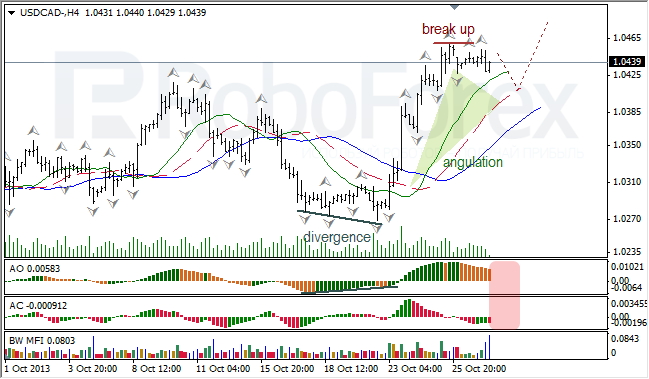
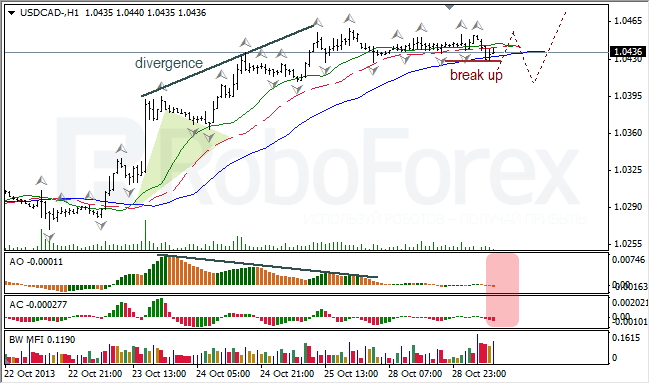
At the H1 chart of the USD/CAD currency pair, the Alligator is sleeping. The price is finishing a bearish fractal; AO and AC are in the red zone; there might be a Squat bar on the MFI. The pair is expected to fall down a little bit.
NZD/USD
At the H4 chart of the NZD/USD currency pair, the Alligator is moving downwards. AO is in the green zone, AC is near the balance line; there might be a Squat bar on the MFI. A bullish fractal my reach the Alligator’s lips (green line).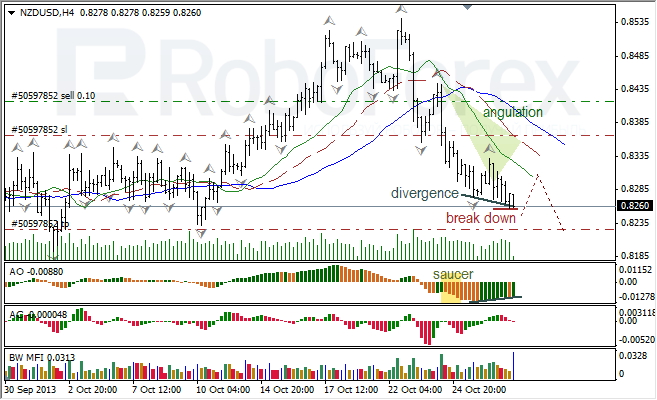
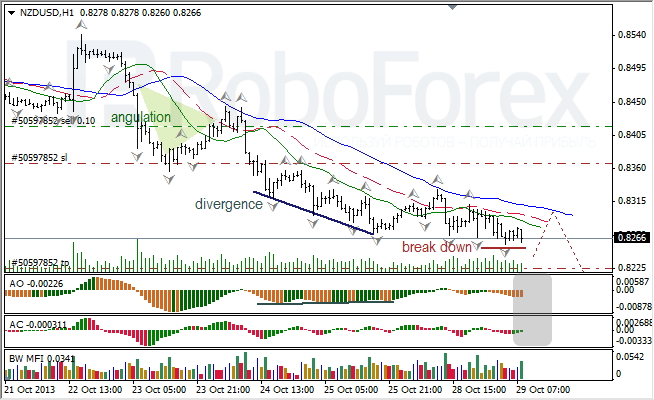
At the H1 chart of the NZD/USD currency pair, the Alligator is also moving downwards. AO and AC are in the grey zone; there is a Squat bar on the MFI. A bullish fractal may reach the Alligator’s jaw (blue line).
RoboForex Analytical Department
Attention!
Forecasts presented in this section only reflect the author’s private opinion and should not be considered as guidance for trading. RoboForex bears no responsibility for trading results based on trading recommendations described in these analytical reviews.