
Top 3 trade ideas for 8 September 2026
Trade ideas for GBPUSD, USDJPY, and US 500 are available today. The ideas expire on 9 September 2026 at 8:00 AM (server time, UTC +3).
GBPUSD trade idea
GBPUSD analysis shows that the H4 chart continues to favour a predominantly bearish scenario despite the local recovery over recent sessions. The price has approached the 1.3550–1.3575 resistance area, so selling from current levels appears less attractive from a risk-to-reward perspective than entering after a further correction. The baseline scenario involves placing a pending Sell Limit order at 1.3550. A move below 1.3500 would further confirm renewed bearish momentum and open the way towards the 1.3475 and 1.3450 support levels. Conversely, a breakout above 1.3575 would increase the likelihood of the correction extending towards 1.3600.
The fundamental backdrop also moderately favours a decline in the short term. In August, the US economy added 162 thousand non-farm jobs versus expectations of around 56 thousand, while unemployment remained at 4.1%. The strong report revived expectations of a possible Federal Reserve rate hike at the September meeting, supporting the US dollar. In the UK, the Bank of England rate remains at 3.75%, and inflation risks linked, among other things, to high energy prices could lead to tighter monetary policy. However, this is not yet sufficient for a sustained upward reversal in the GBPUSD rate.
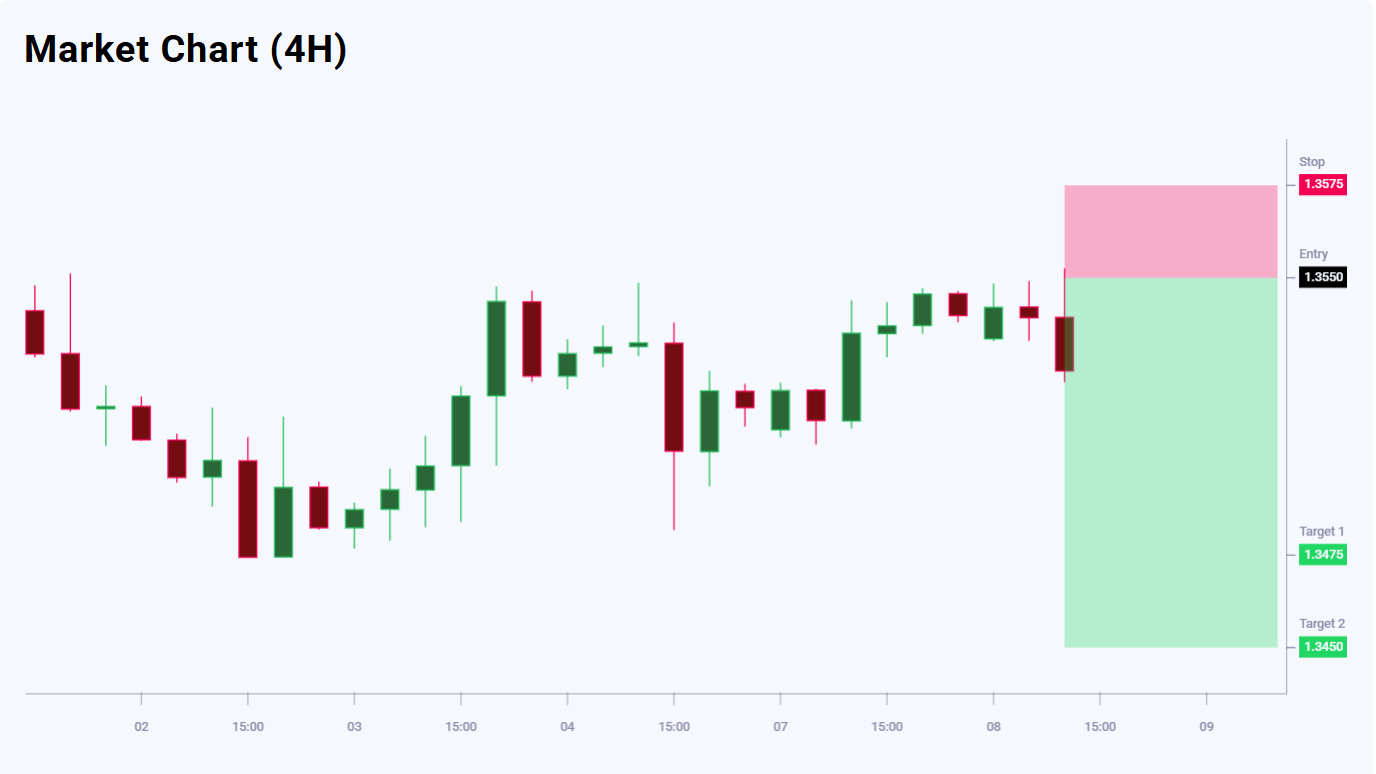
Trading plan
- Current price: 1.3522
- Entry point: 1.3550
- Target 1: 1.3475
- Target 2: 1.3450
- Stop loss: 1.3575
- Risk-to-reward ratio: 1:3 and 1:4
USDJPY trade idea
USDJPY analysis shows a continued pronounced downtrend on the H4 chart. The sequence of lower highs and lower lows indicates continued pressure on the pair, although a local upward correction is possible after the sharp decline. Therefore, selling directly from current levels appears less attractive from a risk-to-reward perspective. A more comfortable entry point is forming around 154.50, which acts as the nearest resistance level. The baseline scenario involves placing a pending Sell Limit order at 154.50. A return below 153.50 would provide additional confirmation of bearish momentum and increase the likelihood of a move towards 152.00–151.00.
The fundamental backdrop also broadly supports a stronger yen. The market has significantly increased the likelihood of a Bank of Japan rate hike at the 17–18 September meeting, while expectations of tighter monetary policy have already helped the yen strengthen by around 4% from recent levels near 160 per US dollar.
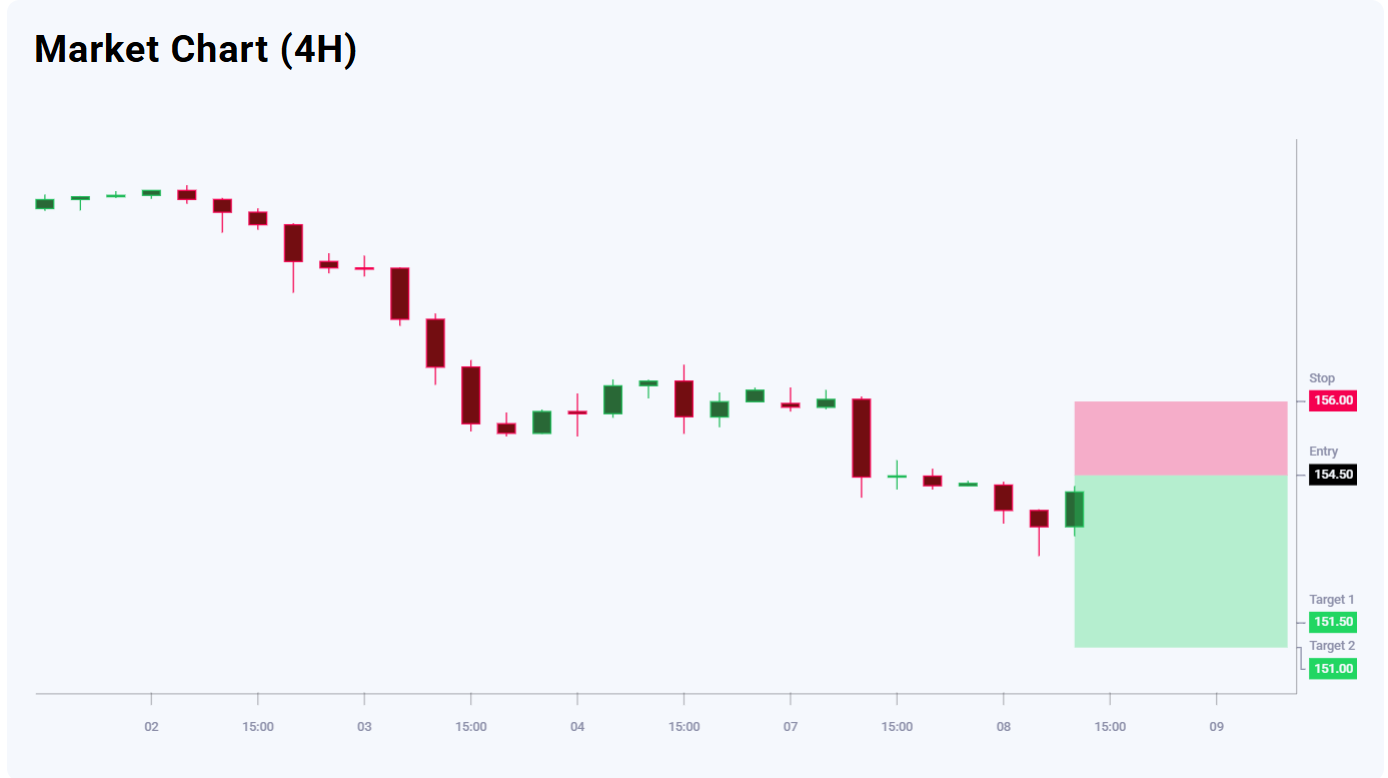
Trading plan
- Current price: 154.22
- Entry point: 154.50
- Target 1: 151.50
- Target 2: 151.00
- Stop loss: 156.00
- Risk-to-reward ratio: 1:1.6 and 1:2.8
US 500 trade idea
US 500 analysis shows that after a local decline, the index is showing signs of an upward reversal. On the H4 chart, a Morning Star candlestick pattern formed near the local low, indicating easing selling pressure. However, buying before the reversal is confirmed remains risky, so the baseline scenario suggests entry only after a breakout above 7,702. Today’s US 500 trade idea involves placing a pending Buy Stop order at 7,702. Consolidation above this level would confirm increased bullish momentum and create conditions for a move first towards 7,760 and then to the 7,800–7,825 area.
The fundamental backdrop for the US 500 remains mixed. On the one hand, a surge in oil prices to almost 100 USD per barrel amid escalating tensions in the Middle East is increasing inflation risks, while strong US labour market data has raised the likelihood of tighter Federal Reserve policy. Against this backdrop, S&P 500 futures were under pressure on 8 September, with the market awaiting the release of PPI and CPI later this week.
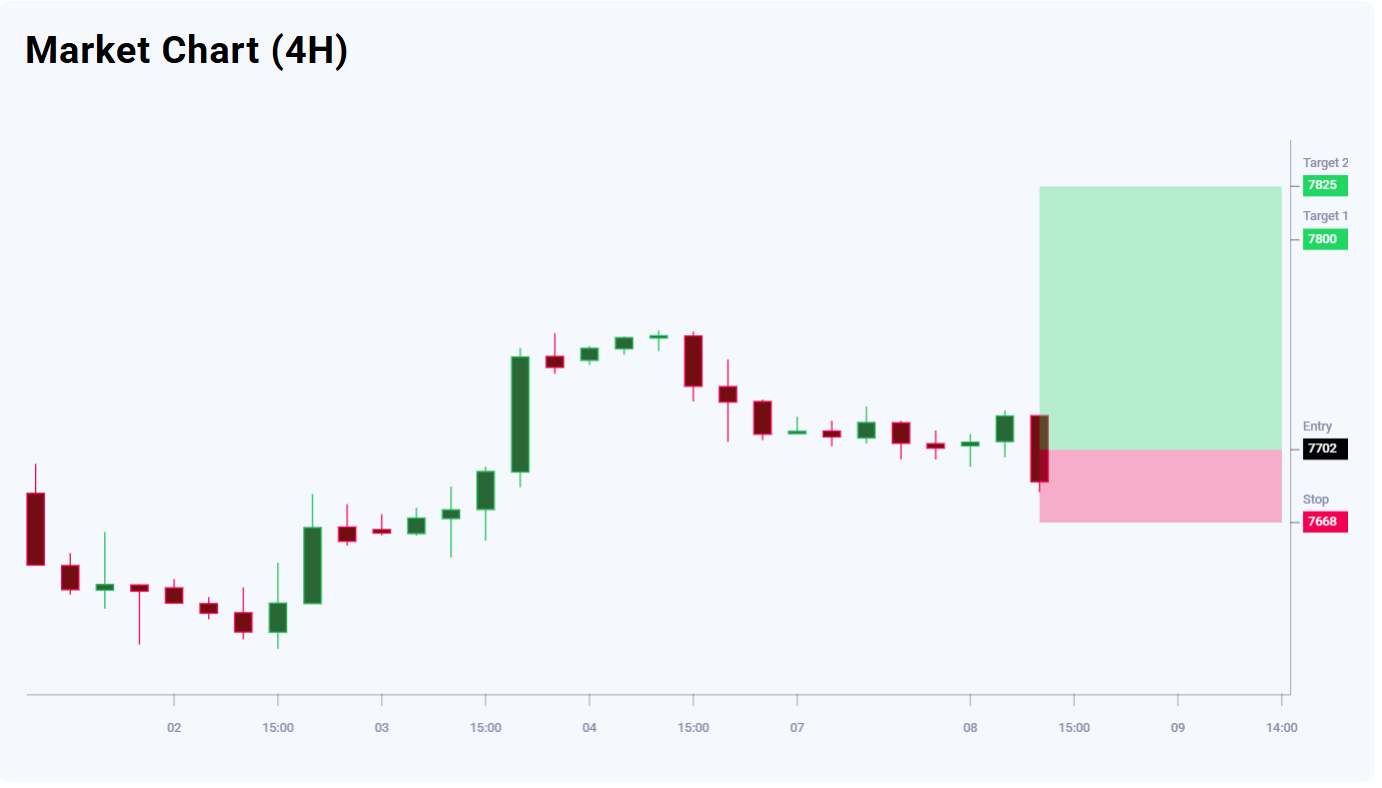
Trading plan
- Current price: 7,701
- Entry point: 7,702
- Target 1: 7,800
- Target 2: 7,825
- Stop loss: 7,668
- Risk-to-reward ratio: 1:2.9 and 1:3.6
Editors’ picks
 EURUSD forecast 2026–2027: technical analysis, price levels & predictions
EURUSD has recovered from the July lows and is trading near 1.1545 — back in bullish territory. The pair has reclaimed EMA65 on the daily, formed a bullish EMA crossover on H4, and the US-eurozone GDP gap has narrowed sharply (US 1.5% vs eurozone 1.0%). Goldman Sachs and Deutsche Bank both now target 1.2500 by year-end. A confirmed close above 1.1700 opens the path to 1.1805. We break down the key levels, three trading scenarios, and what the unprecedented 9-3 FOMC dissent vote means for EURUSD.
 Gold (XAUUSD) forecast 2026: technical analysis, price levels & predictions
Gold has reversed its downtrend and is trading near 4,360 USD, back above both EMA65 and EMA200. ETF flows turned positive in July with 3 billion USD of net inflows, and central banks bought 288.9 tonnes in Q2 — up 62% year-on-year. A breakout above 4,500 USD opens the path to 4,855 USD and the 5,597 USD all-time high. We break down the key levels, three trading scenarios with entry triggers, and what J.P. Morgan, Deutsche Bank and Goldman Sachs are forecasting for gold in 2026.
Forecasts presented in this section only reflect the author’s private opinion and should not be considered as guidance for trading. RoboForex bears no responsibility for trading results based on trading recommendations described in these analytical reviews.