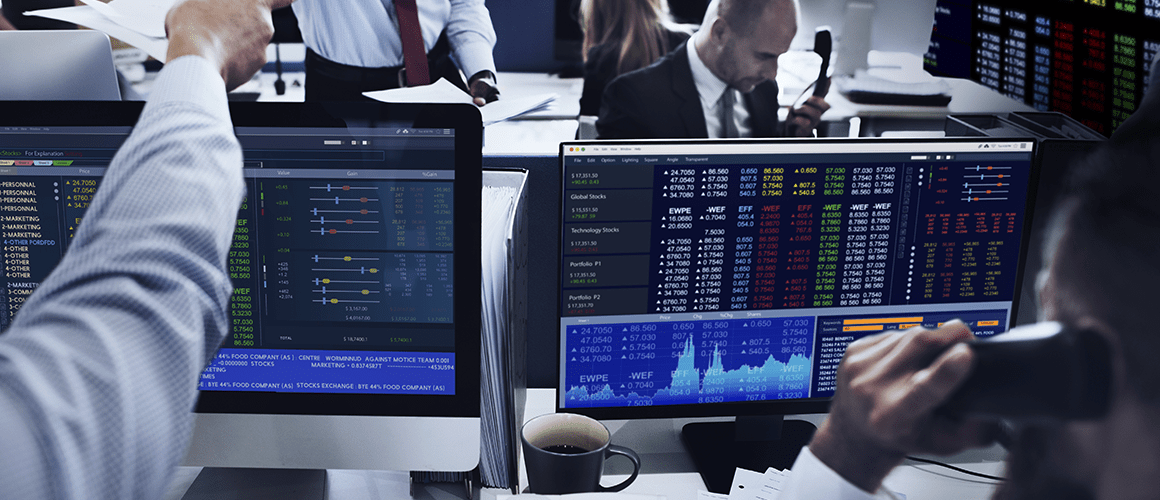
Everyone serious about trading on financial markets will inevitably face the necessity to choose a broker. In this review, we will discuss the main criteria for distinguishing between them.
All posts

5 min
To answer the question in the heading we need to understand what is a flat. In literature, this is characterized as a sideways movement without clear direction up- or downwards. To put it simply, the price is moving to the right, the local maximums and minimums are on the same level.

10 min
Working on financial markets implies high risk; in order to become a successful trader, one should minimize potential risks. This article is devoted exactly to reducing them.
7 min
Indicators have long been introduced to the trading systems of many traders. As a minimum, they are of good help in chart analysis, as a maximum, they are the base of the whole trading system. Algorithmic trading, which means automatizing the work and creating trading robots, is also mostly based on the signals of various indicators.

7 min
Hi everyone, today I'm going to talk about false breakouts. In certain cases, it might be unclear to the trader whether there has happened a breakout of the resistance level and, hence, the bullish trend will continue. Such a breakout might be false so that the price will reverse quite soon and go in the […]
11 min
A drawdown is a decrease in the balance and equity on the trading account; to put it simpler, a drawdown is a loss. Drawdowns can be of two types: floating and fixed.
6 min
Momentum is one of the simplest and most popular indicators among traders. As its creator, certain sources name a French mathematician Paul Émile Appell. This indicator helps define the trend direction and the speed of the price change.

14 min
The Netting system allows only one position open in any direction for one instrument. The system is used all over the stock market. To put it simpler, the trader cannot open selling and buying position on one instrument simultaneously - the positions mutually close, the orders open in one direction summing up.

13 min
Let us have a look at the main economic indices and their influence at the currency rates. The knowledge and understanding of these indices are the basics of fundamental analysis and forecasting of price movements.
5 min
Most often, beginner traders consider trading the trend to be a complicated process. Today, we are looking into a simple but efficient strategy called Surfing. Using such a strategy, any trader can pretend a surfer catching a wave to ride. However, here we will not just ride the market waves but will try to make a profit on their peculiar movements.

8 min
Before talking about forex trading systems, it would be better to find out what systems exist at all, which system suits which trader and what trading system to choose. Searching for your best forex system through trial and error may take years, that is why this issue requires a systemic approach.

7 min
To gain experience and enhance your future results, you should start with a demo account, where you can test your trading system without risking your real money.
5 min
How do you use the GDP data in trading? In the classical variant, the GDP data significantly higher than forecast promises growth of the national currency, so buys are in priority. Conversely, the GDP data weaker than expected entails a decline in the national currency rate, so sells are recommended. Also, you should evaluate the technical picture and prepare a trading plan.
6 min
The Trailing Stop is a much flexible and comfortable way of using the Stop Loss. With this instrument, the trader gets an opportunity to use the whole potential of the market movement, simultaneously reducing the risk of large losses.

8 min
Trading on a currency or stock market requires a set of rules to comply with — this is the only way to success. Even long-term investing includes following certain rules, which regulate the choice of the asset and calculation of the term of the investment.