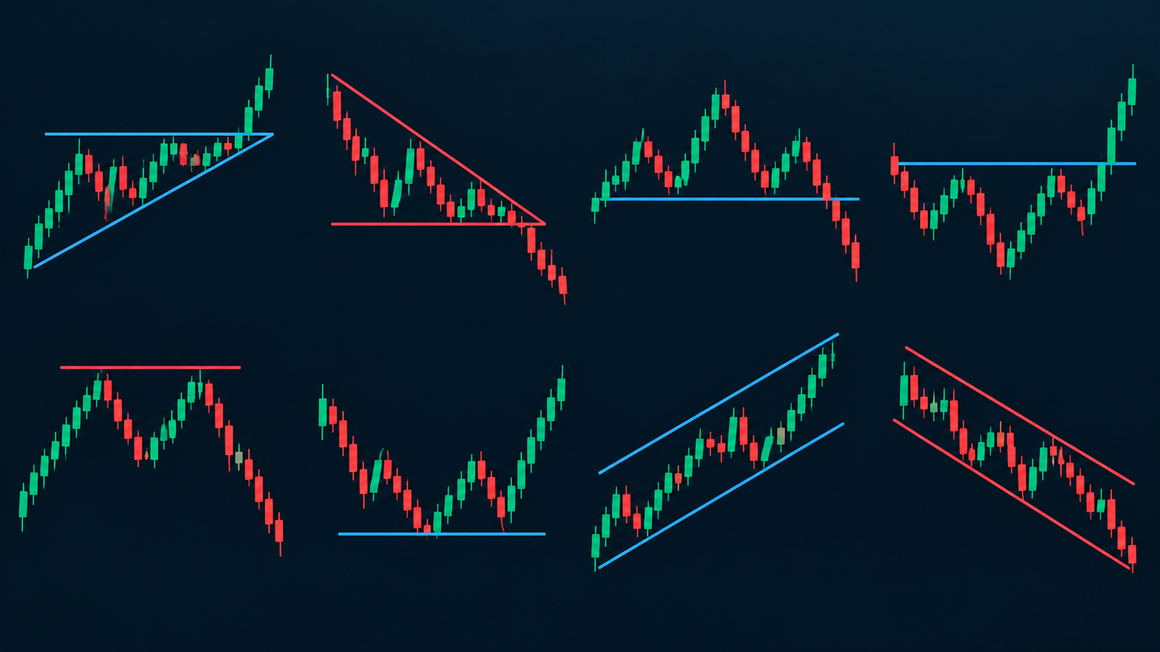
Chart patterns are repeated shapes that price draws on a chart, and traders use them to spot likely reversals and continuations of a trend. Reversal patterns such as Head and Shoulders, Double Top and Triple Bottom form at the end of a move. The Flag and the Pennant form inside a trend and point to its continuation. Most patterns give a signal only after the price breaks a key line, such as the neckline.
All posts

7 min
Today we will talk about price action analysis, an important aspect of technical analysis on Forex. Price Action analyzes price behavior and patterns and can identify almost any market trend.

8 min
In the article, we will discuss horizontal support and resistance levels: how to draw them and how to use alongside simple indicators of tech analysis.

9 min
A Japanese candlestick chart looks like a rectangle with two "tails" on the top and at the bottom. Same as the bars reflects four prices...