
Gold (XAUUSD) in a range: the outlook is uncertain
Gold (XAUUSD) prices are slipping to 4,031 USD. The market is trending downwards despite encouraging signals from US data. Discover more in our analysis for 15 July 2026.
XAUUSD forecast: key takeaways
- Gold (XAUUSD) prices are factoring in the latest US inflation data
- The market is now reducing its Fed rate expectations
- XAUUSD forecast for 15 July 2026: 3,983 or 4,080
Fundamental analysis
Gold (XAUUSD) is trading at 4,050 USD per ounce on Wednesday. US inflation data forced the market to lower expectations of a further Fed rate hike.
Annual US inflation slowed to 3.5% in June, down from 4.2% in May, and came in below the forecast of 3.8%. The easing of price pressures was driven by lower oil prices and weakening energy inflation. Consumer prices fell by 0.4% month-on-month, marking the first decline since 2020.
Federal Reserve Chairman Kevin Warsh, during his testimony in Congress, reiterated the regulator’s commitment to fighting inflation, but gave no signals in favour of more aggressive policy tightening.
At the same time, the market still estimates the likelihood of a rate hike in September at around 50%. Tensions between the US and Iran are supporting oil prices and keeping inflation risks in place, so the room for gold to rise remains limited for now.
The gold (XAUUSD) forecast is moderately negative.
Technical outlook
On the H4 chart, gold (XAUUSD) maintains its downward momentum after failing to consolidate above 4,170. Quotes have fallen to 4,032 and are trading below the middle Bollinger Band, approaching the indicator’s lower boundary, signalling continued selling pressure.
The nearest support level is located at 3,983, below which the next target could be the 3,935–3,940 area. The main resistance level is around 4,078–4,080, with a stronger barrier in the 4,125–4,130 zone. As long as prices remain below 4,080, a retest of the support level remains likely.
MACD is in negative territory, although the downward momentum is gradually weakening. The Stochastic Oscillator turned downwards after leaving overbought territory, indicating the risk of further correction. The baseline scenario remains movement within the 3,983–4,080 range with a moderately negative bias.
XAUUSD overview
- Asset: XAUUSD
- Timeframe: H4 (Intraday)
- Trend: downward
- Key resistance levels: 4,080 and 4,130
- Key support levels: 3,983 and 3,940
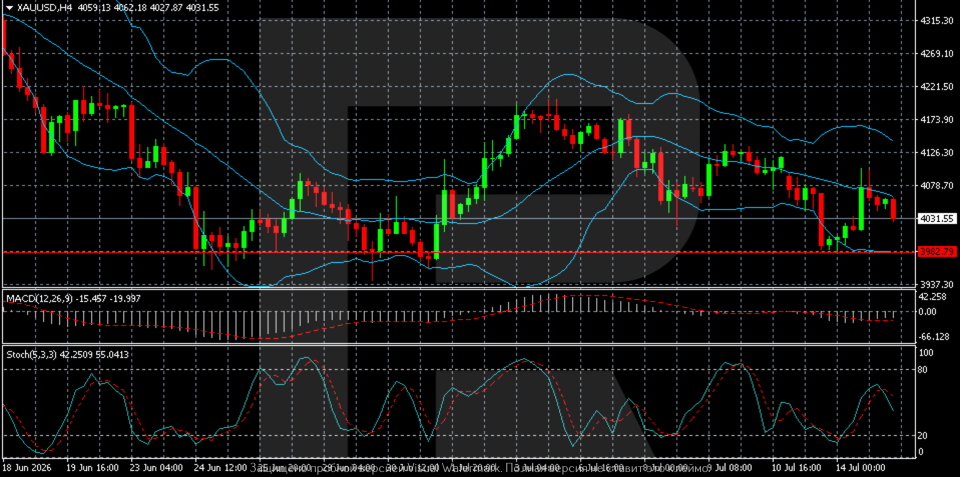
XAUUSD trading scenarios for today
Main scenario (Sell Stop)
Consolidation below 3,983 would confirm continued selling pressure and open the way to the next support zone.
- Take Profit: 3,940
- Stop Loss: 4,010
Alternative scenario (Buy Stop)
A breakout above the 4,080 resistance level would indicate weakening downward momentum and create conditions for a recovery.
- Take Profit: 4,130
- Stop Loss: 4,055
Risk factors
The main risk to the XAUUSD downside scenario remains increased demand for gold as a safe-haven asset if the situation in the Middle East deteriorates further. Weak US inflation and softening Fed policy expectations could provide additional support to buyers.
Summary
Gold prices are reacting to US data. The XAUUSD forecast for today, 15 July 2026, suggests that prices may remain within the 3,983–4,080 range, with a moderate downward bias.
Editors’ picks
 EURUSD forecast 2026–2027: technical analysis, price levels & predictions
EURUSD has pulled back from the 2026 high of 1.1915 and is now trading near 1.1450 — below both EMA65 and EMA200 — with the active scenario shifting from bullish to bearish. The ECB raised rates to 2.40%, but the Fed holds at 3.75%, and US inflation (3.5%) continues to outpace the eurozone (2.8%). A confirmed break below 1.1280 opens the next downward wave toward 1.1080. We break down the key levels, three trading scenarios with entry triggers, and what Deutsche Bank, Morgan Stanley and UBS are forecasting for EURUSD in 2026.
 Gold (XAUUSD) forecast 2026: predictions based on fundamental and technical analysis
Gold has corrected over 25% from its all-time high of 5,597 USD and is now trading near 4,100 USD — testing a critical support zone. Is this the bottom, or will the downtrend continue? We break down the key levels (support 3,920 USD, breakout trigger 4,500 USD), three trading scenarios with entry levels, and what J.P. Morgan, Goldman Sachs and Deutsche Bank are forecasting for gold in 2026.
Forecasts presented in this section only reflect the author’s private opinion and should not be considered as guidance for trading. RoboForex bears no responsibility for trading results based on trading recommendations described in these analytical reviews.