
Gold (XAUUSD) attempts to consolidate above the upper boundary of the Triangle pattern
XAUUSD quotes continue to rise as expectations of aggressive Federal Reserve policy tightening decline. Prices currently stand at 4,166 USD. Find out more in our analysis for 5 August 2026.
XAUUSD forecast: key takeaways
- A technical breakout of the Triangle pattern indicates the potential for further upside
- Easing geopolitical tensions reduced expectations of aggressive Federal Reserve rate hikes
- Central banks continued to increase their gold reserves
- XAUUSD forecast for 5 August 2026: 4,370
Fundamental analysis
XAUUSD quotes are rising for the second consecutive trading session, with buyers attempting to gain a foothold above the upper boundary of the Triangle pattern on the daily chart. If the breakout is confirmed, the pattern indicates further upside, with a potential target near 4,430 USD.
Gold received additional support following reports of a possible imminent agreement to reopen the Strait of Hormuz, which reduced market concerns about new inflation risks. Easing geopolitical tensions lower the likelihood of aggressive monetary policy tightening by the Federal Reserve in the coming months.
Against this backdrop, markets have revised their expectations for a Federal Reserve interest rate hike in September, with the probability of such a scenario falling to around 57% from 67% a day earlier. Softer expectations for US monetary policy are putting pressure on the US dollar and supporting demand for gold as a safe-haven asset.
At the same time, central banks remain highly interested in the precious metal. According to World Gold Council estimates, global central banks increased their gold reserves by 51.1 tonnes in June 2026. Poland and China remain the leading buyers, with the Chinese central bank increasing its gold holdings for the twentieth consecutive month.
Technical outlook
XAUUSD quotes have consolidated above the EMA-65 and the upper boundary of the Triangle pattern, increasing buying pressure and raising the likelihood of bullish momentum. Today’s XAUUSD forecast suggests continued growth towards 4,370 USD.
Technical indicators confirm persistent bullish sentiment. The Stochastic Oscillator turned upwards after rebounding from an ascending support line, indicating increased buying activity. Consolidation above the upper boundary of the Triangle pattern would further signal continued growth. In this case, buyers would receive confirmation of the strength of the bullish scenario, which could accelerate XAUUSD’s movement towards the next resistance levels.
An alternative scenario would be considered if prices break the pattern’s upper boundary and consolidate below 4,085 USD. This signal would indicate that sellers have regained control, invalidate the current bullish scenario, and create conditions for a renewed decline.
XAUUSD overview
- Asset: XAUUSD
- Timeframe: H4 (intraday)
- Trend: bullish
- Key resistance levels: 4,200 and 4,370
- Key support levels: 4,105 and 4,045
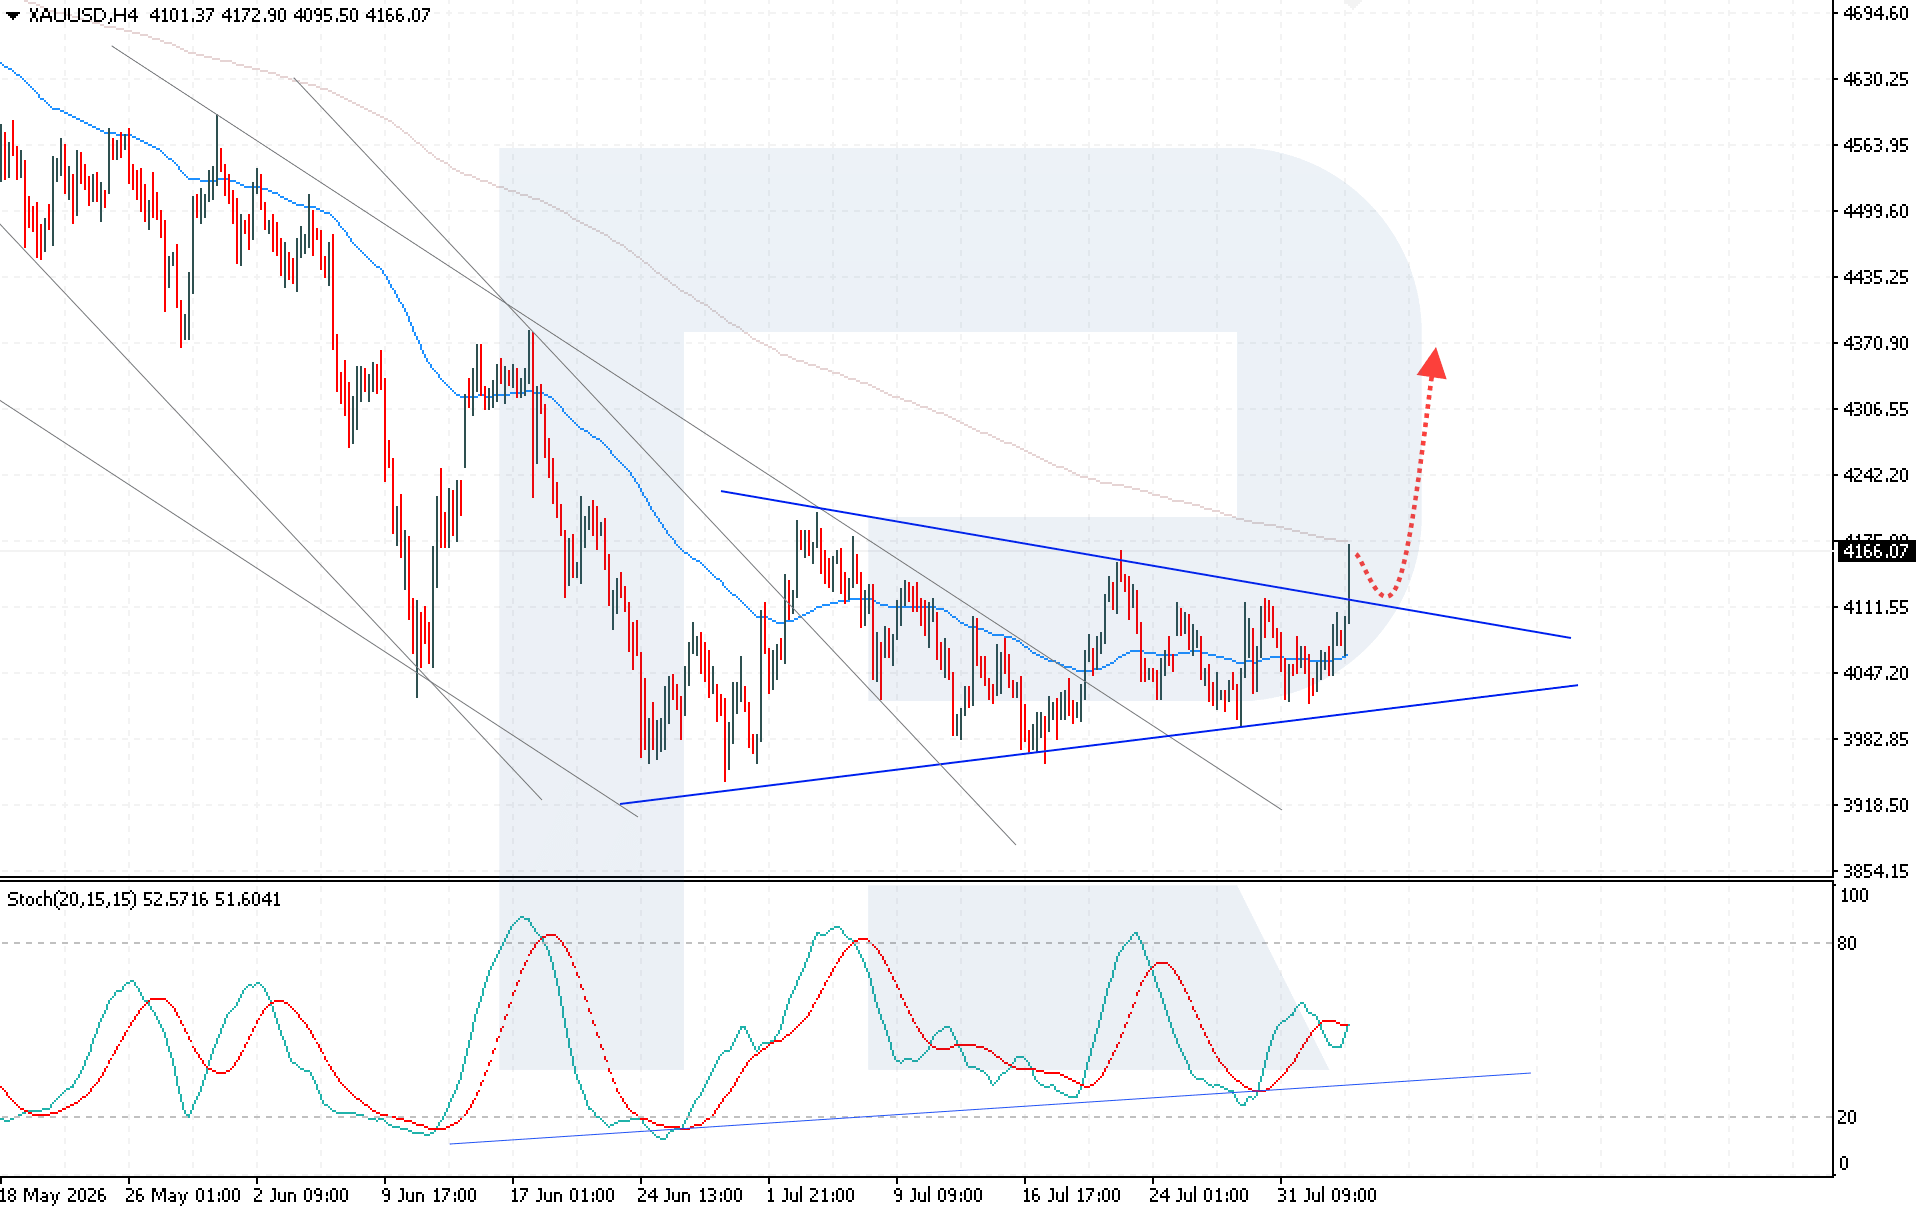
XAUUSD trading scenarios for today
Main scenario (Buy Stop)
A rebound from the upper boundary of the Triangle pattern would increase bullish pressure and indicate continued upward momentum in XAUUSD.
- Take Profit: 4,370
- Stop Loss: 4,085
Alternative scenario (Sell Stop)
A breakout above the upper boundary of the Triangle pattern, followed by consolidation below 4,085, would invalidate the pattern and signal a bearish correction.
- Take Profit: 3,935
- Stop Loss: 4,145
Risk factors
Risks to the XAUUSD upside scenario include a possible false breakout above the upper boundary of the Triangle pattern and a return below key support levels. A stronger US dollar or a shift in Federal Reserve policy expectations towards a more hawkish stance could put pressure on gold and limit further bullish momentum.
Summary
XAUUSD maintains a bullish outlook after consolidating above the EMA-65 and the upper boundary of the Triangle pattern, while further momentum could open the way to new highs. However, to confirm the move, buyers need to hold the key support levels, as a return below 4,085 USD would increase the risk of a renewed correction.
Editors’ picks
 EURUSD forecast 2026–2027: technical analysis, price levels & predictions
EURUSD has pulled back from the 2026 high of 1.1915 and is now trading near 1.1450 — below both EMA65 and EMA200 — with the active scenario shifting from bullish to bearish. The ECB raised rates to 2.40%, but the Fed holds at 3.75%, and US inflation (3.5%) continues to outpace the eurozone (2.8%). A confirmed break below 1.1280 opens the next downward wave toward 1.1080. We break down the key levels, three trading scenarios with entry triggers, and what Deutsche Bank, Morgan Stanley and UBS are forecasting for EURUSD in 2026.
 Gold (XAUUSD) forecast 2026: predictions based on fundamental and technical analysis
Gold has corrected over 25% from its all-time high of 5,597 USD and is now trading near 4,100 USD — testing a critical support zone. Is this the bottom, or will the downtrend continue? We break down the key levels (support 3,920 USD, breakout trigger 4,500 USD), three trading scenarios with entry levels, and what J.P. Morgan, Goldman Sachs and Deutsche Bank are forecasting for gold in 2026.
Forecasts presented in this section only reflect the author’s private opinion and should not be considered as guidance for trading. RoboForex bears no responsibility for trading results based on trading recommendations described in these analytical reviews.