
XAUUSD corrects, but record ETF inflows support gold
Physically backed gold ETFs attracted 18 billion USD in August, which could provide long-term support for gold. The current price is 4,355 USD. Find out more in our analysis for 21 September 2026.
XAUUSD forecast: key takeaways
- The Federal Reserve maintains a clear signal on the future course of monetary policy
- According to the World Gold Council, physically backed gold ETFs attracted 18 billion USD in August
- XAUUSD forecast for 21 September 2026: 4,430 and 4,315
Fundamental analysis
The XAUUSD price forecast for today, 21 September 2026, shows that gold is forming a corrective wave and testing the 4,355 USD level.
At its 15–16 September meeting, the Federal Reserve raised the rate by 0.25 percentage points to 4.00% and maintained a hawkish signal on the future course of monetary policy. Higher rates increase the opportunity cost of holding gold and remain the main short-term source of pressure.
Following the Federal Reserve, the Bank of Japan also raised its rate, while the ECB had tightened monetary policy earlier. The market is beginning to price in the possibility of a new rate-hike cycle amid persistent inflation, limiting gold's appeal as a non-yielding asset.
Renewed escalation in the Middle East is increasing demand for safe-haven assets. At the same time, higher oil prices are adding to inflation risks and could force central banks to keep policy tight for longer.
According to the World Gold Council, physically backed gold ETFs attracted 18 billion USD in August, the second-largest monthly inflow on record. Total ETF holdings rose by 121 tonnes to a record 4,189 tonnes. This demand remains an important long-term fundamental factor supporting gold.
The XAUUSD forecast for 21 September 2026 takes into account that hawkish policy from the Federal Reserve and other central banks limits gold's upside potential, while record ETF inflows, continued central-bank buying, and geopolitical risks continue to provide strong structural support for demand.
Technical outlook
On the XAUUSD H4 chart, the price formed a Hammer reversal pattern near the lower Bollinger Band. As the pattern signal plays out, the price could continue its upward wave. Given that XAUUSD is trading within a horizontal channel, the resistance at 4,430 USD is the upside target.
At the same time, today's XAUUSD technical analysis also allows for a second scenario involving a correction towards 4,315 USD followed by a continuation of the uptrend after a test of support.
XAUUSD overview
- Asset: XAUUSD
- Timeframe: H4 (Intraday)
- Trend: bullish
- Key resistance levels: 4,395 and 4,450
- Key support levels: 4,315 and 4,262
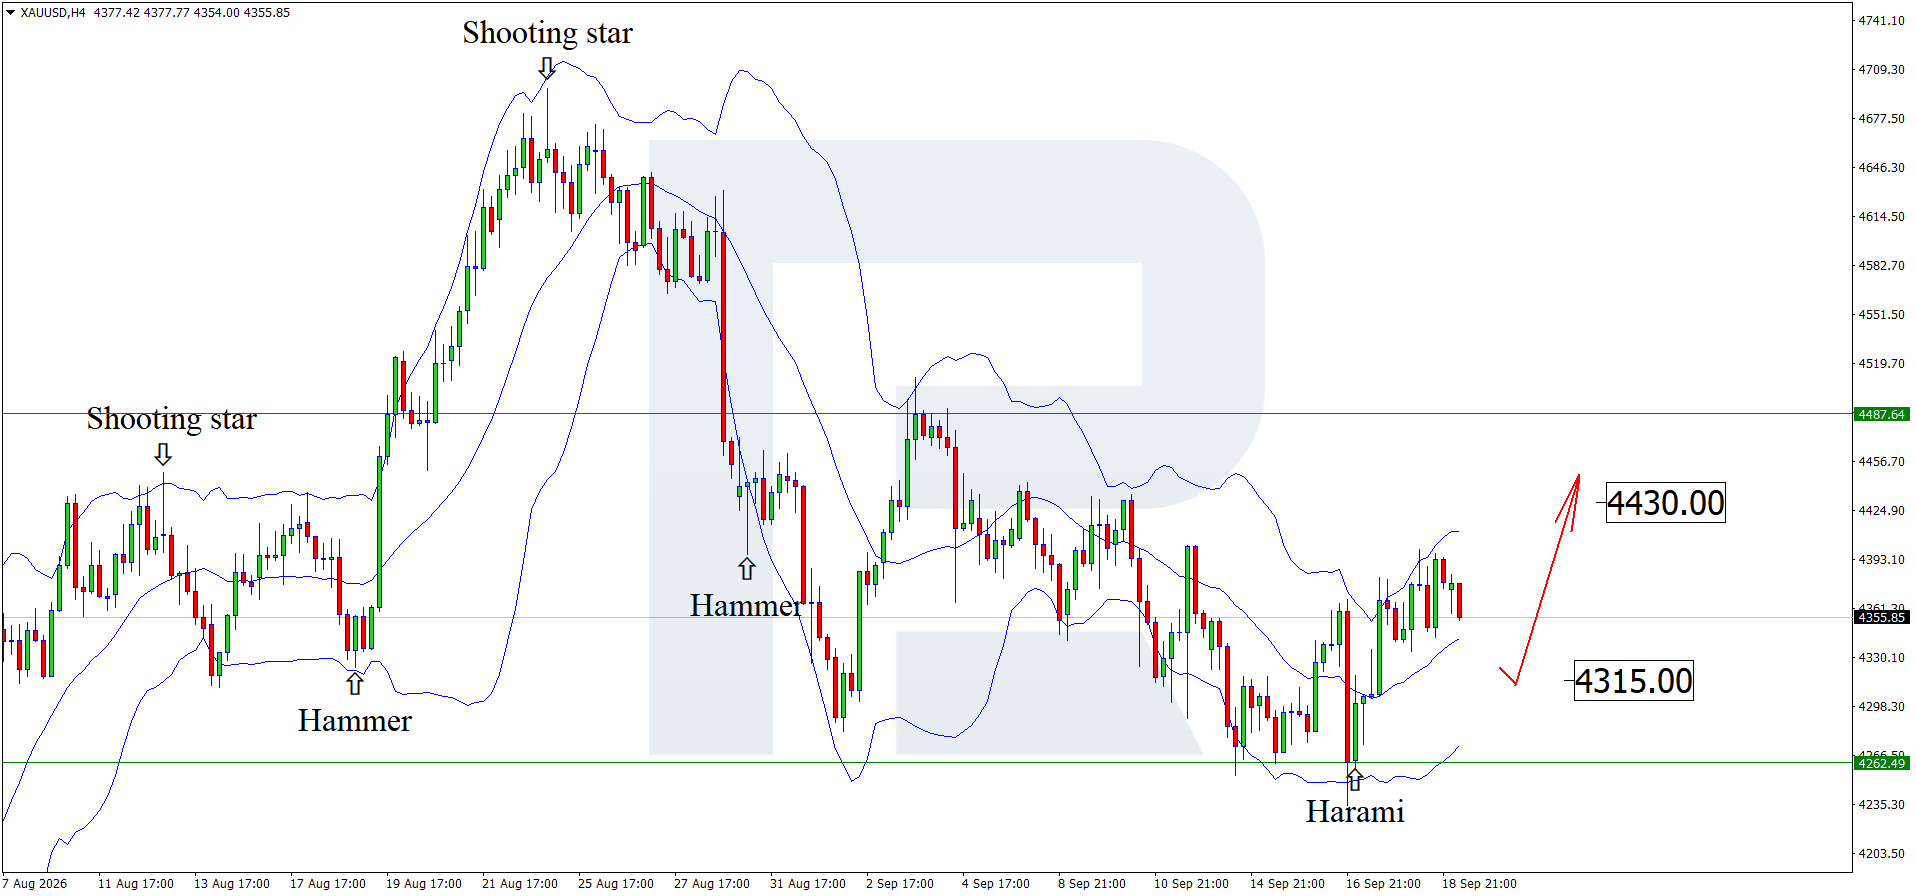
XAUUSD trading scenario for today
Trading scenario (Buy Stop)
A breakout above the 4,395 resistance level would indicate stronger bullish momentum towards the 4,430 target and create conditions for opening long positions.
- Current price: 4,355
- Entry level: 4,395
- Take Profit: 4,450
- Stop Loss: 4,375
- Risk-to-reward ratio: above 1:2
The trade idea is valid until 08:00 AM on 22 September 2026 (server time, UTC+3).
Risk factors
The main risk to the bullish scenario remains buyers' inability to consolidate above the 4,395 USD resistance level. An additional negative signal would be a decline in demand for gold from investors and central banks.
Summary
Hawkish central-bank policies are limiting gold's gains, while growth in physically backed gold ETFs is supporting gold over the longer term. XAUUSD technical analysis suggests a rise towards the 4,430 USD level after a correction.
Editors’ picks
 EURUSD forecast 2026–2027: technical analysis, price levels & predictions
The EURUSD outlook for 2026 and 2027: key levels on the daily chart, three trading scenarios and the policy gap between the Fed and the ECB that drives the pair.
 Gold (XAUUSD) forecast 2026: technical analysis, price levels & predictions
Where gold could trade in 2026: key levels, three trading scenarios with entry triggers and the forecasts from J.P. Morgan, Deutsche Bank and Goldman Sachs.
Forecasts presented in this section only reflect the author’s private opinion and should not be considered as guidance for trading. RoboForex bears no responsibility for trading results based on trading recommendations described in these analytical reviews.