
Gold (XAUUSD) weekly forecast: sellers still have the upper hand
Gold (XAUUSD) enters the week of 20–24 July near 4,050 USD per ounce. Weaker US inflation data reduced the probability of a Federal Reserve rate hike in September to around 44% and supported the metal. However, renewed escalation between the US and Iran and rising oil prices keep inflation risks in place, limiting gold’s recovery potential.
The baseline scenario for the week remains moderately negative. Gold maintains its downward trajectory, trading below the 4,080–4,120 resistance zone. The key support level is located around 3,940. Until prices consolidate above 4,120, sellers retain the advantage, and the most likely scenario is consolidation with the risk of a retest of the 3,940 level.
XAUUSD forecast for this week: quick overview
- Weekly performance: gold (XAUUSD) enters the new week around 4,050 USD, bolstered by weaker US inflation data: June PPI unexpectedly declined for the first time in almost a year, while the core reading rose by only 0.2%. Against this backdrop, the likelihood of a Federal Reserve rate hike in September fell to around 44% from 50% a day earlier. However, rising oil prices and renewed escalation between the US and Iran preserved inflation risks and limited gold’s recovery
- Support and resistance: on the daily chart, gold maintains a pronounced downtrend after the March reversal from the 5,300–5,400 area. Prices remain below the moving average and are trading in the lower half of Bollinger Bands. The nearest resistance zone is located at 4,080–4,120; a breakout above it would open the way towards 4,240. The 4,399 level remains the key medium-term barrier. The main support level lies at 3,940, and a breakout below it would increase the risk of new local lows
- Fundamentals and outlook: the market remains focused on developments in the Middle East conflict, oil price movements, and new Federal Reserve signals. Soft inflation data supports gold, but it does not yet reflect the consequences of the latest escalation. MACD remains in negative territory, although selling pressure is gradually weakening, while the Stochastic Oscillator suggests a short-term rebound. The baseline scenario for the coming week remains consolidation within the 3,940–4,120 range with a moderately negative bias
Gold (XAUUSD) fundamental analysis
Gold (XAUUSD) closed the week around 4,050 USD per ounce. Investors are monitoring the Fed policy outlook following the release of weaker US inflation data while also watching the escalating conflict in the Middle East.
June producer prices unexpectedly declined for the first time in almost a year due to lower energy prices. The Core PPI rose by only 0.2%, below expectations. Together with soft consumer inflation data, this reduced concerns about an imminent Fed rate hike. The likelihood of a September rate increase was about 44%, down from 50% a day earlier.
At the same time, June statistics still do not reflect the impact of the renewed escalation between the US and Iran. The temporary peace agreement has effectively ceased to operate, while higher oil prices could intensify inflation risks. Therefore, gold continues to receive support from softer Fed expectations, but the geopolitical factor limits certainty and keeps prices within a range.
XAUUSD technical analysis
On the daily chart, gold (XAUUSD) maintains a pronounced downtrend that developed after the March reversal from the 5,300–5,400 area. Quotes consistently reached new local lows and dropped to the 3,940 support level in late June. Gold is now trading around 4,036 and is attempting to stabilise after rebounding from the lower Bollinger Band.
The nearest resistance zone is located at 4,080–4,120, where the middle Bollinger Band and the descending moving average pass. A consolidation above it could trigger a recovery towards 4,240, although the 4,399 level remains the key medium-term barrier. While prices hold below this level, the overall market structure remains bearish.
The main support level is 3,940. A retest of this mark remains likely if selling pressure returns. A breakout below this level may open the way to new lows, while holding this support will allow gold to consolidate further within the 3,940–4,080 range and form a base for corrective growth.
MACD remains deep in negative territory, but the histogram is gradually narrowing, indicating a weakening downward momentum. The Stochastic Oscillator has turned upwards from the lower part of the range, suggesting a short-term recovery. However, a full-fledged trend reversal has not yet been confirmed: for the technical picture to improve, prices need to consolidate above 4,080–4,120.
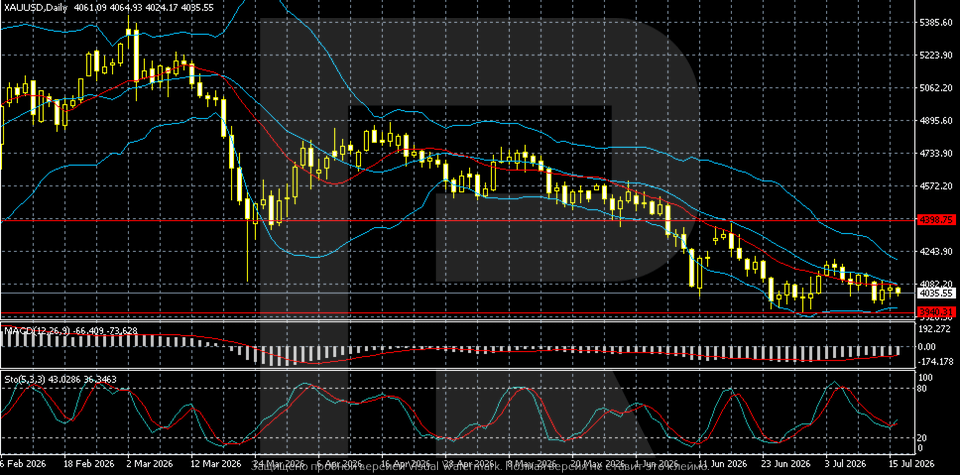
XAUUSD trading scenarios
The fundamental backdrop for gold (XAUUSD) remains mixed. Weak US consumer and producer inflation data reduced concerns about an imminent Fed rate hike, with the likelihood of a September move falling to around 44%. However, renewed escalation between the US and Iran and rising oil prices continue to pose a risk of increased inflationary pressure, limiting the metal’s recovery potential.
Technically, gold maintains a pronounced downtrend. Prices remain below the moving average, trading in the lower half of Bollinger Bands. MACD is in negative territory, although the decline is gradually slowing. The Stochastic Oscillator has turned upwards, suggesting a short-term recovery, but a full-fledged reversal has not yet been confirmed.
- Buy scenario
Consolidation above the 4,080–4,120 resistance zone would signal continued corrective growth and open the way to 4,240. To improve the medium-term picture noticeably, prices need to overcome the 4,399 level.
- Sell scenario
A breakout below the 3,940 support level would confirm renewed downward momentum and create conditions for new local lows.
Conclusion: gold (XAUUSD) remains under pressure despite softer Fed policy expectations. As long as quotes remain below 4,080–4,120, sellers retain the advantage. Further performance will depend on developments in the Middle East conflict, oil prices, and new signals from the US regulator.
Summary
Gold (XAUUSD) ended the week around 4,050 USD per troy ounce. Weaker US inflation data supported the metal: June PPI unexpectedly declined for the first time in almost a year, while the core reading rose by only 0.2%. This reduced the likelihood of a Federal Reserve rate hike in September to around 44%. However, renewed escalation between the US and Iran and higher oil prices mean that inflationary risks remain, so gold’s recovery potential remains limited.
Technically, gold maintains pronounced downward momentum. Prices remain below the moving average, trading in the lower half of Bollinger Bands, confirming sellers’ advantage. The nearest support level stands at 3,940, with the resistance zone at 4,080–4,120. While quotes remain below this area, the baseline scenario remains consolidation with a moderately negative bias and the risk of a retest of the 3,940 support level.
Editors’ picks
 EURUSD forecast 2026–2027: technical analysis, price levels & predictions
EURUSD has pulled back from the 2026 high of 1.1915 and is now trading near 1.1450 — below both EMA65 and EMA200 — with the active scenario shifting from bullish to bearish. The ECB raised rates to 2.40%, but the Fed holds at 3.75%, and US inflation (3.5%) continues to outpace the eurozone (2.8%). A confirmed break below 1.1280 opens the next downward wave toward 1.1080. We break down the key levels, three trading scenarios with entry triggers, and what Deutsche Bank, Morgan Stanley and UBS are forecasting for EURUSD in 2026.
 Gold (XAUUSD) forecast 2026: predictions based on fundamental and technical analysis
Gold has corrected over 25% from its all-time high of 5,597 USD and is now trading near 4,100 USD — testing a critical support zone. Is this the bottom, or will the downtrend continue? We break down the key levels (support 3,920 USD, breakout trigger 4,500 USD), three trading scenarios with entry levels, and what J.P. Morgan, Goldman Sachs and Deutsche Bank are forecasting for gold in 2026.
Forecasts presented in this section only reflect the author’s private opinion and should not be considered as guidance for trading. RoboForex bears no responsibility for trading results based on trading recommendations described in these analytical reviews.