
Gold (XAUUSD) weekly forecast: buyers have a chance
Gold (XAUUSD) enters the week of 27–31 July at a two-week high of 4,130 USD per ounce. Demand for safe-haven assets is supported by attacks on tankers in the Red Sea and the risk of further escalation around the Strait of Hormuz. However, high oil prices are fuelling inflation concerns and expectations of tighter Federal Reserve policy, limiting gold’s upside potential.
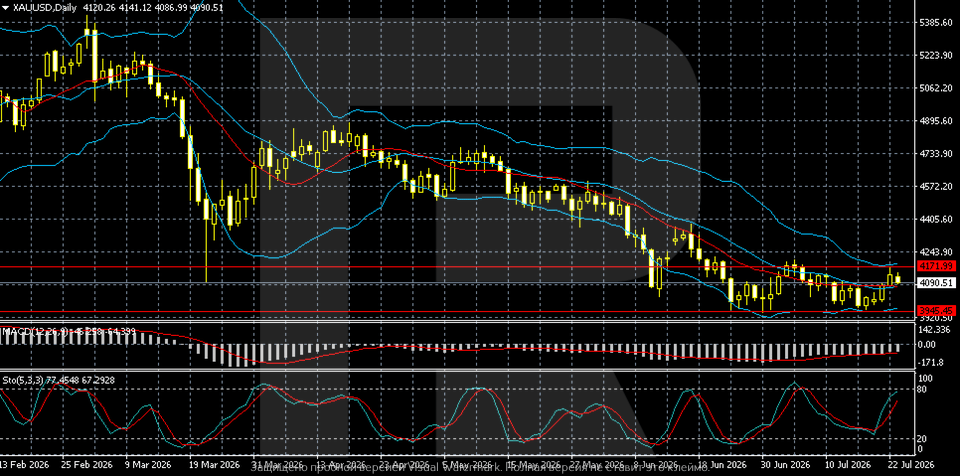
The base case for the week remains moderately positive. Gold is recovering from the 3,945 support level but remains in a long-term downtrend, hovering below the 4,172 resistance level. A breakout above it would open the way towards 4,244. As long as prices remain above the 4,040–4,060 area, another attempt to rise is likely, although without a consolidation above 4,172, the current move will remain a correction.
XAUUSD forecast for this week: quick overview
- Weekly performance: gold (XAUUSD) enters the new week at around 4,130 USD per ounce, a two-week high, with demand for safe-haven assets driven by attacks on Saudi tankers in the Red Sea and threats of further escalation around the Strait of Hormuz. At the same time, rising oil prices are increasing inflation risks and limiting gold’s upside potential amid expectations of two 25-basis-point Federal Reserve rate hikes by March 2027
- Support and resistance: on the daily chart, gold remains in a long-term downtrend following the February high but is recovering from the 3,945 support level. Prices have returned to the middle Bollinger Band. The nearest resistance level is located at 4,172, and a breakout above it would open the way towards 4,244. An intermediate support level lies in the 4,040–4,060 area, while a breakout below the 3,945 mark would increase the risk of a retest of the July lows
- Fundamentals and outlook: the US-Iran conflict, maritime security, oil prices, and Fed rate expectations remain in focus. MACD is holding in negative territory, but selling pressure is easing, while the Stochastic suggests that the short-term recovery may continue. The baseline scenario for the coming week is movement within the 3,945–4,172 range with a moderately positive bias, although only a consolidation above 4,172 would confirm a full-fledged reversal
Gold (XAUUSD) fundamental analysis
Gold (XAUUSD) enters the new week at around 4,130 USD per ounce, close to a two-week high, with Saudi tankers in the Red Sea and threats of further escalation around the Strait of Hormuz bolstering demand for safe-haven assets. Buying on dips is currently offsetting pressure from high oil prices.
Gold is receiving additional support from uncertainty surrounding the conflict between the US and Iran. Any further strikes on energy and transport infrastructure would increase concerns about supply disruptions and boost interest in safe-haven assets. However, the metal remains well below the January high, so it is too early to speak of a full return of the long-term bullish momentum.
The baseline scenario suggests that gold will maintain moderately positive momentum while geopolitical tensions remain high. Upside potential is limited by inflation risks and expectations of two 25-basis-point Fed rate hikes by March 2027. The market estimates the likelihood of the first move as early as September at around 70%.
XAUUSD technical analysis
On the daily chart, XAUUSD remains in a long-term downtrend that formed after the February high. However, gold has been recovering from the 3,945 support level in recent sessions and is now trading at around 4,090 USD. Prices have returned to the middle Bollinger Band, indicating easing selling pressure.
The nearest resistance level is located at 4,172 USD. A confident breakout above this level would allow the recovery to continue towards 4,244 USD, where the upper Bollinger Band is located. As long as quotes remain below 4,172, the current rise appears to be a correction within the broader bearish structure. The key support level remains at 3,945 USD. A return below this level would confirm a renewed downward move and create a risk of a retest of the July lows. The 4,040–4,060 USD area acts as intermediate support.
MACD remains in negative territory, but bearish momentum is gradually weakening. The Stochastic is rising confidently and approaching overbought territory, so the potential for a short-term advance remains, although a pause or another correction may occur near the 4,172 resistance level. The base case is movement within the 3,945–4,172 range with a moderately positive bias.
XAUUSD trading scenarios
The fundamental backdrop for gold (XAUUSD) remains mixed. Geopolitical tensions involving the US and Iran, attacks on tankers in the Red Sea, and risks to shipping through the Strait of Hormuz are supporting demand for safe-haven assets. At the same time, rising oil prices are fuelling inflation concerns and expectations of tighter Fed policy, with the market pricing in two 25-basis-point rate hikes by March 2027.
Technically, gold remains in a long-term downtrend. Prices have returned to the middle Bollinger Band, while MACD remains in negative territory, although bearish momentum is weakening. The Stochastic is rising and suggests a further correction, although a full-fledged reversal has not yet been confirmed.
- Buy scenario
A consolidation above the 4,172 resistance level would signal a continued recovery and open the way towards 4,244, where the upper Bollinger Band is located.
- Sell scenario
A breakout below the 3,945 support level would confirm the resumption of the downtrend and increase the risk of a retest of the July lows. The 4,040–4,060 area remains an intermediate support zone.
Conclusion: gold (XAUUSD) retains a moderately positive short-term bias, but the current rise remains a correction within the broader downtrend. To improve the technical picture, buyers need to consolidate above 4,172. Further price action will depend on geopolitics, oil prices, and Fed rate expectations.
Summary
Gold (XAUUSD) enters the new week at around 4,130 USD per troy ounce, close to a two-week high. Demand for safe-haven assets is supported by attacks on Saudi tankers in the Red Sea and the risk of further escalation around the Strait of Hormuz. At the same time, rising oil prices are increasing inflation concerns and expectations of tighter Fed policy: the market is pricing in two 25-basis-point rate hikes by March 2027, with the probability of the first move as early as September estimated at around 70%.
Technically, gold remains in a long-term downtrend but is recovering from the 3,945 support level. Prices have returned to the middle Bollinger Band, while selling pressure is gradually easing. The nearest resistance level is at 4,172, and a breakout above it would open the way towards 4,244. Intermediate support is located in the 4,040–4,060 area. As long as quotes remain below 4,172, the baseline scenario suggests movement within the 3,945–4,172 range with a moderately positive bias.
Editors’ picks
 EURUSD forecast 2026–2027: technical analysis, price levels & predictions
EURUSD has pulled back from the 2026 high of 1.1915 and is now trading near 1.1450 — below both EMA65 and EMA200 — with the active scenario shifting from bullish to bearish. The ECB raised rates to 2.40%, but the Fed holds at 3.75%, and US inflation (3.5%) continues to outpace the eurozone (2.8%). A confirmed break below 1.1280 opens the next downward wave toward 1.1080. We break down the key levels, three trading scenarios with entry triggers, and what Deutsche Bank, Morgan Stanley and UBS are forecasting for EURUSD in 2026.
 Gold (XAUUSD) forecast 2026: predictions based on fundamental and technical analysis
Gold has corrected over 25% from its all-time high of 5,597 USD and is now trading near 4,100 USD — testing a critical support zone. Is this the bottom, or will the downtrend continue? We break down the key levels (support 3,920 USD, breakout trigger 4,500 USD), three trading scenarios with entry levels, and what J.P. Morgan, Goldman Sachs and Deutsche Bank are forecasting for gold in 2026.
Forecasts presented in this section only reflect the author’s private opinion and should not be considered as guidance for trading. RoboForex bears no responsibility for trading results based on trading recommendations described in these analytical reviews.