
Gold (XAUUSD) weekly forecast: selling pause does not end bearish trend
Gold (XAUUSD) enters the week of 3–7 August at around 4,059 USD per ounce. The Federal Reserve held the interest rate steady, but the probability of tighter policy in September rose to 67%. Rising oil prices following renewed tensions between the US and Iran are adding further pressure.
The baseline scenario for the week remains moderately negative. Gold maintains a long-term downtrend and is consolidating within the 3,945–4,172 range. A breakout below the 3,945 support level would increase the risk of new local lows, while a consolidation above 4,172 would be the first sign of a more sustainable recovery and open the way towards 4,244. As long as prices remain below 4,172, any rise will appear corrective within the broader downtrend.
XAUUSD forecast for this week: quick overview
- Weekly performance: gold (XAUUSD) enters the new week at around 4,059 USD per ounce after falling below 4,050 and losing most of its recent gains. Pressure increased after the Federal Reserve meeting: the regulator left the rate unchanged, but three FOMC members supported a hike. The likelihood of a 25-basis-point move in September rose to 67%, supporting yields and limiting demand for gold
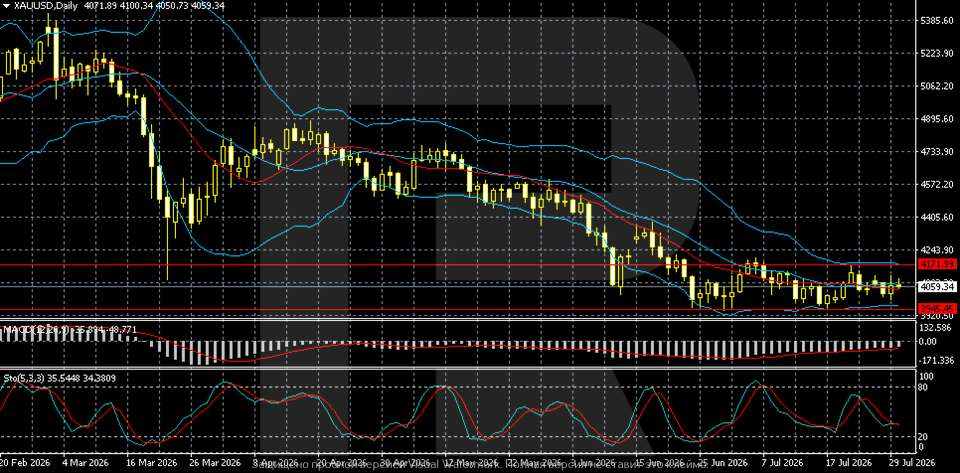
- Support and resistance: on the daily chart, gold remains in a long-term downtrend following the February high, although prices have moved into consolidation since late June. The key support level lies at 3,945; a breakout below it would increase the risk of new local lows. The main resistance level is located at 4,172: a consolidation above this mark would be the first signal of a breakout from the sideways range and open the way towards 4,244. An intermediate support zone lies around 4,040–4,060
- Fundamentals and outlook: the focus remains on further Federal Reserve signals, oil prices, and the US-Iran conflict. Rising oil prices are fuelling inflation concerns and supporting expectations of tighter policy, while geopolitical tensions are simultaneously driving demand for safe-haven assets. MACD remains in negative territory, but selling pressure is easing, while the Stochastic Oscillator has yet to confirm a sustained upward reversal. The baseline scenario for the week remains movement within the 3,945–4,172 range with a moderately negative bias
Gold (XAUUSD) fundamental analysis
Gold (XAUUSD) fell below 4,050 USD per ounce by the end of the week, losing the momentum of its earlier gains. Pressure increased after the Federal Reserve meeting, where the regulator kept the interest rate unchanged but gave the market little reason to expect an imminent policy easing.
Three FOMC members voted for a rate hike. Federal Reserve Chairman Kevin Warsh stressed that the pause did not mean abandoning further tightening. The regulator will continue to rely on incoming data, meaning each new inflation or economic release could significantly shift market expectations. The likelihood of a 25-basis-point rate hike in September rose to around 67% from 56% a day earlier.
At the same time, expectations of a larger 50-basis-point move have almost disappeared. This repricing remains negative for gold: the prospect of borrowing costs staying high supports yields and limits demand for the metal.
Additional pressure came from rising oil prices following a new series of US strikes on Iran in response to attacks on American forces in the Middle East. The risk of energy supply disruptions further fuelled inflation concerns.
XAUUSD technical analysis
On the daily chart, XAUUSD remains in a long-term downtrend that has been developing since the February high. However, since late June, the decline has shifted into consolidation, with gold trading near 4,059 and remaining within a broad sideways range.
The key support level lies at 3,945. A breakout below this mark would confirm the return of sellers and create conditions for new local lows. The main resistance level is located at 4,172. A consolidation above this mark would be the first signal that the sideways range is ending and a more sustainable recovery is developing.
Prices remain below the middle Bollinger Band, while the bands themselves are gradually narrowing, reflecting lower volatility. MACD is in negative territory, but bearish momentum continues to weaken. The Stochastic Oscillator is holding near 35 and has yet to show a convincing upward reversal.
The baseline scenario remains XAUUSD movement within the 3,945–4,172 range with a moderately negative bias. As long as quotes remain below 4,172, the current recovery appears to be part of the consolidation rather than a full-fledged trend reversal.
XAUUSD trading scenarios
The fundamental backdrop for gold (XAUUSD) remains mixed, with the balance of factors tilted to the downside. The Federal Reserve held the interest rate steady. The likelihood of a 25-basis-point rate hike in September rose to 67%, supporting yields and limiting demand for gold. Geopolitical tensions in the Middle East remain a defensive factor, but rising oil prices are also increasing inflation risks.
Technically, gold remains in a long-term downtrend, although prices have moved into a consolidation phase since late June. Prices are hovering below the middle Bollinger Band, while MACD remains in negative territory, but bearish momentum is gradually weakening. The Stochastic is holding near 35 and has not yet confirmed a decisive upward reversal.
- Buy scenario
A consolidation above the 4,172 resistance level would signal a breakout from the sideways range and open the way towards 4,244. Until this level is broken, any rise will remain corrective.
- Sell scenario
A breakout below the 3,945 support level would confirm a resumption of the downtrend and create conditions for a retest of the July lows. The 4,040–4,060 area remains an intermediate support zone.
Conclusion: gold (XAUUSD) retains a moderately negative bias and is trading within the 3,945–4,172 range. To improve the technical picture, buyers need to gain a foothold above 4,172. Further price action will depend on Federal Reserve signals, oil prices, and developments in the Middle East conflict.
Summary
Gold (XAUUSD) enters the new week at around 4,059 USD per troy ounce. Pressure intensified after the Federal Reserve meeting: the regulator left the rate unchanged, but three FOMC members voted for a hike, while Kevin Warsh did not rule out further policy tightening. The probability of a 25-basis-point rate hike in September rose to 67% from 56% a day earlier. Rising oil prices added to the pressure.
Technically, gold remains in a long-term downtrend, although prices have moved into a consolidation phase since late June. Quotes remain below the middle Bollinger Band, while MACD stays in negative territory, although selling pressure is gradually easing. The key support level lies at 3,945; a breakout below it would increase the risk of new local lows. The main resistance level is located at 4,172, with a consolidation above this mark likely to open the way towards 4,244. As long as gold trades below 4,172, the baseline scenario remains movement within the 3,945–4,172 range with a moderately negative bias.
Editors’ picks
 EURUSD forecast 2026–2027: technical analysis, price levels & predictions
EURUSD has pulled back from the 2026 high of 1.1915 and is now trading near 1.1450 — below both EMA65 and EMA200 — with the active scenario shifting from bullish to bearish. The ECB raised rates to 2.40%, but the Fed holds at 3.75%, and US inflation (3.5%) continues to outpace the eurozone (2.8%). A confirmed break below 1.1280 opens the next downward wave toward 1.1080. We break down the key levels, three trading scenarios with entry triggers, and what Deutsche Bank, Morgan Stanley and UBS are forecasting for EURUSD in 2026.
 Gold (XAUUSD) forecast 2026: predictions based on fundamental and technical analysis
Gold has corrected over 25% from its all-time high of 5,597 USD and is now trading near 4,100 USD — testing a critical support zone. Is this the bottom, or will the downtrend continue? We break down the key levels (support 3,920 USD, breakout trigger 4,500 USD), three trading scenarios with entry levels, and what J.P. Morgan, Goldman Sachs and Deutsche Bank are forecasting for gold in 2026.
Forecasts presented in this section only reflect the author’s private opinion and should not be considered as guidance for trading. RoboForex bears no responsibility for trading results based on trading recommendations described in these analytical reviews.