
Bitcoin (BTCUSD) may rise, but it needs more support
Bitcoin (BTCUSD) climbed to 64,772 USD. The market is keeping a close eye on external developments and the US bill to create reserves. For more details, see our analysis for 20 July 2026.
BTCUSD forecast: key takeaways
- The Bitcoin (BTCUSD) price is attempting to rise, but the signals for buyers are rather mixed
- The volume of BTC held in ETFs is gradually declining
- BTCUSD forecast for 20 July 2026: 64,300 or 65,100
Fundamental analysis
The Bitcoin (BTCUSD) price is rising to 64,772 USD on Monday. Expected volatility declined from 48 to 40. The put/call ratio for options fell to about 0.59, the lowest level in six months.
In the US, the House of Representatives discussed bill H.R. 8957, which proposes the creation of a strategic Bitcoin reserve managed by the Treasury. The document covers methods of purchasing BTC, auditing, custody, and transparency requirements for state reserves.
On-chain metrics are sending mixed signals. Some indicators point to accumulation and the possible formation of a local bottom, but the MVRV Z-score, proximity to the realised price, and market breadth do not yet confirm a sustainable reversal. At the same time, the volume of Bitcoin in ETFs has started to decline.
The discussion around the Clarity Act also drew attention, but the text of the bill has not yet been published and no vote has taken place, so regulatory uncertainty remains. MicroStrategy still holds 843,775 BTC, while the company’s US dollar liquidity increased by 466.7 million USD to 3 billion USD thanks to share sales through the ATM program.
The Bitcoin (BTCUSD) forecast is moderately positive.
Technical outlook
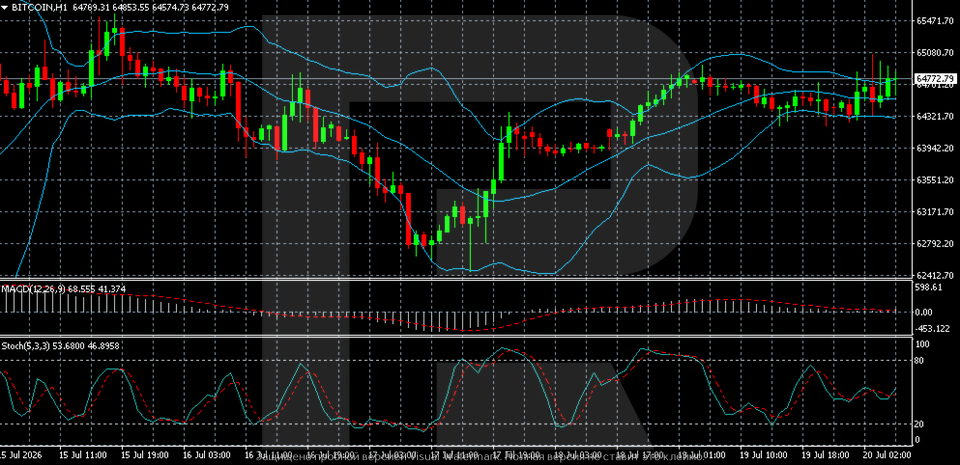
On the hourly chart, Bitcoin is recovering after falling to the 62,400–62,800 area and is now trading around 64,770. The price is holding above the middle Bollinger Band and is again approaching the upper boundary of the indicator, signalling continued local demand.
The nearest resistance level is located in the 64,900–65,100 zone, with a stronger barrier at 65,450. Support levels lie at 64,300 and 63,950. As long as BTCUSD remains above 64,300, continued growth and a retest of local highs remain likely. A move back below this level would increase the risk of a decline to 63,950.
MACD is near the zero line and does not yet confirm strong trend momentum. The Stochastic Oscillator has turned upwards from the neutral zone, supporting the short-term upside scenario. The base case remains consolidation in the 64,300–65,100 range with a moderately positive bias.
BTCUSD overview
- Asset: BTCUSD
- Time interval: H1 (intraday)
- Trend: upward with signs of consolidation
- Key resistance levels: 65,100 and 65,450
- Key support levels: 64,300 and 63,950
Bitcoin trading scenarios for today
Main scenario (Buy Stop)
A breakout and consolidation above the 65,100 USD resistance level would confirm increased demand and open the way to the next target near 65,450 USD. This scenario is supported by a price recovery from the July lows and the discussion about creating a strategic Bitcoin reserve in the US.
- Take Profit: 65,450
- Stop Loss: 64,800
Alternative scenario (Sell Stop)
A breakout below the 64,300 USD support level would indicate weaker buying interest and a downward correction. In this case, the nearest target will be the 63,950 USD level.
- Take Profit: 63,950
- Stop Loss: 64,600
Risk factors
The key risks to the BTCUSD upside scenario remain the declining volume of Bitcoin in spot ETFs, mixed on-chain signals, and the lack of strong trend momentum from MACD. A stronger dollar and declining demand for risk assets may also add to pressure. Until the price consolidates above 65,100 USD, consolidation remains the baseline scenario.
Summary
The Bitcoin price is attempting to rise, but consolidation remains the baseline scenario. The BTCUSD forecast for today, 20 July 2026, suggests that the price could remain within the 64,300–65,100 range, with attempts to move higher.
Editors’ picks
 EURUSD forecast 2026–2027: technical analysis, price levels & predictions
EURUSD has pulled back from the 2026 high of 1.1915 and is now trading near 1.1450 — below both EMA65 and EMA200 — with the active scenario shifting from bullish to bearish. The ECB raised rates to 2.40%, but the Fed holds at 3.75%, and US inflation (3.5%) continues to outpace the eurozone (2.8%). A confirmed break below 1.1280 opens the next downward wave toward 1.1080. We break down the key levels, three trading scenarios with entry triggers, and what Deutsche Bank, Morgan Stanley and UBS are forecasting for EURUSD in 2026.
 Gold (XAUUSD) forecast 2026: predictions based on fundamental and technical analysis
Gold has corrected over 25% from its all-time high of 5,597 USD and is now trading near 4,100 USD — testing a critical support zone. Is this the bottom, or will the downtrend continue? We break down the key levels (support 3,920 USD, breakout trigger 4,500 USD), three trading scenarios with entry levels, and what J.P. Morgan, Goldman Sachs and Deutsche Bank are forecasting for gold in 2026.
Forecasts presented in this section only reflect the author’s private opinion and should not be considered as guidance for trading. RoboForex bears no responsibility for trading results based on trading recommendations described in these analytical reviews.