
Dogecoin on the verge of change as ETFs and ÐOGE Pay reshape the landscape
House of Doge and MoonPay continue to develop ÐOGE Pay, which could provide additional support for the Dogecoin price, which currently stands at 0.08750. For more details, see our analysis for 28 August 2026.
DOGEUSD forecast: key takeaways
- House of Doge and MoonPay continue to develop ÐOGE Pay
- House of Doge is promoting Dogecoin adoption through Paxos
- Payment projects and ETFs are creating new opportunities for DOGE
- DOGEUSD forecast for 28 August 2026: 0.08650 and 0.09300
Fundamental analysis
Today’s DOGEUSD fundamental analysis takes into account that Dogecoin is consolidating near 0.08750, continuing its correction after a rapid rise.
House of Doge and MoonPay continue to develop ÐOGE Pay. At this stage, Dogecoin is accepted by more than 6,000 merchants, with the next phase of payment network expansion scheduled for the third quarter. If this does lead to an increase in transaction volumes, Dogecoin could become significantly more useful in real-world applications over time.
Spot exchange-traded products based on Dogecoin are already trading in the US, including the 21Shares DOGE ETF, which was listed on the Nasdaq in January. This makes the asset more accessible to ordinary investors and creates another potential source of demand.
In addition, House of Doge is promoting Dogecoin adoption through Paxos. This move could provide access to DOGE for more than 100 million users through payment services in over 150 countries. This is a significant advantage for the coin, as it concerns not only market speculation but also broader adoption of the asset itself.
Payment projects and ETFs are creating new opportunities for DOGE. However, it is still impossible to say with confidence that infrastructure development alone will lead to a significant and lasting increase in demand for the token. In addition, Dogecoin retains an inflationary issuance model, which continues to weaken its investment appeal.
The DOGEUSD forecast for 28 August takes into account the main current drivers: the expansion of ÐOGE Pay, growing institutional investor interest through ETFs, and new payment integrations. However, for truly sustainable growth, it is important that all of this translates into real-world use of Dogecoin rather than simply expanding the infrastructure around it.
Technical outlook
On the H4 chart, DOGEUSD formed a Hammer reversal pattern near the lower Bollinger Band. At this stage, the price could form an upward wave as the signal plays out, with the upside target at the 0.09300 resistance level. A breakout above this mark would open the way for a further upward wave.
At the same time, today’s DOGEUSD technical analysis also suggests another scenario. The price could test the 0.08650 support level and then rebound, continuing its upward trajectory.
DOGEUSD overview
- Asset: DOGEUSD
- Timeframe: H4 (intraday)
- Trend: bullish
- Key resistance levels: 0.08950 and 0.09300
- Key support levels: 0.08650 and 0.08420
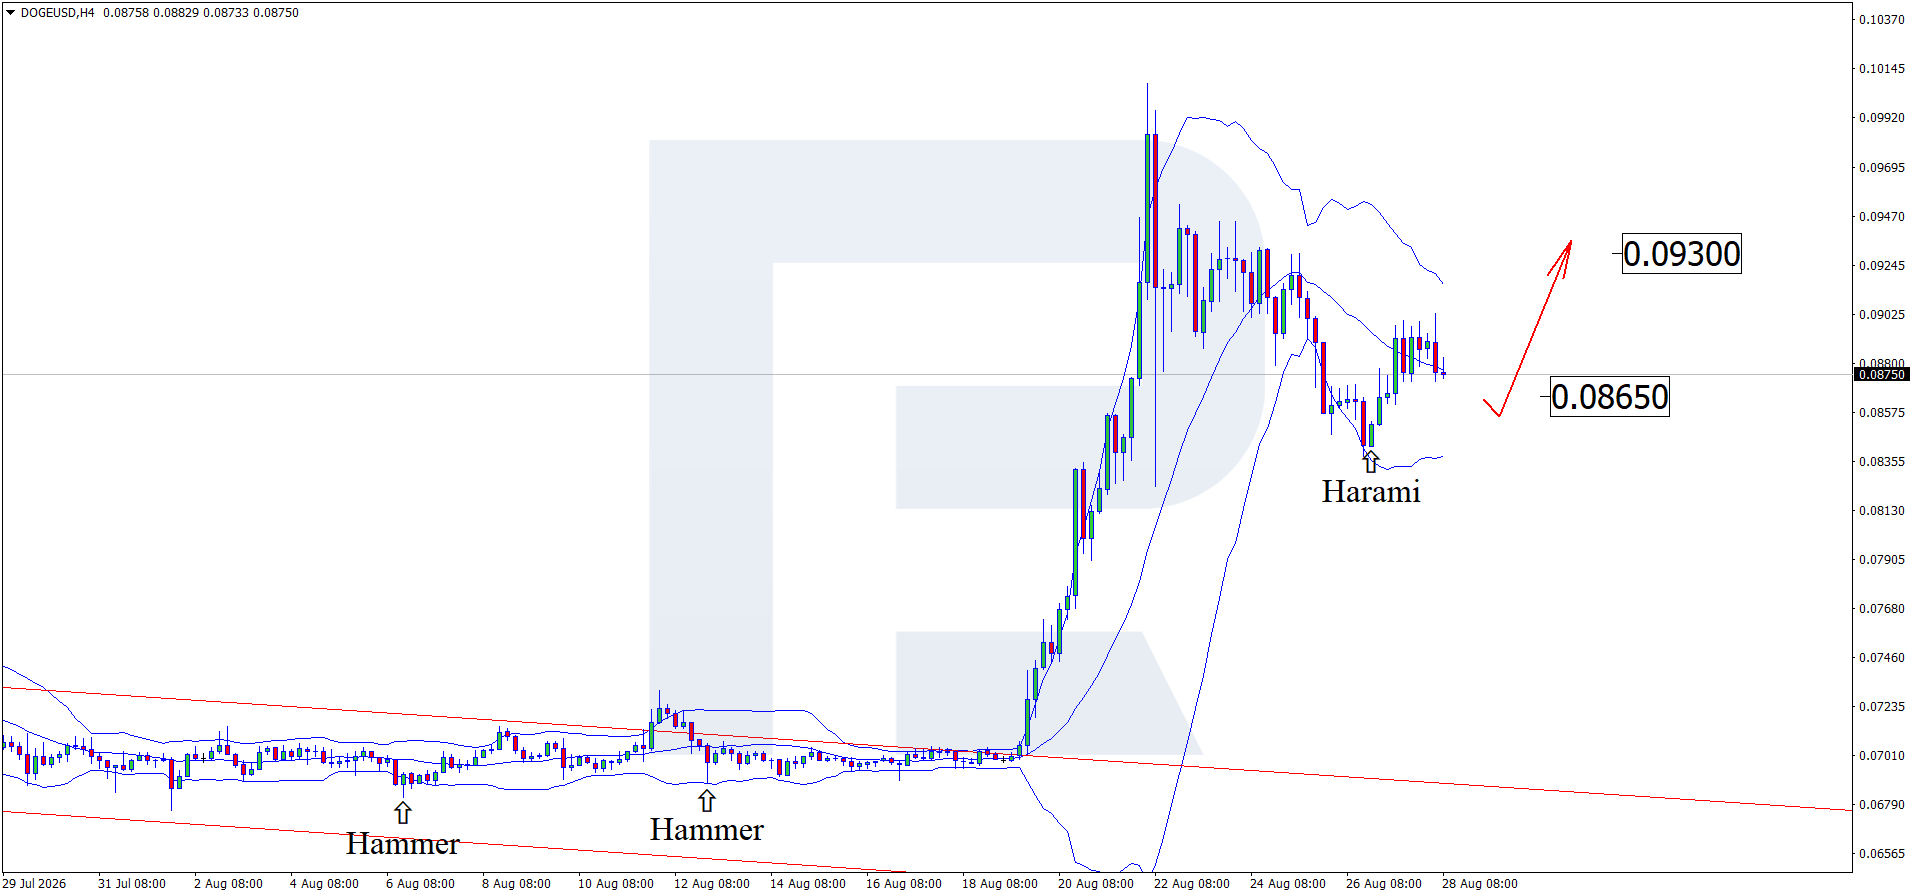
Dogecoin trading scenarios for today
Main scenario (Buy Stop)
A breakout above the resistance level, with the price consolidating above 0.08950, would indicate a new upward wave with a target at 0.09300.
- Current price: 0.08750
- Entry price: 0.08950
- Stop loss: 0.08850
- Take profit: 0.09300
- Risk-to-reward ratio: more than 1:3
Alternative scenario (Sell Stop)
A breakout below the support level, with the price consolidating below 0.08650, would signal a continued correction, with the downside target at 0.08420.
- Entry price: 0.08650
- Stop loss: 0.08750
- Take profit: 0.08420
- Risk-to-reward ratio: more than 1:2
The trade idea is valid until midnight on 3 September 2026 (server time, UTC+3).
Risk factors
The main risks to DOGEUSD growth are a potential Federal Reserve rate hike, a rebound in US Treasury yields, and a stronger US dollar, which could reduce demand for risk assets. An additional risk factor is that DOGE remains heavily overbought.
Summary
The expansion of ÐOGE Pay, growing institutional investor interest through ETFs, and new payment integrations are supporting the Dogecoin price. Today’s DOGEUSD technical analysis suggests that the price could rise towards 0.09300 after the correction is complete.
Editors’ picks
 EURUSD forecast 2026–2027: technical analysis, price levels & predictions
EURUSD has recovered from the July lows and is trading near 1.1545 — back in bullish territory. The pair has reclaimed EMA65 on the daily, formed a bullish EMA crossover on H4, and the US-eurozone GDP gap has narrowed sharply (US 1.5% vs eurozone 1.0%). Goldman Sachs and Deutsche Bank both now target 1.2500 by year-end. A confirmed close above 1.1700 opens the path to 1.1805. We break down the key levels, three trading scenarios, and what the unprecedented 9-3 FOMC dissent vote means for EURUSD.
 Gold (XAUUSD) forecast 2026: technical analysis, price levels & predictions
Gold has reversed its downtrend and is trading near 4,360 USD, back above both EMA65 and EMA200. ETF flows turned positive in July with 3 billion USD of net inflows, and central banks bought 288.9 tonnes in Q2 — up 62% year-on-year. A breakout above 4,500 USD opens the path to 4,855 USD and the 5,597 USD all-time high. We break down the key levels, three trading scenarios with entry triggers, and what J.P. Morgan, Deutsche Bank and Goldman Sachs are forecasting for gold in 2026.
Forecasts presented in this section only reflect the author’s private opinion and should not be considered as guidance for trading. RoboForex bears no responsibility for trading results based on trading recommendations described in these analytical reviews.