
Ethereum (ETHUSD) gains bullish momentum thanks to shrinking supply
The ETHUSD rate is maintaining positive momentum amid rising investor demand and renewed interest in Ethereum, with the price currently at 1,925. Find out more in our analysis for 21 July 2026.
ETHUSD forecast: key takeaways
- Ethereum ETFs in the US saw renewed capital inflows after a prolonged period of outflows
- Large ETH holders are maintaining their positions and are in no rush to lock in profits despite rising quotes
- Ethereum outflows from centralised exchanges continue, reducing the available market supply
- ETHUSD forecast for 21 July 2026: 2,125
Fundamental analysis
The ETHUSD rate continues its upward movement, posting gains for the fourth consecutive trading session. Buyers are currently testing the key local resistance level at 1,945 USD. A confident breakout could signal strengthening bullish momentum and open the door for a further recovery.
Ethereum is supported by improving market sentiment and the return of institutional investor interest. After a prolonged period of outflows, US spot Ethereum ETFs recorded capital inflows again, with net inflows totalling 36.7 million USD on 17 July, pointing to a gradual recovery in demand from large players.
The behaviour of long-term holders remains an additional positive factor. Large ETH holders are not rushing to take profits at current levels, while the continuing outflow of coins from centralised exchanges is reducing the amount of available supply in the market.
Bullish sentiment was also reinforced by the actions of large market participants. Last week, BitMEX founder Arthur Hayes purchased 1,293 ETH worth about 2.48 million USD in total, which the market interpreted as an additional signal of confidence in Ethereum’s prospects.
Technical outlook
ETHUSD is testing the upper boundary of the descending channel, with the price already consolidating above the upper boundary of the Double Bottom reversal pattern. This trend indicates stronger buying activity and increases the likelihood of continued upward momentum. Today’s ETHUSD forecast suggests a bullish scenario with the potential for movement towards 2,125 USD.
The technical picture remains favourable for buyers. The Stochastic Oscillator turned upwards after rebounding from the upward support line, confirming the recovery of positive momentum. A confident breakout above the upper boundary of the descending channel, followed by price consolidation above the key resistance level at 1,945 USD, would further confirm the upside. In this case, buyers will receive confirmation of the strength of the current move, which could accelerate the upward correction.
However, the risk of an alternative scenario remains. If sellers regain control of the market, a breakout below the lower boundary of the forming bullish channel and consolidation below 1,845 USD would signal weakening upward momentum. In this case, the likelihood of a deeper correction will increase.
ETHUSD overview
- Asset: ETHUSD
- Timeframe: H4 (Intraday)
- Trend: moderately upward
- Key resistance levels: 1,945 and 2,035
- Key support levels: 1,860 and 1,755
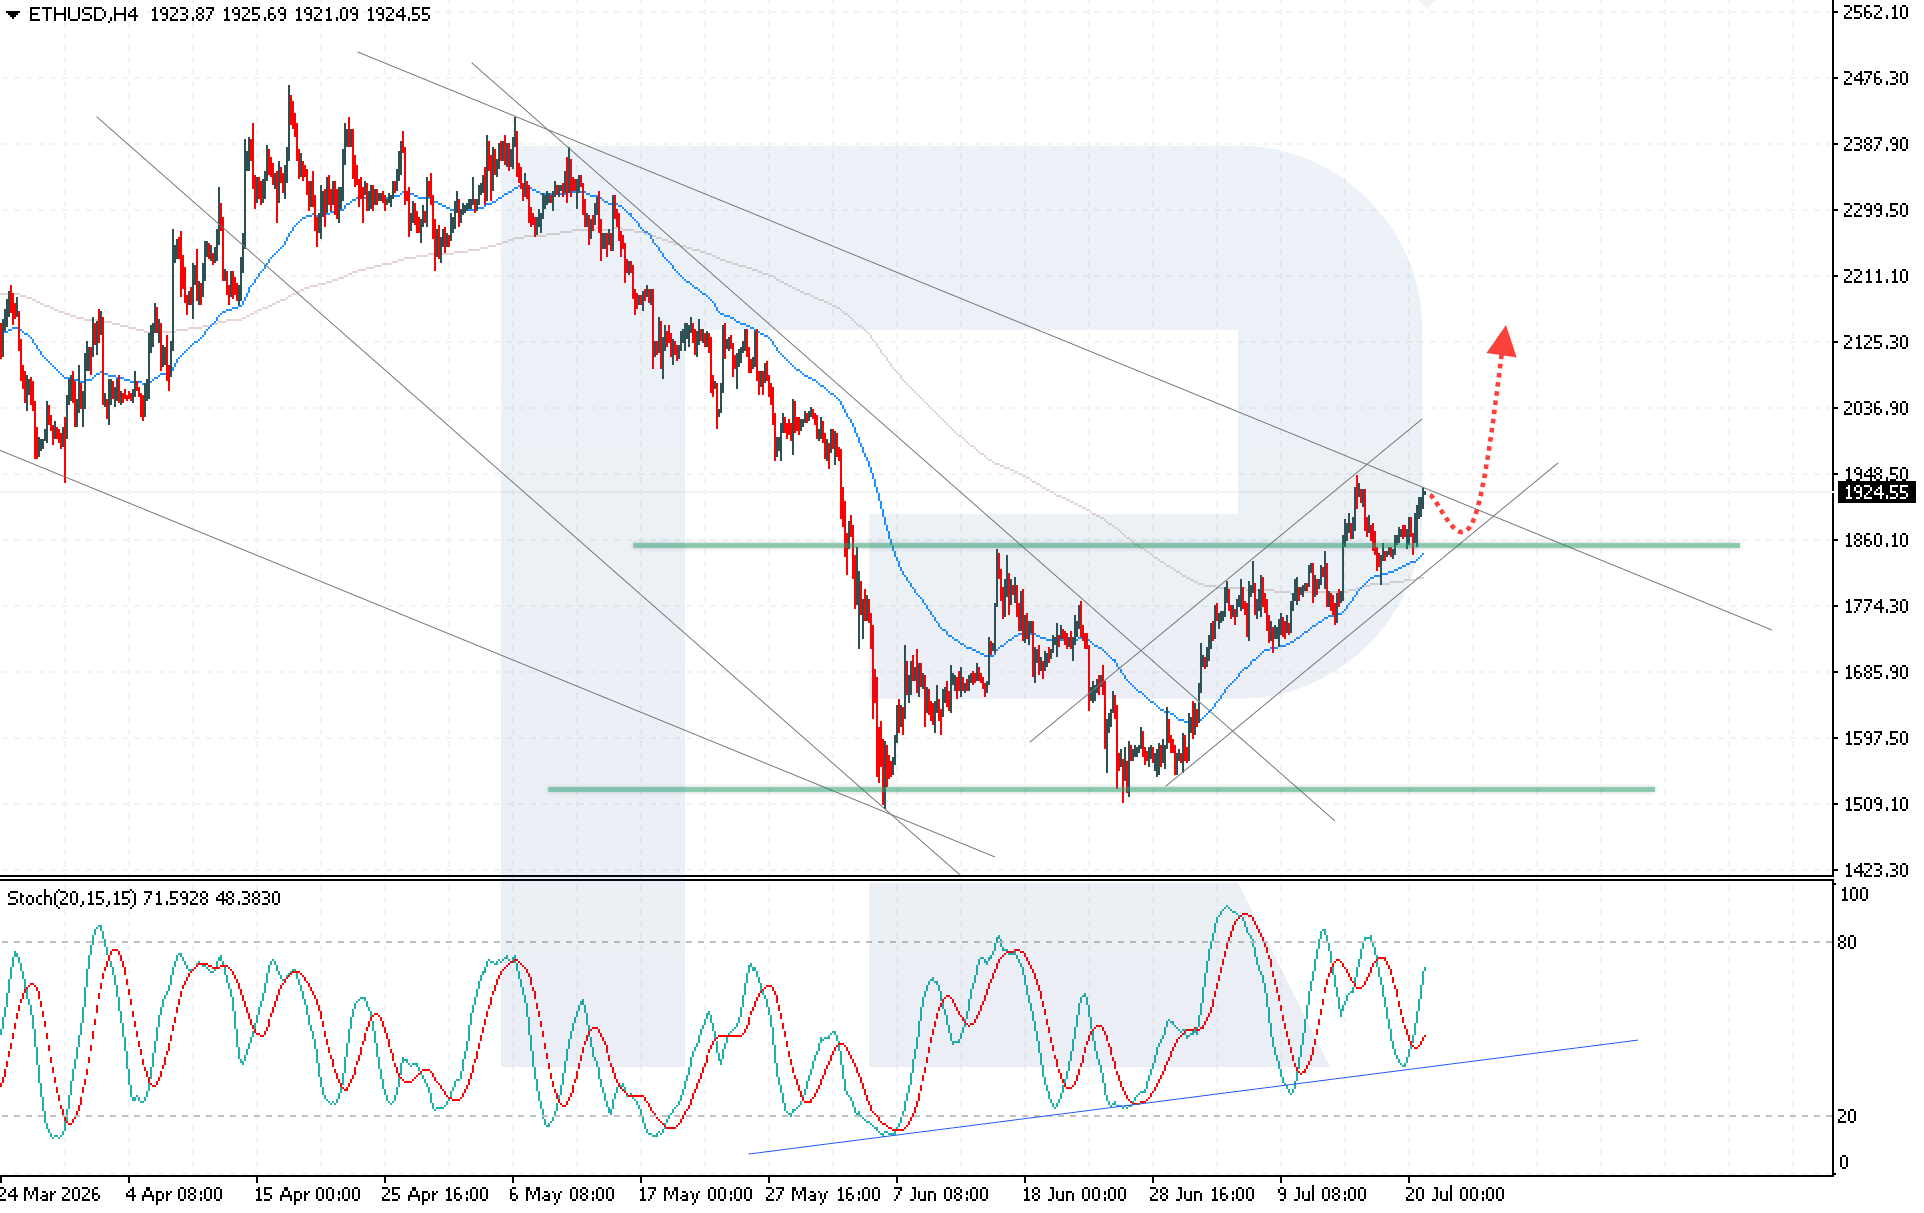
Ethereum trading scenarios for today
Main scenario (Buy Stop)
Consolidation above the local resistance level at 1,950.00 would indicate increased buying pressure and confirm a breakout above the upper boundary of the medium-term descending channel.
- Take Profit: 2,125.00
- Stop Loss: 1,855.00
Alternative scenario (Sell Stop)
A breakout below the lower boundary of the bullish channel, with consolidation below 1,855.00, would signal stronger bearish pressure and may trigger a deeper correction in ETHUSD.
- Take Profit: 1,685.00
- Stop Loss: 1,875.00
Risk factors
The main risk to the ETHUSD upside scenario remains buyers’ failure to overcome the 1,945 USD resistance level, which may trigger profit-taking and increased selling pressure. A further negative factor would be weaker institutional investor interest, which would increase the available Ethereum supply and create conditions for a correction.
Summary
The ETHUSD forecast for today remains positive, while the key factor for further movement will be buyers’ ability to overcome the 1,945 USD resistance level.
Editors’ picks

EURUSD forecast 2026–2027: technical analysis, price levels & predictions
EURUSD has pulled back from the 2026 high of 1.1915 and is now trading near 1.1450 — below both EMA65 and EMA200 — with the active scenario shifting from bullish to bearish. The ECB raised rates to 2.40%, but the Fed holds at 3.75%, and US inflation (3.5%) continues to outpace the eurozone (2.8%). A confirmed break below 1.1280 opens the next downward wave toward 1.1080. We break down the key levels, three trading scenarios with entry triggers, and what Deutsche Bank, Morgan Stanley and UBS are forecasting for EURUSD in 2026.

Gold (XAUUSD) forecast 2026: predictions based on fundamental and technical analysis
Gold has corrected over 25% from its all-time high of 5,597 USD and is now trading near 4,100 USD — testing a critical support zone. Is this the bottom, or will the downtrend continue? We break down the key levels (support 3,920 USD, breakout trigger 4,500 USD), three trading scenarios with entry levels, and what J.P. Morgan, Goldman Sachs and Deutsche Bank are forecasting for gold in 2026.
Forecasts presented in this section only reflect the author’s private opinion and should not be considered as guidance for trading. RoboForex bears no responsibility for trading results based on trading recommendations described in these analytical reviews.