
Ethereum (ETHUSD) is well positioned and only needs momentum
Ethereum (ETHUSD) is trading near 1,861 USD on Tuesday. Tokenisation could provide support for ETH. Discover more in our analysis for 4 August 2026.
ETHUSD forecast: key takeaways
- The Ethereum price remains within a range
- Investors see no risks in the recent correction
- ETHUSD forecast for 4 August 2026: 1,845 or 1,888
Fundamental analysis
The Ethereum price is trading near 1,861 USD, with the fundamental backdrop improving significantly thanks to renewed institutional demand. In July, spot ETH ETFs attracted around 365 million USD, their best monthly result since the beginning of 2026. The sustained inflow shows that large investors continue to increase their exposure to Ethereum despite recent market volatility.
Another positive signal was activity among large holders. BitMEX co-founder Arthur Hayes bought back 1,337 ETH for approximately 2.5 million USD only a few days after exiting his previous position. Such a rapid return to the market suggests that he viewed the recent decline as an opportunity to re-enter rather than the beginning of a prolonged correction.
Interest in Ethereum is also supported by its expanding role in the tokenisation of real-world assets, stablecoins, and decentralised finance. The combination of ETF inflows and purchases by major market participants reinforces the moderately positive medium-term outlook. If institutional demand persists, the fundamental conditions for ETH’s continued recovery remain favourable.
The Ethereum (ETHUSD) outlook is moderately positive.
Technical outlook
On the H1 chart, Ethereum (ETHUSD) is trading near 1,862 and remains range-bound after recovering from the 1,831–1,840 area. The price is hovering near the middle Bollinger Band, while the indicator’s boundaries are gradually narrowing, indicating lower volatility and the absence of sustained directional momentum.
The nearest resistance level lies in the 1,874–1,888 area. An upward breakout would allow buyers to extend the recovery towards 1,902. The support level is located at 1,845, followed by the 1,831–1,817 area. As long as ETH holds above 1,845, a retest of the range’s upper boundary remains likely.
MACD is near the zero line and does not yet confirm a strong upward move. The Stochastic Oscillator has turned upwards and is approaching overbought territory, suggesting growth may slow near the resistance level. The baseline scenario remains movement within the 1,845–1,888 range with a moderately positive bias.
ETHUSD overview
- Asset: ETHUSD
- Timeframe: H1 (intraday)
- Trend: range with a moderately positive bias
- Key resistance levels: 1,888 and 1,902
- Key support levels: 1,845 and 1,831
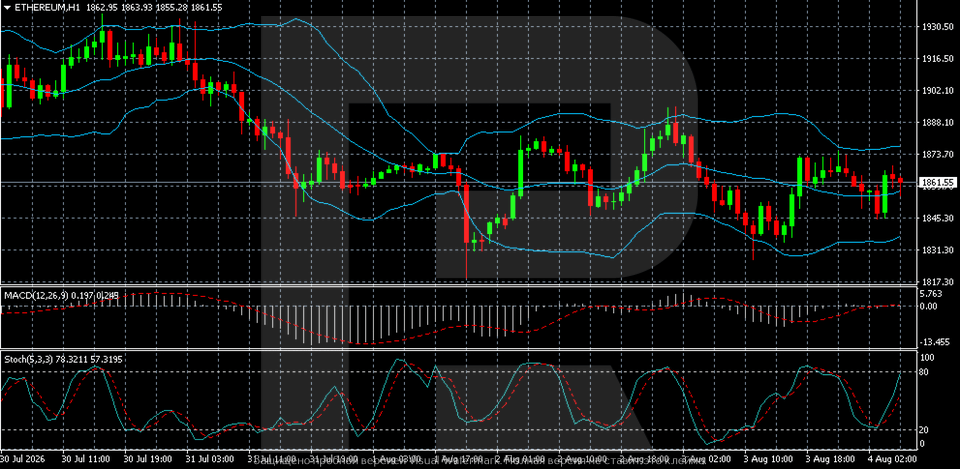
Ethereum trading scenarios for today
Main scenario (Buy Stop)
A breakout and consolidation above the 1,888 resistance level would confirm increased buying pressure and create conditions for continued recovery in ETHUSD.
- Take Profit: 1,902
- Stop Loss: 1,875
Alternative scenario (Sell Stop)
A breakout and consolidation below the 1,845 support level would indicate a downward exit from the range and increase the risk of a deeper correction.
- Take Profit: 1,831
- Stop Loss: 1,860
Risk factors
The main risk to the ETHUSD bullish scenario remains buyers’ failure to overcome the 1,888 resistance level as the Stochastic Oscillator approaches overbought territory. Additional pressure could come from ETF outflows, reduced activity among large investors, or deteriorating sentiment in the cryptocurrency market. As long as the price remains above 1,845, the fundamental backdrop and technical structure retain a moderately positive bias.
Summary
The Ethereum price has entered a range, while fundamental support is strengthening. The ETHUSD forecast for today, 4 August 2026, suggests range-bound trading between 1,845 and 1,888.
Editors’ picks
 EURUSD forecast 2026–2027: technical analysis, price levels & predictions
EURUSD has pulled back from the 2026 high of 1.1915 and is now trading near 1.1450 — below both EMA65 and EMA200 — with the active scenario shifting from bullish to bearish. The ECB raised rates to 2.40%, but the Fed holds at 3.75%, and US inflation (3.5%) continues to outpace the eurozone (2.8%). A confirmed break below 1.1280 opens the next downward wave toward 1.1080. We break down the key levels, three trading scenarios with entry triggers, and what Deutsche Bank, Morgan Stanley and UBS are forecasting for EURUSD in 2026.
 Gold (XAUUSD) forecast 2026: predictions based on fundamental and technical analysis
Gold has corrected over 25% from its all-time high of 5,597 USD and is now trading near 4,100 USD — testing a critical support zone. Is this the bottom, or will the downtrend continue? We break down the key levels (support 3,920 USD, breakout trigger 4,500 USD), three trading scenarios with entry levels, and what J.P. Morgan, Goldman Sachs and Deutsche Bank are forecasting for gold in 2026.
Forecasts presented in this section only reflect the author’s private opinion and should not be considered as guidance for trading. RoboForex bears no responsibility for trading results based on trading recommendations described in these analytical reviews.