Solana under pressure amid rising short positions
SOLUSD is undergoing a correction today following a series of declines, while remaining under market pressure and against a mixed fundamental backdrop. The price currently stands at 68.41. Find out more in our analysis for 25 June 2026.
SOLUSD forecast: key takeaways
- Bitcoin’s decline triggered a general flight from risk assets and intensified the sell-off in SOL
- A major market participant increased a short position in Solana twentyfold
- Institutional interest in Solana remains strong, driven by the development of ETF products
- SOLUSD forecast for 25 June 2026: 60.80
Fundamental analysis
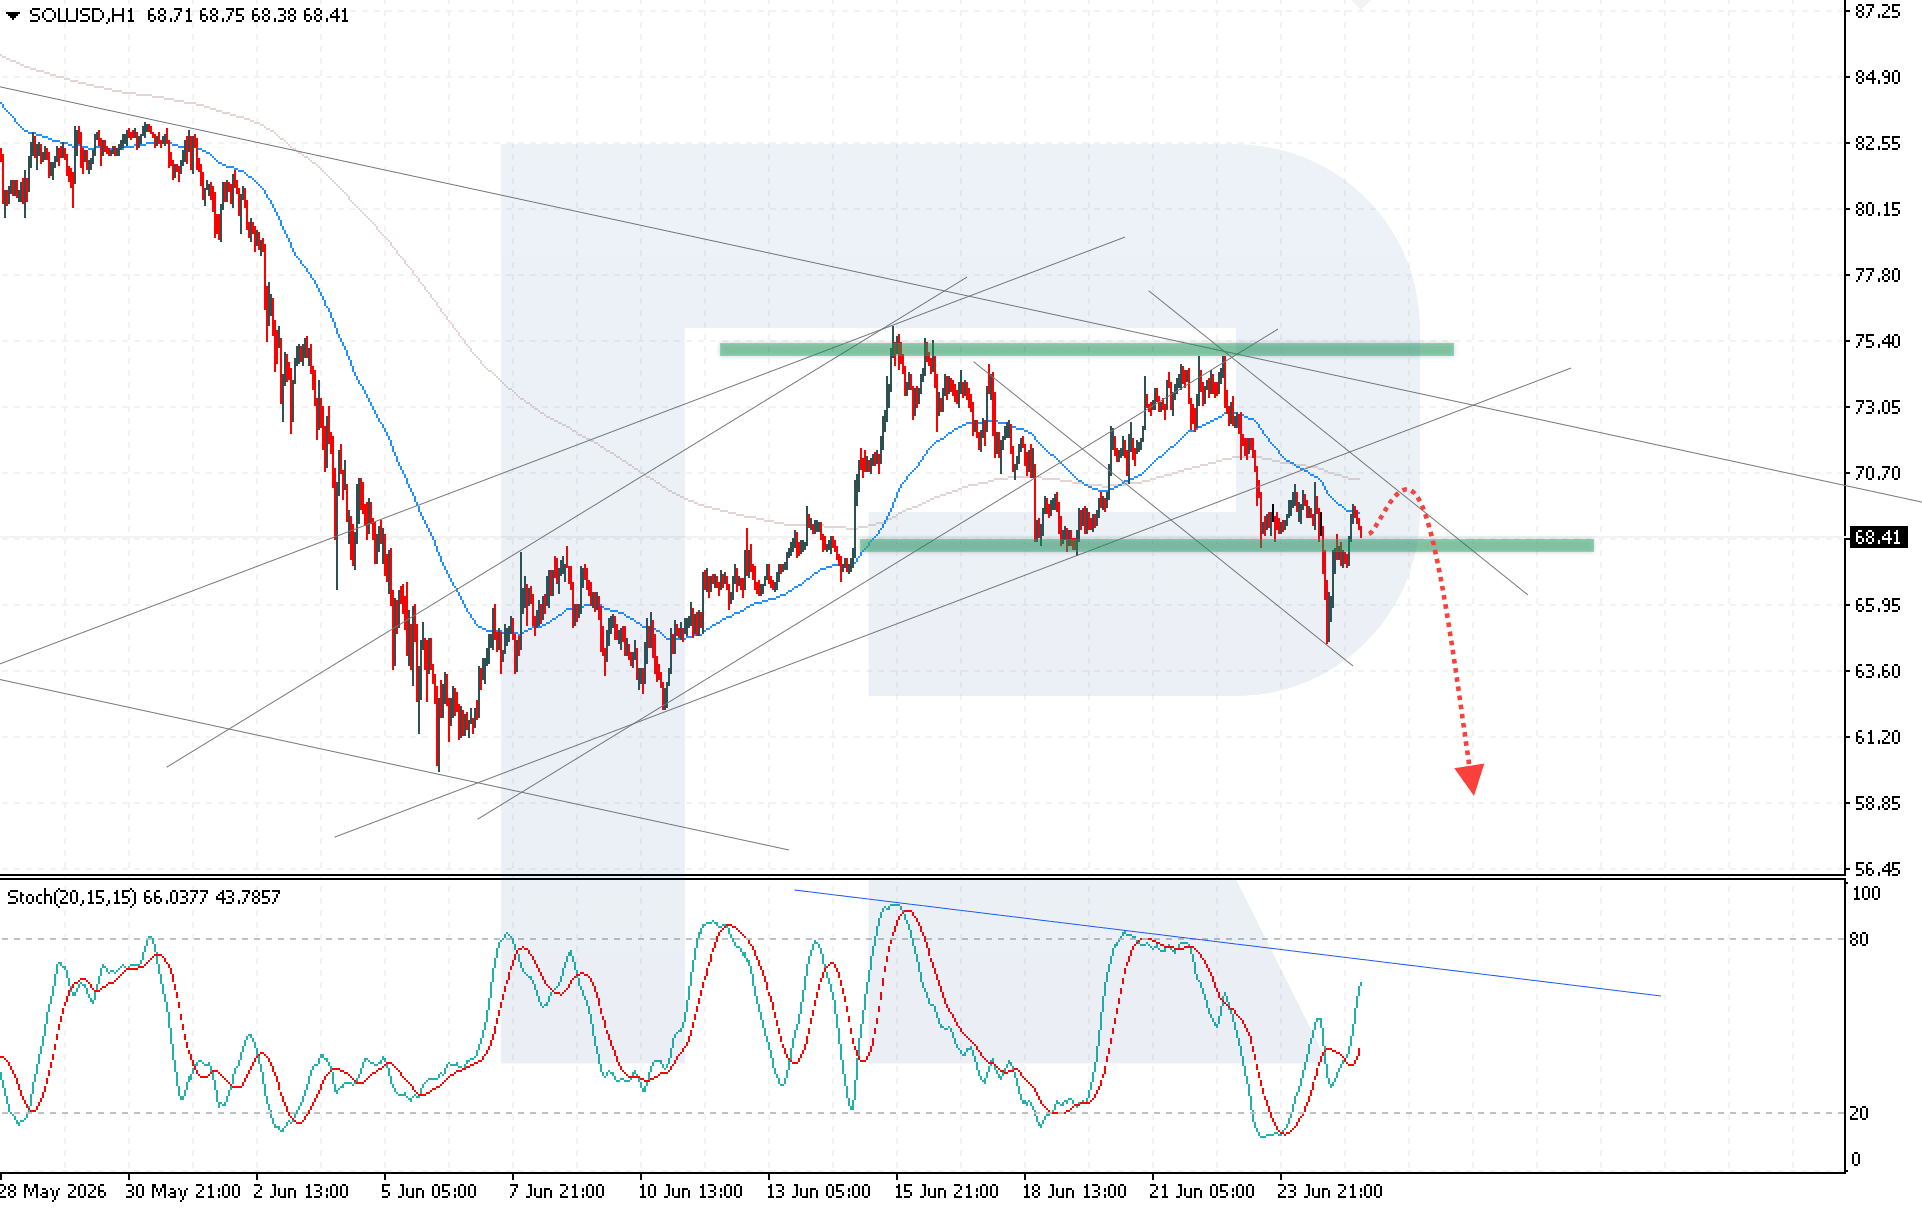
The Solana price is correcting after a decline that lasted for three consecutive trading sessions. Despite the local pullback on the daily chart, SOL still retains the potential to form a Double Top reversal pattern. If this scenario materialises, the downside target could shift to 60.80.
Bitcoin’s fall below the psychological level of 60,000 added to pressure on quotes. Stronger global investor withdrawal from risk assets triggered a chain reaction in the market, putting short-term pressure on SOL.
The situation was intensified by a major market participant, who increased a short position in Solana twentyfold, according to Onchain Lens monitoring data. This increased speculative pressure.
At the same time, the fundamental backdrop remains supportive in the long term. Large institutional players continue to develop the infrastructure for spot Solana ETFs. Morgan Stanley updated its application to launch a spot Solana fund, proposing low fees and an integrated native staking mechanism, which enhances the instrument’s appeal to traditional capital.
Additional positive support comes from South Korea: Toss Bank launched a pilot project to integrate the Solana network for fast and cheap cross-border transfers and settlements, increasing the practical value of the ecosystem.
Technical outlook
The price of Solana is rebounding from the EMA-65, indicating continued selling pressure. At the same time, the market still retains the potential to form a Double Top reversal pattern, which supports the scenario of a possible decline. Today’s forecast for Solana suggests an attempt to resume downward momentum with a target of 58.85 USD.
The Stochastic Oscillator is recovering after moving out of oversold territory, but at the same time, it is approaching the resistance line, which may limit further growth and increase the probability of a downward reversal. If quotes return below the lower boundary of the Double Top pattern and consolidate below 67.05, this would be an additional signal of decline. In this case, the downside scenario will receive confirmation.
An alternative scenario suggests stronger buying pressure. A breakout above the upper boundary of the descending channel and consolidation above 73.45 would cancel the bearish scenario and open the potential for growth to the 80.55 target.
SOLUSD overview
- Asset: SOLUSD
- Timeframe: H1 (Intraday)
- Trend: downward
- Key resistance levels: 70.70 and 75.45
- Key support levels: 68.05 and 64.05
Solana trading scenarios for today
Main scenario (Sell Stop)
A breakout below the lower boundary of the Double Top reversal pattern, with the price consolidating below 67.05, would indicate stronger selling pressure and create conditions for opening short positions.
- Take Profit: 58.85
- Stop Loss: 70.65
Alternative scenario (Buy Stop)
A breakout above the upper boundary of the descending channel with consolidation above 73.45 would indicate accelerating growth and a bullish correction.
- Take Profit: 82.55
- Stop Loss: 71.75
Risk factors
Solana’s downside scenario may fail to materialise if buying demand strengthens and the price returns above the 73.45 resistance level. An additional risk to the bearish scenario is a recovery in the crypto market following Bitcoin and easing pressure from short positions.
Summary
In the short term, Solana remains under pressure, but the medium-term fundamental backdrop is supported by institutional interest and the expansion of the network’s real-world use. Today’s SOLUSD forecast indicates continued selling pressure and a downside scenario, with the risk of a decline to 58.85 USD if the Double Top pattern is confirmed.
Editors’ picks
 EURUSD forecast 2026–2027: technical analysis, price levels & predictions
The ECB holds rates at 2.15% while the Fed stays at 3.75% — and that divergence is the central driver of EURUSD in 2026. The pair is range-bound between 1.1400 and 1.1915, with Deutsche Bank targeting 1.2500 and Morgan Stanley calling for 1.3000 by year-end. We analyse the technicals, break down the macro factors, and outline three trading scenarios with specific entry levels.
 Gold (XAUUSD) forecast 2026: predictions based on fundamental and technical analysis
Where is gold headed after pulling back from the all-time high of 5,597 USD? XAUUSD is consolidating near 4,518 USD between key levels 4,220 USD and 4,855 USD, with major banks targeting 5,243–6,200 USD by year-end. Read our comprehensive gold forecast: technical analysis across three timeframes, trading scenarios with specific entry levels, Fed policy and central bank demand outlook, and institutional predictions for 2026 and beyond.
Forecasts presented in this section only reflect the author’s private opinion and should not be considered as guidance for trading. RoboForex bears no responsibility for trading results based on trading recommendations described in these analytical reviews.