
SOLUSD awaits the Clarity Act decision
SOLUSD is forming a corrective wave today as markets await a decision on the Clarity Act in the US Senate. The SOLUSD price currently stands at 77.00. Discover more in our analysis for 23 July 2026.
SOLUSD forecast: key takeaways
- One of the key events this week was the launch of the S&P Pantera Digital Asset Index, a new cryptocurrency index
- Discussion of the Clarity Act in the US Senate remains a priority
- SOLUSD forecast for 23 July 2026: 82.25 or 74.25
Fundamental analysis
Today’s Solana price forecast takes into account that the price is forming a correction after rising and is trading around 77.00.
One of the key events this week was the launch of the S&P Pantera Digital Asset Index, a new cryptocurrency index that selects assets based not on market capitalisation but on fundamental network metrics, such as protocol revenue and economic activity. Solana was included among the index’s largest components alongside Ethereum and BNB, strengthening its position in the eyes of institutional investors.
The SOLUSD forecast for 23 July 2026 takes into account that the network remains a leader in the tokenised securities segment. In recent days, a new record was set for the use of tokenised shares in lending protocols, while the number of international platforms offering trading in Solana-based assets also increased. This strengthens fundamental demand for the ecosystem through the growing real-world use of the blockchain.
Discussion of the Clarity Act in the US Senate remains a priority. If the initiative advances, market participants expect greater legal certainty for digital assets, which could improve the investment climate for major blockchain projects, including Solana.
Solana is receiving support from growing institutional investor interest, the expanding use of tokenised assets, and the development of payment infrastructure. At the same time, decisions by US regulators remain the key external driver for the entire cryptocurrency market and may determine the further inflow of institutional capital.
Technical outlook
On the SOLUSD H4 chart, the price formed a Shooting Star reversal pattern near the upper Bollinger Band. At this stage, quotes may continue their corrective wave as the signal plays out, with the pullback target at the 74.25 support level. A rebound from this level would open the door for continued upward momentum.
At the same time, today’s SOLUSD technical analysis also suggests an alternative scenario. Quotes could form an upward wave and test the 82.25 resistance level. Following a breakout, the uptrend could continue.
SOLUSD overview
- Asset: SOLUSD
- Timeframe: H4 (Intraday)
- Trend: bullish
- Key resistance levels: 82.25 and 83.30
- Key support levels: 74.25 and 65.90
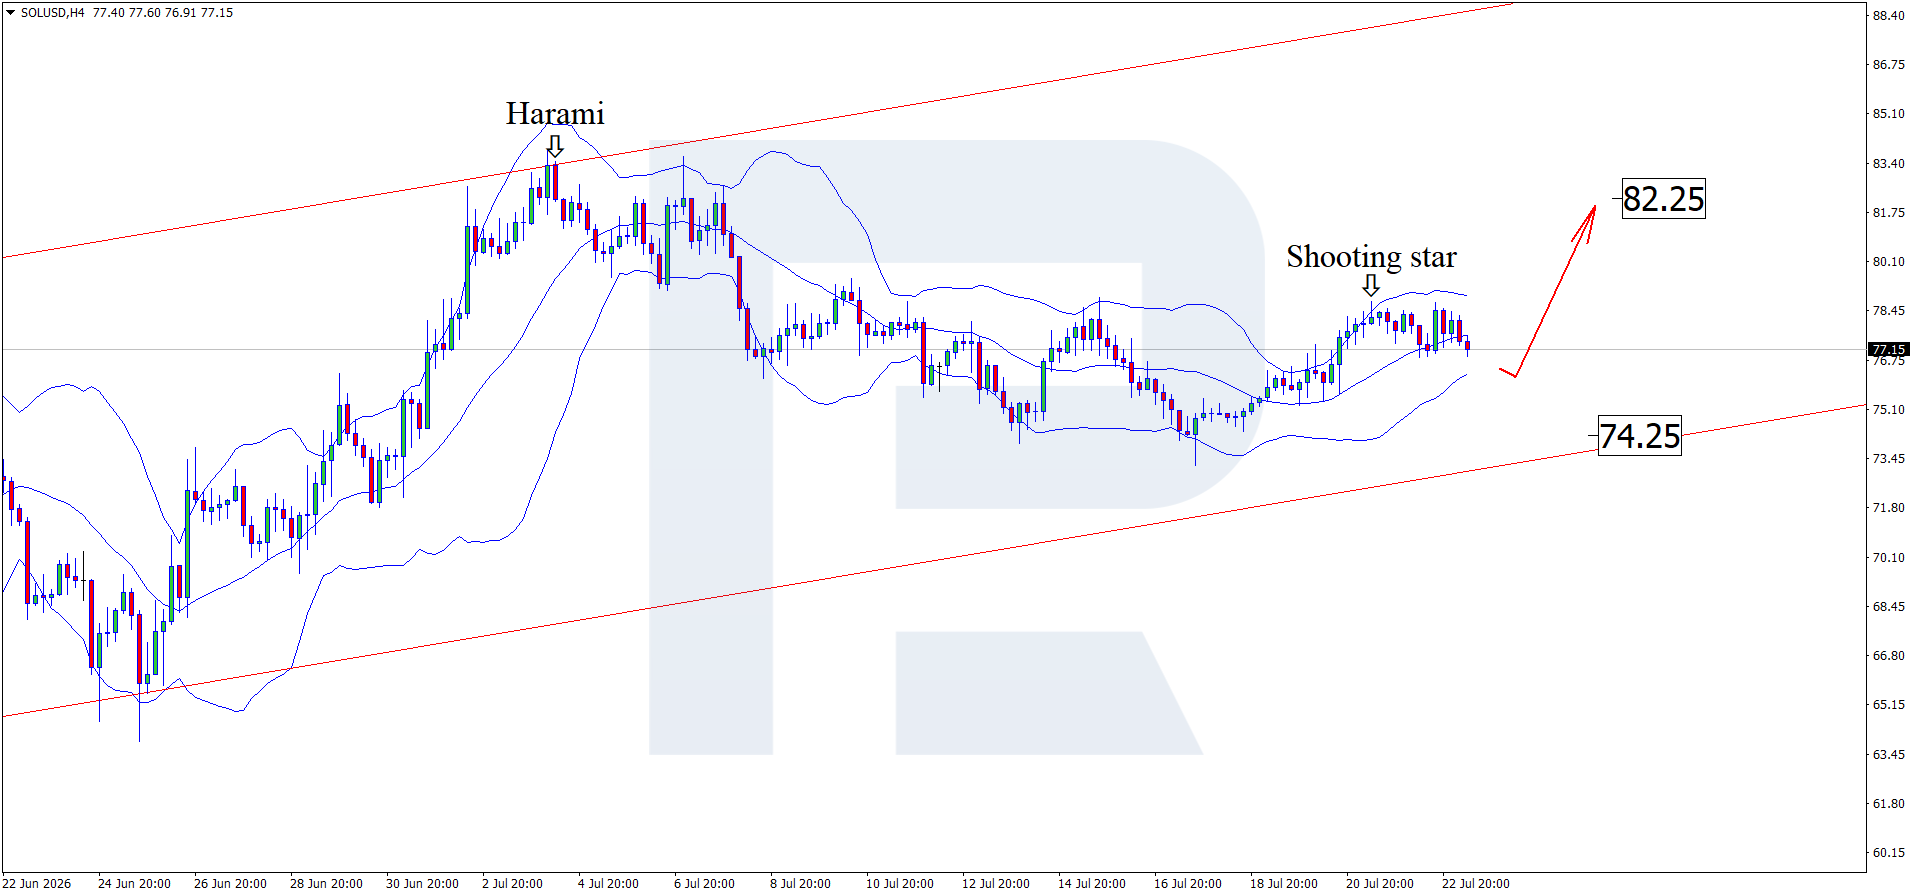
Solana trading scenarios for today
Main scenario (Buy Stop)
A consolidation above the 82.25 resistance level would confirm increased buying pressure and open the way towards the next resistance level at 83.30.
- Take Profit: 83.30
- Stop Loss: 82.00
Alternative scenario (Sell Stop)
A breakout below the 74.25 support level would indicate a continued correction and create conditions for opening short positions.
- Take Profit: 65.90
- Stop Loss: 74.50
Risk factors
The main risk to the bullish SOLUSD scenario may be a decline in user activity and liquidity within the Solana ecosystem. An increase in DEX trading volumes, stablecoin transfers, and demand for DeFi applications could bring buyers back into the market and lead to a price consolidation above 83.30.
Summary
The inclusion of SOL in the new S&P Pantera Digital Asset Index alongside Ethereum and BNB, as well as record growth in the tokenised securities segment on the network, confirms increasing institutional interest and real-world blockchain use. At the same time, today’s SOLUSD technical analysis suggests a price correction towards 74.25 before growth resumes.
Editors’ picks
 EURUSD forecast 2026–2027: technical analysis, price levels & predictions
EURUSD has pulled back from the 2026 high of 1.1915 and is now trading near 1.1450 — below both EMA65 and EMA200 — with the active scenario shifting from bullish to bearish. The ECB raised rates to 2.40%, but the Fed holds at 3.75%, and US inflation (3.5%) continues to outpace the eurozone (2.8%). A confirmed break below 1.1280 opens the next downward wave toward 1.1080. We break down the key levels, three trading scenarios with entry triggers, and what Deutsche Bank, Morgan Stanley and UBS are forecasting for EURUSD in 2026.
 Gold (XAUUSD) forecast 2026: predictions based on fundamental and technical analysis
Gold has corrected over 25% from its all-time high of 5,597 USD and is now trading near 4,100 USD — testing a critical support zone. Is this the bottom, or will the downtrend continue? We break down the key levels (support 3,920 USD, breakout trigger 4,500 USD), three trading scenarios with entry levels, and what J.P. Morgan, Goldman Sachs and Deutsche Bank are forecasting for gold in 2026.
Forecasts presented in this section only reflect the author’s private opinion and should not be considered as guidance for trading. RoboForex bears no responsibility for trading results based on trading recommendations described in these analytical reviews.