
XRP retains chances of reaching new local highs
XRPUSD is undergoing a correction following a rise, but the price holding above key levels supports expectations of further growth. The price currently stands at 1.1076. For more details, see our analysis for 15 July 2026.
XRPUSD forecast: key takeaways
- XRPUSD entered a moderate correction phase after a strong upward momentum
- Spot XRP ETFs in the US saw no net capital inflows for the first time in eight weeks
- The main reason for the pause in investment inflows was stronger resistance near 1.15
- XRPUSD forecast for 15 July 2026: 1.2030
Fundamental analysis
The XRPUSD rate moved into a moderate correction after the strong upward momentum formed a day earlier. Buyers tested the key resistance level near 1.1145 USD, where they encountered profit-taking, which triggered a local decline in prices.
The fundamental backdrop remains mixed. For the week ending 13 July, spot XRP ETFs in the US did not record net capital inflows, breaking an eight-week series of steady investment, during which the funds attracted about 1.48 billion USD. One of the reasons was stronger resistance near the 1.15 mark, with some retail and institutional investors preferring to adopt a wait-and-see approach. Santiment data further signalled cooling market activity, indicating a slowdown in the pace of new wallet creation on the XRP Ledger network and a decline in the number of large transactions above 1 million USD.
At the same time, the long-term outlook for XRP remains favourable. The integration of the company’s technologies with SWIFT’s international payment infrastructure is continuing. According to analysts, up to 30 of the world’s 50 largest banks that are transitioning to the updated SWIFT settlement system in 2026 are already using or testing solutions in which XRP is applied as an intermediary settlement asset. In addition, the market considers the possible adoption of the Clarity Act in the US one of the key drivers of further XRP growth, as it could finally define the legal status of digital assets and create more favourable conditions for their institutional adoption.
Technical outlook
The XRPUSD price is correcting after testing the resistance level, but remains above the upper boundary of the previously broken descending channel. This trend indicates that buyers remain in control and increases the likelihood of a new upward momentum. Today’s XRPUSD forecast suggests growth towards 1.2030.
The technical picture remains favourable for the bullish scenario. The Stochastic Oscillator turned upwards after rebounding from the support line, signalling weakening bearish momentum and a recovery in buying activity. Further confirmation of continued growth would be a successful retest of the upper boundary of the descending channel as support, followed by price consolidation above 1.1175, which would indicate the completion of the corrective phase and a renewed uptrend.
An alternative scenario suggests increased selling pressure. If quotes fall below the local support level at 1.0445 and consolidate below this mark, this will signal the end of the bullish momentum and increase the likelihood of a deeper downward correction.
XRPUSD overview
- Asset: XRPUSD
- Timeframe: H4 (Intraday)
- Trend: downward
- Key resistance levels: 1.1150 and 1.1605
- Key support levels: 1.0485 and 1.0005
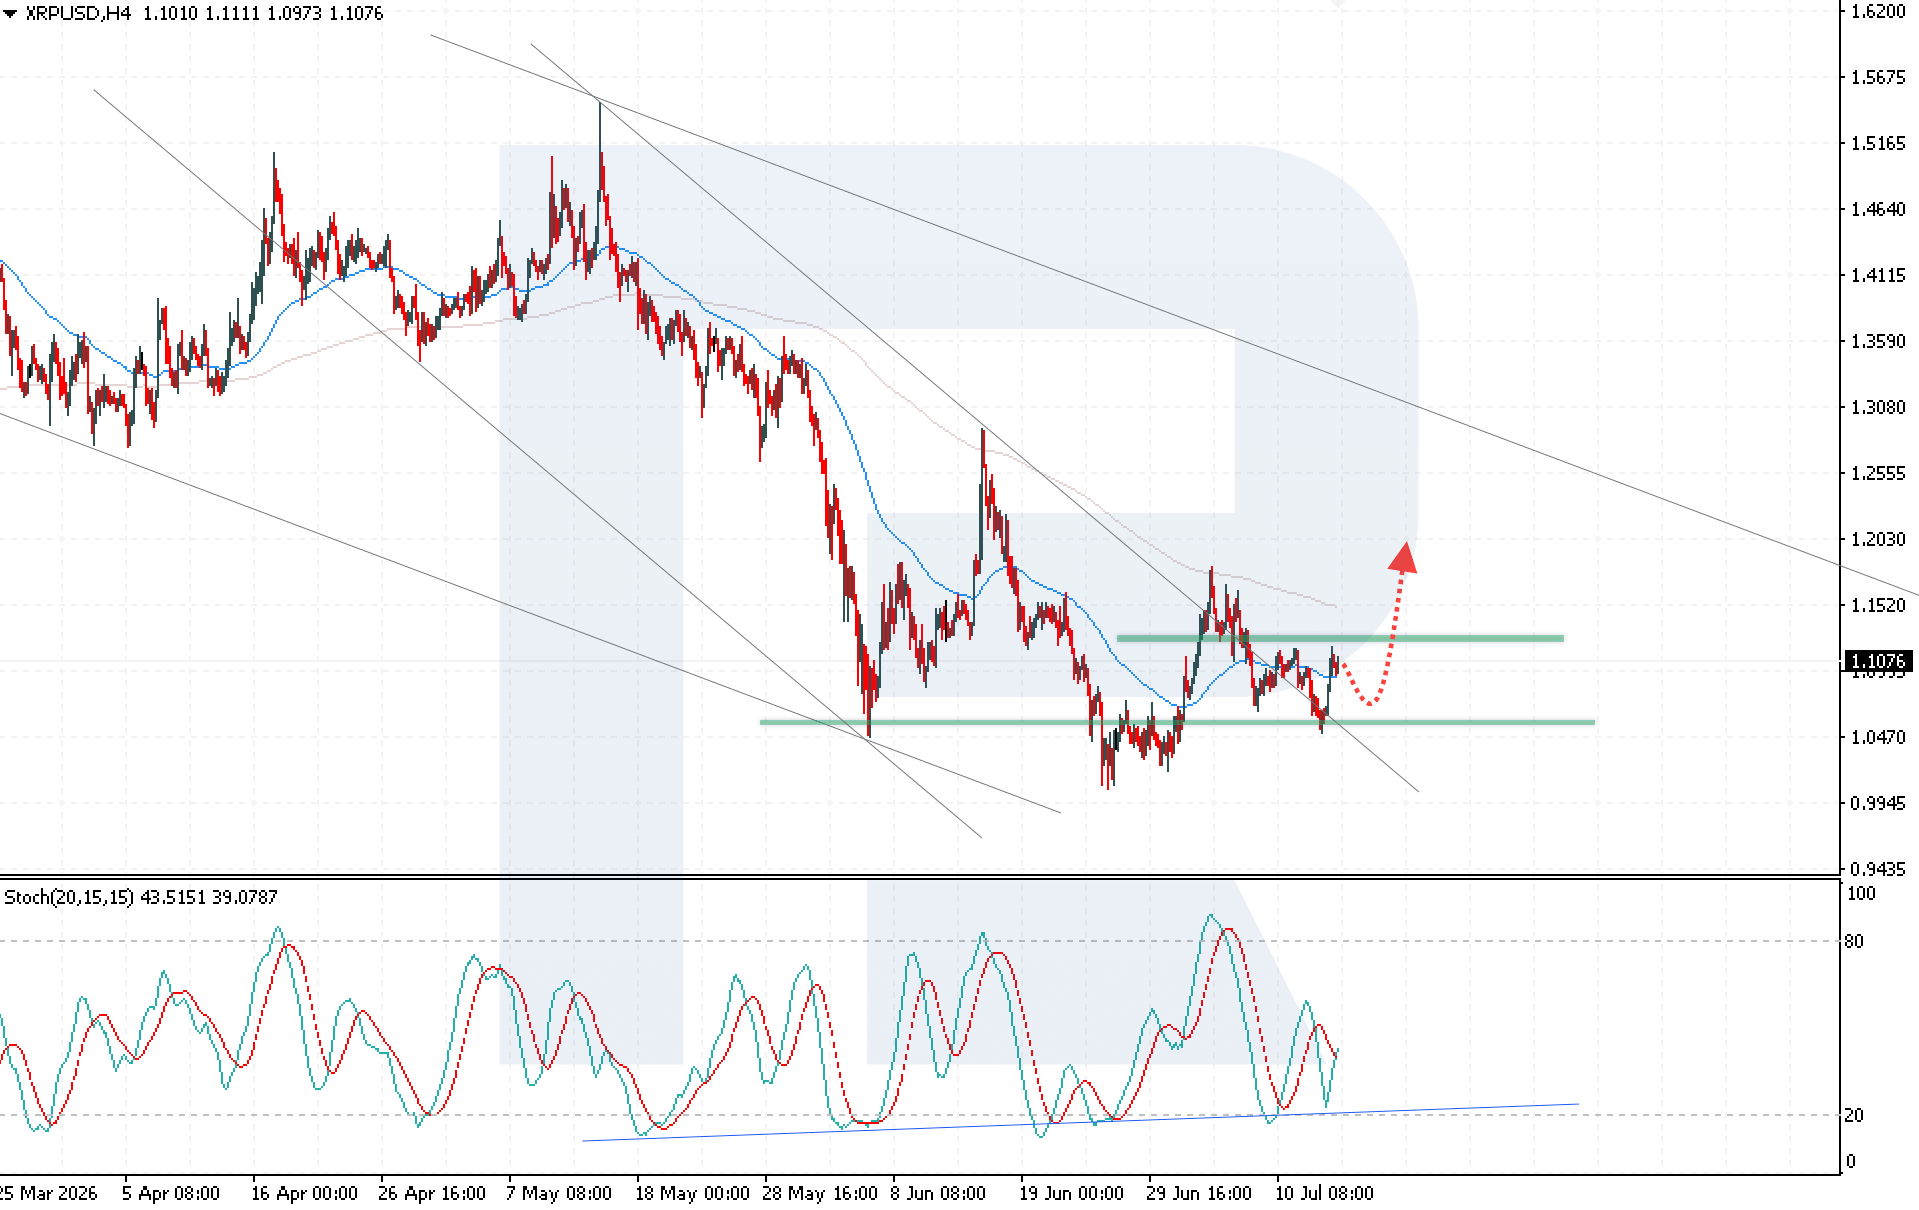
XRP trading scenarios for today
Main scenario (Buy Stop)
A breakout of the local resistance level, with the price consolidating above 1.1105, would add to buying pressure and indicate continued bullish momentum.
- Take Profit: 1.2030
- Stop Loss: 1.1045
Alternative scenario (Sell Stop)
Consolidation below the 1.0445 support level would signal a continued decline and a resumption of the downtrend in XRPUSD.
- Take Profit: 1.0505
- Stop Loss: 0.9925
Risk factors
The main risk to the XRP upside scenario remains increased selling pressure if buyers fail to consolidate above the resistance level at 1.1175. A breakout below the 1.0445 support level will signal waning bullish momentum and increase the probability of a deeper correction.
Summary
Despite the short-term correction, the technical picture and long-term fundamental factors still indicate continued upside potential for XRP. Holding above key support levels and consolidating above the 1.1175 resistance level will be decisive for the development of upward momentum, opening the way to a test of the 1.2030 level.
Editors’ picks
 EURUSD forecast 2026–2027: technical analysis, price levels & predictions
EURUSD has pulled back from the 2026 high of 1.1915 and is now trading near 1.1450 — below both EMA65 and EMA200 — with the active scenario shifting from bullish to bearish. The ECB raised rates to 2.40%, but the Fed holds at 3.75%, and US inflation (3.5%) continues to outpace the eurozone (2.8%). A confirmed break below 1.1280 opens the next downward wave toward 1.1080. We break down the key levels, three trading scenarios with entry triggers, and what Deutsche Bank, Morgan Stanley and UBS are forecasting for EURUSD in 2026.
 Gold (XAUUSD) forecast 2026: predictions based on fundamental and technical analysis
Gold has corrected over 25% from its all-time high of 5,597 USD and is now trading near 4,100 USD — testing a critical support zone. Is this the bottom, or will the downtrend continue? We break down the key levels (support 3,920 USD, breakout trigger 4,500 USD), three trading scenarios with entry levels, and what J.P. Morgan, Goldman Sachs and Deutsche Bank are forecasting for gold in 2026.
Forecasts presented in this section only reflect the author’s private opinion and should not be considered as guidance for trading. RoboForex bears no responsibility for trading results based on trading recommendations described in these analytical reviews.