EURUSD in a Triangle: the market gears up for a sharp move
The EURUSD pair remains under pressure amid rising inflation risks, which supports demand for the US dollar. The rate currently stands at 1.1607. Find more details in our analysis for 6 March 2026.
EURUSD forecast: key takeaways
- Rising tensions in the Middle East increase instability in global financial markets
- Higher oil prices fuel concerns about a new wave of global inflation
- Markets have revised expectations for the timing of the Federal Reserve policy easing
- EURUSD forecast for 6 March 2026: 1.1465
Fundamental analysis
The EURUSD rate is falling for the second consecutive session, but prices remain within a range with an upper boundary at 1.1645 and a lower boundary at 1.1575. The US dollar is supported by escalating tensions in the Middle East, which increases instability in global financial markets. Higher oil prices fuel concerns about a new wave of global inflation. This raises the likelihood that the Federal Reserve will keep interest rates at elevated levels for longer.
Rising inflation risks are weighing on the currencies of major oil-importing countries, which additionally supports the US dollar. Markets have revised expectations for the timing of the Federal Reserve easing. Investors now expect the next rate cut in September or October, whereas previously it was anticipated as early as July.
Traders note that the sustained high intensity of the conflict in the Middle East could create persistent upward pressure on global energy prices, which may amplify global inflation risks. Under such conditions, the Federal Reserve will likely be forced to keep monetary conditions restrictive for longer, supporting demand for the US dollar and significantly reducing the probability of a near-term shift by the Fed into a rate-cutting cycle. Against this backdrop, today’s EURUSD outlook remains bearish.
Technical outlook
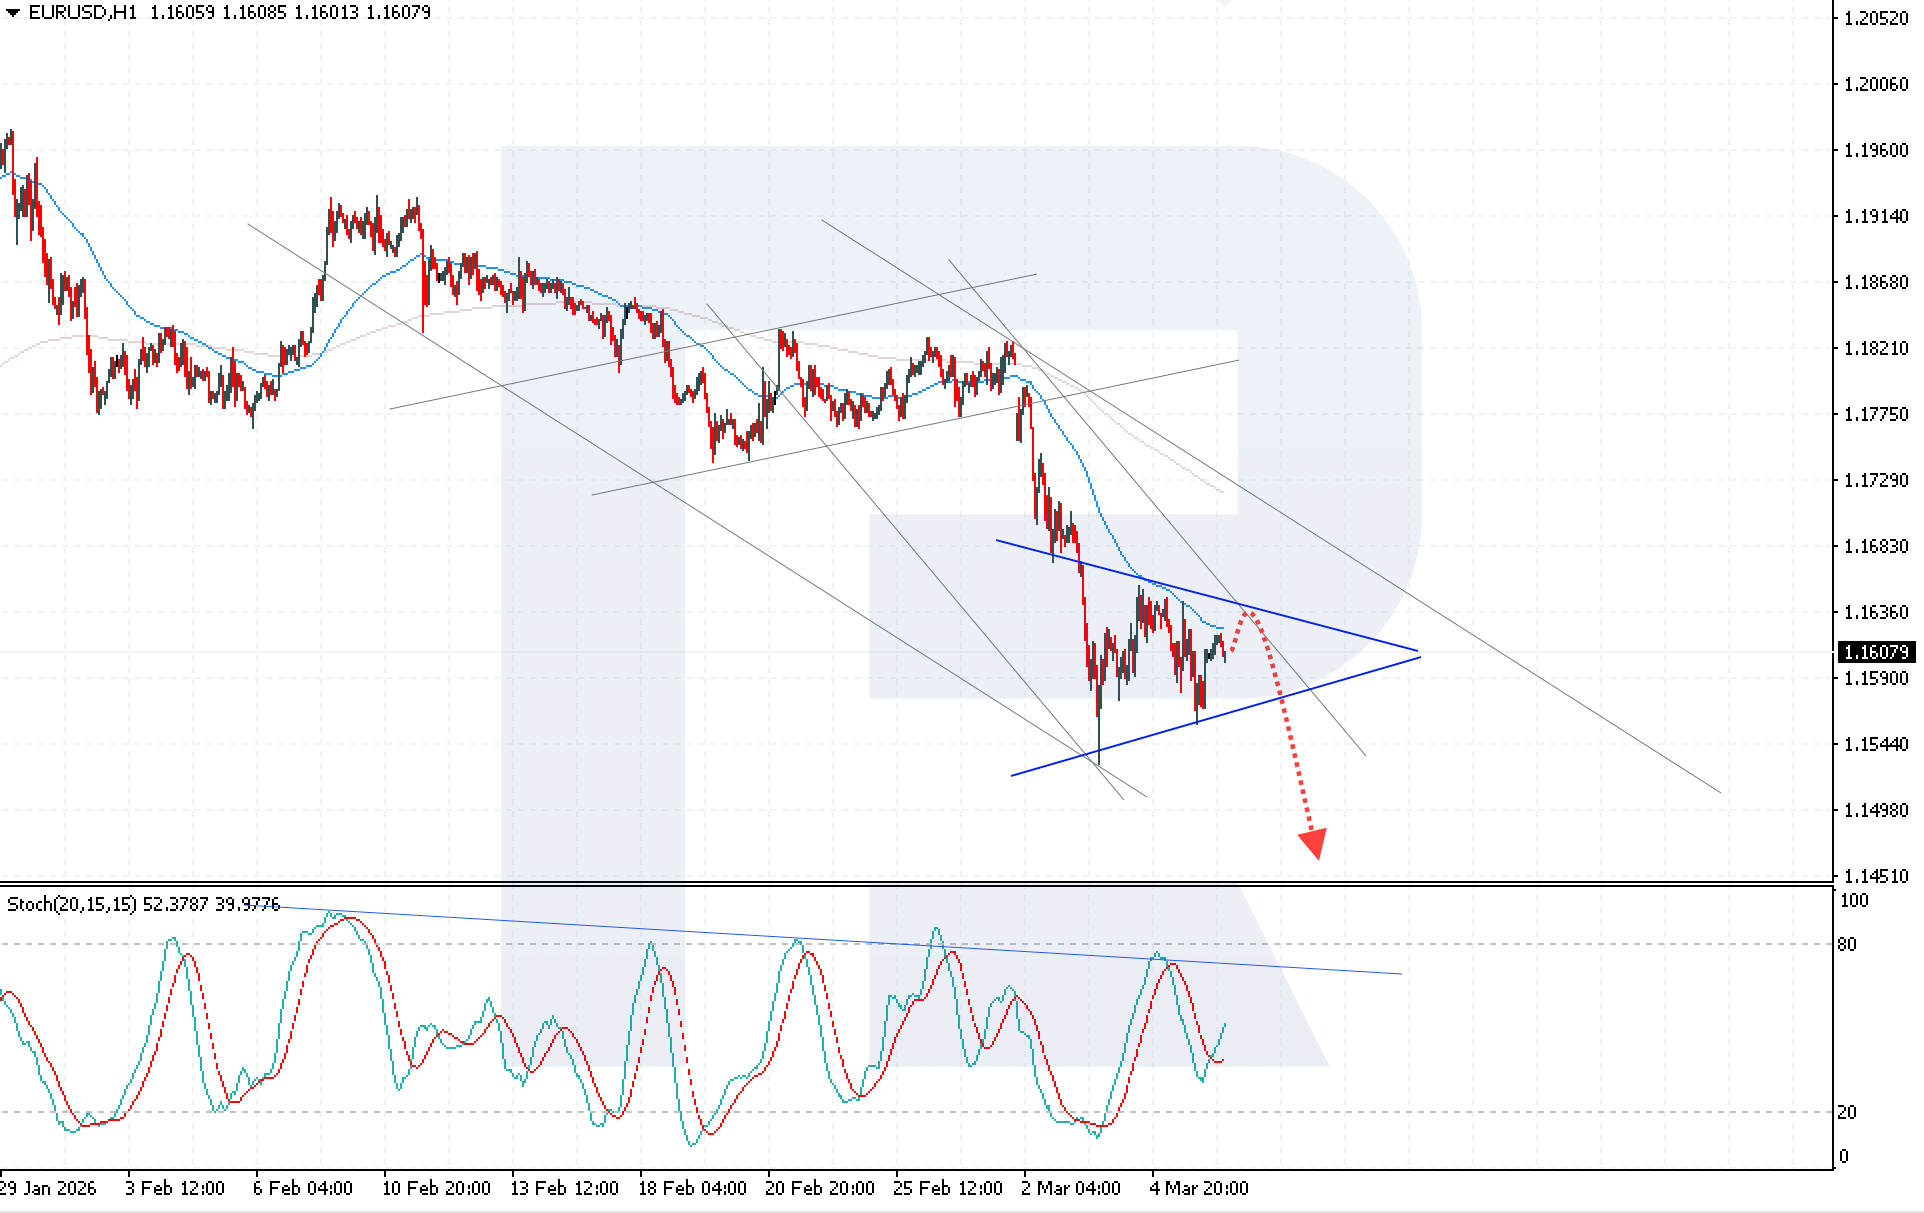
The EURUSD pair remains trapped within a Triangle pattern, while selling pressure persists. Today’s EURUSD forecast suggests a downward move targeting the 1.1465 area.
The Stochastic Oscillator indicates strengthening bearish pressure despite ongoing market uncertainty. Previously, the oscillator values bounced off a descending resistance line, and now the indicator is moving towards this line again, which may signal a renewed decline. A confident breakout below the Triangle’s lower boundary, with the price consolidating below 1.1545, would confirm the main scenario. Such a signal would increase the probability of the pattern playing out with a deeper drop.
An alternative scenario suggests a breakout above the Triangle’s upper boundary and a rise above 1.1665. This scenario would indicate weakening bearish pressure and raise the likelihood of a deeper bullish correction.
EURUSD overview
- Asset: EURUSD
- Timeframe: H1 (Intraday)
- Trend: bearish
- Key resistance levels: 1.1655 and 1.1730
- Key support levels: 1.1545 and 1.1465
EURUSD trading scenarios for today
Main scenario (Sell Stop)
A breakout and consolidation below 1.1565 would signal a breakout of the Triangle’s lower boundary and create conditions for opening short positions. The move potential is about 100 pips with a risk of around 40 pips. The risk-to-reward ratio is above 1:2.
- Take Profit: 1.1465
- Stop Loss: 1.1605
Alternative scenario (Buy Stop)
Consolidation above 1.1665 would indicate a breakout above the Triangle’s upper boundary and continued EURUSD growth as part of a bullish correction.
- Take Profit: 1.1745
- Stop Loss: 1.1605
Risk factors
A risk to the downside EURUSD scenario would be easing geopolitical tensions and stabilising oil prices, which could reduce inflation fears and weaken support for the US dollar. From a technical standpoint, a rise above 1.1675 and a breakout of the Triangle’s upper boundary could invalidate the bearish scenario and trigger a deeper corrective move higher.
Summary
Ongoing tensions in the Middle East and rising inflation risks are supporting the US dollar and fuelling expectations that the Federal Reserve will keep interest rates high for longer, which continues to weigh on the euro. EURUSD technical analysis indicates a Triangle pattern is forming, with the risk of a downside breakout and a decline to 1.1465.
Editors’ picks
 EURUSD 2026-2027 forecast: key market trends and future predictions
This article provides the EURUSD forecast for 2026 and 2027 and highlights the main factors determining the direction of the pair’s movements. We will apply technical analysis, take into account the opinions of leading experts, large banks, and financial institutions, and study AI-based forecasts. This comprehensive insight into EURUSD predictions should help investors and traders make informed decisions.
 Gold (XAUUSD) forecast 2026 and beyond: expert insights, price predictions, and analysis
Dive deep into the Gold (XAUUSD) price outlook for 2026 and beyond, combining technical analysis, expert forecasts, and key macroeconomic factors. It explains the drivers behind gold’s recent surge, explores potential scenarios including a move toward 4,500 to 5,000 USD per ounce, and highlights why the metal remains a strong hedge during global uncertainty.
Forecasts presented in this section only reflect the author’s private opinion and should not be considered as guidance for trading. RoboForex bears no responsibility for trading results based on trading recommendations described in these analytical reviews.