
EURUSD tests the 1.1565 resistance level amid a weaker US dollar
The EURUSD pair is correcting after its recent rise, although buyers remain in control of the market, with the rate currently at 1.1547. For more details, see our analysis for 6 August 2026.
EURUSD forecast: key takeaways
- The US ADP labour market report came in below expectations
- Investors are awaiting the Nonfarm Payrolls report
- The US ISM services PMI fell short of the forecast
- EURUSD forecast for 6 August 2026: 1.1685
Fundamental analysis
The EURUSD rate has entered a correction phase after its recent rise, with buyers yet to decisively break above the local resistance level at 1.1565. Despite the short-term decline, the overall bullish momentum remains intact, and the pair continues to trade within an upward movement.
Additional pressure on the US dollar came from news of a partial resumption of shipping through the Strait of Hormuz. Expectations of easing tensions in the Middle East led to a moderate decline in global oil prices on the morning of 6 August.
Meanwhile, the latest US labour market data came in below expectations. According to the ADP report published on Wednesday, private sector employment in the US increased by only 44 thousand in July, following growth of 98 thousand a month earlier. These figures made investors more cautious ahead of the official Nonfarm Payrolls report due on Friday.
Further signals came from the US services sector. The ISM services PMI rose to 54.1 in July from 54.0 a month earlier, but the result was slightly below analysts’ expectations of 54.5 points. This indicates continued resilience in the US economy but also confirms a gradual slowdown in growth.
Technical outlook
The EURUSD rate is testing the upper boundary of the descending channel, while buyers are keeping prices above the EMA-65, indicating continued bullish momentum in the short term. Today’s EURUSD forecast suggests a renewed upward movement, with a potential target at 1.1685.
An additional signal in favour of continued growth comes from the Stochastic Oscillator. The oscillator values have consolidated above the resistance line, suggesting increased buying pressure and sustained bullish momentum. A breakout above the upper boundary of the descending channel, followed by firm consolidation above the 1.1565 resistance level, would confirm the bullish scenario. In this case, buyers may gain additional momentum to extend the upward move.
However, an alternative scenario remains possible. If sellers regain control of the market and break below the lower boundary of the upward correction, with the price consolidating below the 1.1510 support level, this would signal weakening bullish pressure. In this case, the EURUSD pair may resume its decline towards the nearest target at 1.1425.
EURUSD overview
- Asset: EURUSD
- Timeframe: H4 (intraday)
- Trend: bullish
- Key resistance levels: 1.1565 and 1.1615
- Key support levels: 1.1510 and 1.1425
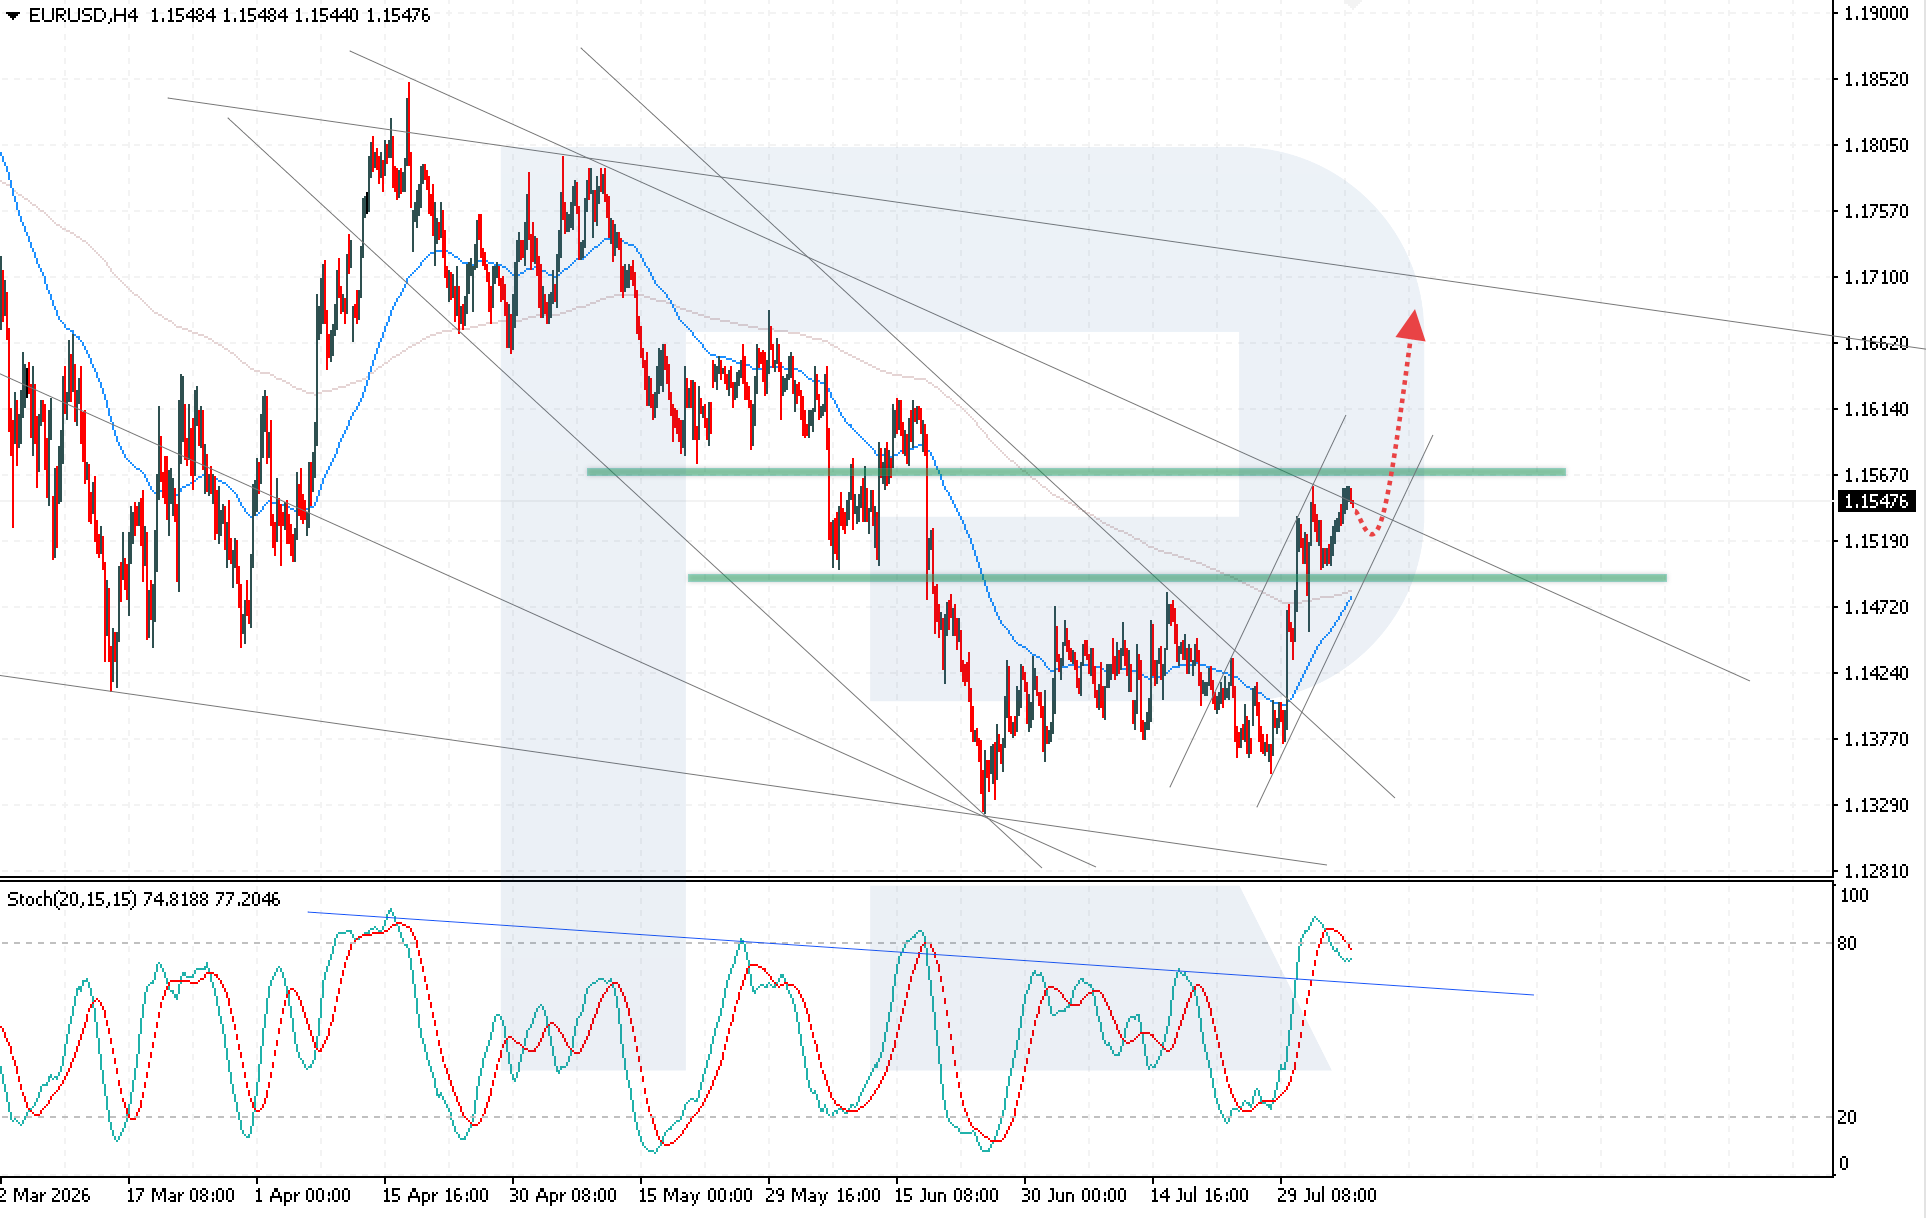
EURUSD trading scenarios for today
Main scenario (Buy Stop)
A breakout above the upper boundary of the descending channel, followed by consolidation above 1.1565, would create conditions for opening long positions and indicate stronger bullish momentum in EURUSD.
- Take Profit: 1.1685
- Stop Loss: 1.1525
Alternative scenario (Sell Stop)
A breakout below the lower boundary of the corrective channel, followed by a decline below 1.1510, would trigger a further bearish correction towards lower targets.
- Take Profit: 1.1425
- Stop Loss: 1.1545
Risk factors
The main risk to further EURUSD growth remains buyers’ failure to break above the 1.1565 resistance level and gain a foothold above the upper boundary of the descending channel. Additional pressure on the pair may increase if strong US labour market data supports the USD and reduces expectations of a more accommodative Federal Reserve policy.
Summary
Today’s EURUSD forecast indicates continued bullish potential as long as buyers keep the price above the EMA-65 and attempt to consolidate above the 1.1565 resistance level. A breakout of this mark could open the way for further growth towards 1.1685.
Editors’ picks
 EURUSD forecast 2026–2027: technical analysis, price levels & predictions
EURUSD has pulled back from the 2026 high of 1.1915 and is now trading near 1.1450 — below both EMA65 and EMA200 — with the active scenario shifting from bullish to bearish. The ECB raised rates to 2.40%, but the Fed holds at 3.75%, and US inflation (3.5%) continues to outpace the eurozone (2.8%). A confirmed break below 1.1280 opens the next downward wave toward 1.1080. We break down the key levels, three trading scenarios with entry triggers, and what Deutsche Bank, Morgan Stanley and UBS are forecasting for EURUSD in 2026.
 Gold (XAUUSD) forecast 2026: predictions based on fundamental and technical analysis
Gold has corrected over 25% from its all-time high of 5,597 USD and is now trading near 4,100 USD — testing a critical support zone. Is this the bottom, or will the downtrend continue? We break down the key levels (support 3,920 USD, breakout trigger 4,500 USD), three trading scenarios with entry levels, and what J.P. Morgan, Goldman Sachs and Deutsche Bank are forecasting for gold in 2026.
Forecasts presented in this section only reflect the author’s private opinion and should not be considered as guidance for trading. RoboForex bears no responsibility for trading results based on trading recommendations described in these analytical reviews.