EURUSD weekly forecast: two weeks of decline behind, the outlook remains moderately negative
The EURUSD pair enters the week of 16–20 March around 1.1505 after the second consecutive week of losses. The US dollar is supported by demand for safe-haven assets amid the conflict in the Middle East and rising oil prices. These factors increased inflation concerns and shifted expectations for the first Federal Reserve rate cut from July to September. US macroeconomic data remains broadly neutral.
Technically, the EURUSD pair is in a correction phase after the January rise to 1.2050–1.2080. The price is now testing the 1.1500 support level, with indicators suggesting continued downward momentum. A breakout below 1.1500 will increase the risk of a decline towards 1.1450–1.1400. Resistance is located in the 1.1580–1.1650 zone.
EURUSD forecast for this week: quick overview
- Market focus: the EURUSD pair ended the week lower around 1.1505, posting its second consecutive week of losses. The dollar is supported by safe-haven demand amid the conflict in the Middle East. Harsh rhetoric from Tehran and Washington suggests there are no signs of de-escalation, with rising oil prices adding to pressure on markets. US macroeconomic data was broadly neutral
- Current trend: after rising in January to 1.2050–1.2080, the pair moved into a downward phase. Since late February, selling pressure has intensified, and quotes have shifted into the 1.1500–1.1600 zone. The EURUSD pair is currently testing the lower boundary of the range near 1.1500. Bollinger Bands are pointing downwards, MACD remains below the zero line, and the Stochastic Oscillator is in oversold territory. All of this indicates continued downside momentum
- Weekly outlook: the baseline scenario suggests movement in the 1.1500–1.1650 range with a moderately bearish bias. A breakout below 1.1500 will increase downside risks towards 1.1450–1.1400, while a return above 1.1650 could weaken the current bearish scenario
EURUSD fundamental analysis
The EURUSD pair ended the week lower near 1.1505, marking the second consecutive week in negative territory, with the US currency bolstered by demand for safe-haven assets amid the conflict in the Middle East. Harsh rhetoric from Tehran and Washington indicates that the confrontation around Iran remains far from de-escalation.
Additional pressure on markets comes from rising oil prices. Iran’s new Supreme Leader Mojtaba Khamenei stated his intention to maintain the de facto closure of the Strait of Hormuz. At the same time, Tehran is ramping up attacks on oil and transport facilities in the region. This increases inflation concerns and leads to a reassessment of expectations for Federal Reserve policy, with the market shifting its forecast for the first rate cut from July to September.
US macroeconomic data was broadly neutral. Initial jobless claims came in at 213 thousand, nearly matching expectations of 214 thousand, while continuing claims were 1.850 million, down from 1.868 million a week earlier. At the same time, housing starts in January rose by 7.2% m/m, significantly exceeding the forecast for a 2.4% decline.
EURUSD technical analysis
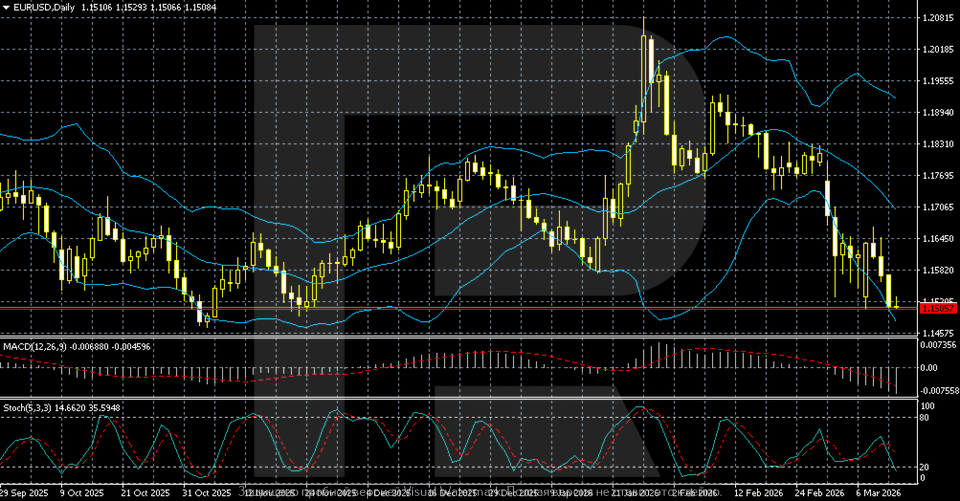
On the daily chart, after rising in January and forming a local peak in the 1.2050–1.2080 area, the EURUSD pair moved into a downward phase. Since late February, selling pressure has intensified, with prices gradually shifting into the 1.1500–1.1600 area, where the key support zone is now located.
Quotes are currently testing the lower boundary of the range. Bollinger Bands are pointing downwards, and the price is holding near their lower boundary, indicating continued downside momentum. The nearest resistance level is located in the 1.1580–1.1650 zone, while key support lies around 1.1500.
Indicators confirm market weakness. The MACD histogram remains below the zero line and continues to decline, while the Stochastic Oscillator is in oversold territory. If the price decisively breaks below the 1.1500 level, the decline may continue towards 1.1450–1.1400. A return above 1.1650 would weaken the current downside scenario.
EURUSD trading scenarios
The EURUSD pair ended the week lower around 1.1505, posting its second consecutive week of losses. The dollar is supported by safe-haven demand amid the conflict in the Middle East. Harsh rhetoric from Tehran and Washington suggests there are no signs of de-escalation. Additional pressure on markets comes from rising oil prices, boosting inflation expectations and shifting the forecast for the first Federal Reserve rate cut from July to September.
Technically, after climbing to 1.2050–1.2080 in January, the pair entered a downward phase and is now trading around 1.1505, testing the key support level at 1.1500. Bollinger Bands are pointing downwards, and MACD remains below the zero line, indicating persistent downside momentum. The nearest resistance is located in the 1.1580–1.1650 zone.
- Buy scenario
Holding above 1.1500 may form the basis for a recovery with a target of 1.1650.
- Sell scenario
A breakout below 1.1500 would increase pressure on the pair and open the way to 1.1450–1.1400.
Conclusion: the baseline scenario is consolidation near 1.1500 with a moderately bearish bias amid a strong dollar.
Summary
The EURUSD pair ended the week lower around 1.1505 after declining for the second consecutive week. The dollar is bolstered by safe-haven demand amid the conflict in the Middle East. Rising oil prices and harsh rhetoric from Tehran and Washington increased inflation concerns and shifted expectations for the first Federal Reserve rate cut from July to September.
Technically, the EURUSD pair is in a bearish correction phase after the January rally to 1.2050–1.2080. The pair is trading around 1.1505 and testing the key 1.1500 support level. Bollinger Bands are pointing downwards, and MACD remains in negative territory. Resistance is located in the 1.1580–1.1650 area. A breakout below 1.1500 will increase downside risks towards 1.1450–1.1400.
Editors’ picks
 EURUSD 2026-2027 forecast: key market trends and future predictions
This article provides the EURUSD forecast for 2026 and 2027 and highlights the main factors determining the direction of the pair’s movements. We will apply technical analysis, take into account the opinions of leading experts, large banks, and financial institutions, and study AI-based forecasts. This comprehensive insight into EURUSD predictions should help investors and traders make informed decisions.
 Gold (XAUUSD) forecast 2026 and beyond: expert insights, price predictions, and analysis
Dive deep into the Gold (XAUUSD) price outlook for 2026 and beyond, combining technical analysis, expert forecasts, and key macroeconomic factors. It explains the drivers behind gold’s recent surge, explores potential scenarios including a move toward 4,500 to 5,000 USD per ounce, and highlights why the metal remains a strong hedge during global uncertainty.
Forecasts presented in this section only reflect the author’s private opinion and should not be considered as guidance for trading. RoboForex bears no responsibility for trading results based on trading recommendations described in these analytical reviews.