EURUSD weekly forecast: geopolitics and inflation leave buyers with no chance
The EURUSD pair enters the week of 30 March–3 April around 1.1540 amid broad global support for the US dollar. The main factor remains geopolitical uncertainty around the Middle East conflict, which, through higher oil prices, increases inflation risks. This shifts expectations for Federal Reserve policy towards tightening and limits the potential for the US dollar weakening.
Technically, the EURUSD pair remains in a downward correction following the January rise to 1.2000. The pair is trading in the 1.1450–1.1650 range below the middle Bollinger Band. Indicators suggest continued selling pressure. A breakout below 1.1500 will increase the risks of a decline towards 1.1450–1.1400, while resistance stands at 1.1650–1.1700.
EURUSD forecast for this week: quick overview
- Market focus: the EURUSD pair closed the week around 1.1540, with the dollar supported by high uncertainty around the Middle East conflict and its impact on oil and inflation. Rising energy prices increase inflation risks and strengthen expectations of a more hawkish Fed. The market is even pricing in the possibility of a rate hike by the end of the year, which supports the dollar
- Current trend: after rising towards the 1.2000 area in January, the pair began to decline. Since late February, a bearish structure with lower highs and lower lows has been forming. In early March, the decline accelerated, reaching a low near 1.1400, after which a corrective rebound began. The price is now fluctuating within the 1.1450–1.1650 range, below the middle Bollinger Band. MACD is in negative territory, while the Stochastic Oscillator indicates local overbought conditions. Selling pressure remains
- Weekly outlook: the baseline scenario is movement in the 1.1500–1.1650 range with a moderately bearish bias. A breakout below 1.1500 would increase the risks of a decline towards 1.1450–1.1400. A consolidation above 1.1650 would ease pressure and open the way for a more stable recovery
EURUSD fundamental analysis
The EURUSD pair ended the week around 1.1540. The US dollar was supported by high uncertainty around the Middle East conflict and its impact on oil, inflation, and global economic growth.
The geopolitical factor remains key. According to media reports, the Pentagon is considering redeploying up to 10,000 troops to the region, expanding leverage in negotiations. Donald Trump also extended the deadline for possible strikes on Iran’s energy infrastructure by 10 days. It is known that Tehran allowed 10 tankers to pass through the Strait of Hormuz.
Supply disruptions due to the conflict continue to support high energy prices, reinforcing inflation risks. This strengthens expectations of a more hawkish Federal Reserve stance. The market is now pricing in a roughly 50% likelihood of a rate hike by December, whereas previously two cuts had been expected this year.
As a result, the US dollar retains steady support, remaining sensitive to geopolitical headlines and movements in the oil market.
EURUSD technical analysis
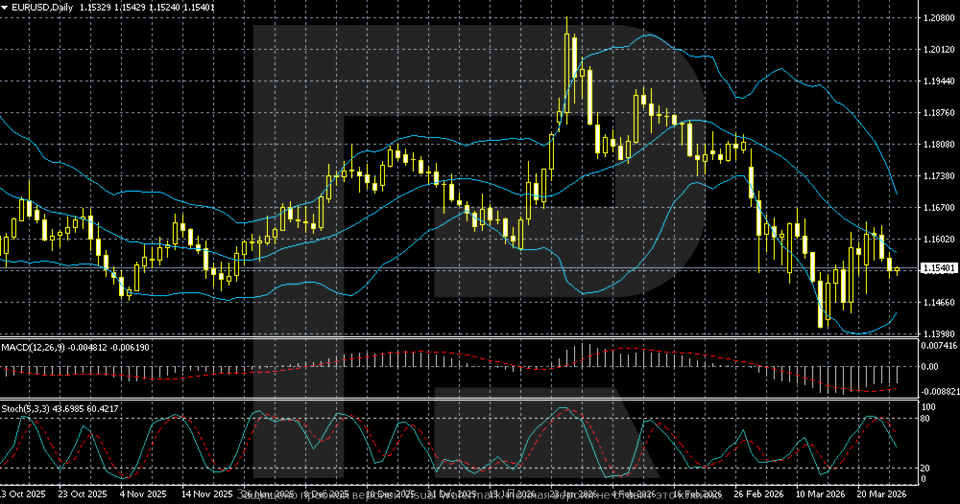
The EURUSD daily chart shows that after rising in January and reaching new highs near 1.2000, the market began to decline. Since late February, a bearish structure has been forming, with the price consistently making lower highs and lower lows, indicating stronger selling pressure.
The downside momentum accelerated in early March – quotes broke below the middle Bollinger Band and consolidated in the lower part of the range. A low was formed around the 1.14 area, from which a rebound began. The current move appears to be a corrective recovery after the decline.
The price is now hovering in the approximate 1.1450–1.1650 range, remaining below the middle Bollinger Band. Indicators confirm weakness: MACD is in negative territory, while the Stochastic Oscillator indicates local overbought conditions. Overall, the bearish scenario remains the priority until the pair consolidates above 1.1650–1.1700.
EURUSD trading scenarios
The EURUSD pair ended the week around 1.1540. The dollar was supported by high uncertainty around the Middle East conflict and its impact on oil and inflation. Rising energy prices increase inflation risks and shift expectations for Fed policy towards a more hawkish stance. The market is already pricing in the possibility of a rate hike by the end of the year, which supports the dollar.
Technically, after climbing towards the 1.2000 area in January, the pair entered a downward phase. Since late February, a bearish structure with lower highs and lower lows has been forming. In early March, the decline accelerated, hitting a low near 1.1400, after which a corrective rebound began. The price is now fluctuating within the 1.1450–1.1650 range, remaining below the middle Bollinger Band. MACD is in negative territory, while the Stochastic Oscillator suggests short-term overbought conditions. The resistance level lies at 1.1650–1.1700.
- Buy scenario
Holding above 1.1500 may support a corrective rise, with a target at 1.1650–1.1700.
- Sell scenario
A breakout below 1.1500 would increase pressure and open the way towards 1.1450–1.1400.
Conclusion: the baseline scenario is consolidation within the 1.1500–1.1650 range with a moderately bearish bias.
Summary
The EURUSD pair ended the week around 1.1540. The dollar is supported by high uncertainty around the Middle East conflict and rising oil prices, which increase inflation risks. The market is already pricing in the likelihood of Fed tightening by the end of the year, limiting the potential for dollar weakening.
Technically, the EURUSD pair is in a downward correction after the January rally towards 1.2000. A structure of lower highs and lower lows has been forming since late February. The price is now fluctuating within the 1.1450–1.1650 range below the middle Bollinger Band, while MACD remains in negative territory. Resistance is in the 1.1650–1.1700 area. A breakout below the 1.1500 level will increase the risks of a decline towards 1.1450–1.1400.
Editors’ picks
 EURUSD 2026-2027 forecast: key market trends and future predictions
This article provides the EURUSD forecast for 2026 and 2027 and highlights the main factors determining the direction of the pair’s movements. We will apply technical analysis, take into account the opinions of leading experts, large banks, and financial institutions, and study AI-based forecasts. This comprehensive insight into EURUSD predictions should help investors and traders make informed decisions.
 Gold (XAUUSD) forecast 2026 and beyond: expert insights, price predictions, and analysis
Dive deep into the Gold (XAUUSD) price outlook for 2026 and beyond, combining technical analysis, expert forecasts, and key macroeconomic factors. It explains the drivers behind gold’s recent surge, explores potential scenarios including a move toward 4,500 to 5,000 USD per ounce, and highlights why the metal remains a strong hedge during global uncertainty.
Forecasts presented in this section only reflect the author’s private opinion and should not be considered as guidance for trading. RoboForex bears no responsibility for trading results based on trading recommendations described in these analytical reviews.