EURUSD weekly forecast: the US dollar remains the favourite
The EURUSD pair enters the week of 6–10 April near 1.1530 amid sustained demand for the US dollar. The key factor remains geopolitical tensions, shifting expectations for the Federal Reserve’s policy towards a more hawkish stance and limiting the dollar’s downside potential. Meanwhile, macroeconomic data remains mixed: the labour market is slowing, but consumer sentiment remains resilient.
Technically, the EURUSD pair remains in a downward correction after the rise towards 1.2000. The pair is trading within the 1.1400–1.1600 range near the middle Bollinger Band, with indicators suggesting continued selling pressure. A breakout below 1.1500 will increase downside risks towards 1.1450–1.1400, while resistance stands at 1.1600–1.1700.
EURUSD forecast for this week: quick overview
- Market focus: the EURUSD pair ended the week at 1.1530. The dollar remained sensitive to macroeconomic data and geopolitics. The data was mixed. Additional support for the dollar came from Trump’s rhetoric on Iran. Rising oil prices reinforce inflation risks and support hawkish expectations for the Federal Reserve’s policy
- Current trend: after rising to 1.2000 earlier this year, the pair started to decline. A downward structure with lower highs has formed. In March, the price dropped to 1.1400–1.1500, where support formed, followed by consolidation. The EURUSD pair is now trading in the 1.1400–1.1600 range near the middle Bollinger Band. MACD remains in negative territory; the Stochastic Oscillator is neutral. Selling pressure persists
- Weekly outlook: the baseline scenario is movement within the 1.1500–1.1650 range with a moderately bearish bias. A breakout below 1.1500 will increase the risk of a decline to 1.1450–1.1400. A sustained move above 1.1650 would reduce pressure and open the way for a recovery
EURUSD fundamental analysis
The EURUSD pair ended the first week of April at 1.1530, with the US dollar sensitive to macroeconomic data and geopolitics.
Macroeconomic statistics were mixed. Initial jobless claims fell to 202 thousand, coming in better than expected, while continuing claims rose to 1.841 million, signalling slower hiring. The ADP report showed job growth of 62 thousand, confirming a gradual cooling of the labour market without a sharp deterioration. At the same time, retail sales rose by 0.6% m/m in February, indicating consumer resilience.
Geopolitics provides additional support for the dollar. Donald Trump said the US may intensify military actions against Iran in the coming weeks. This reduced expectations of a quick de-escalation and boosted demand for the dollar as a safe-haven asset. Rising oil prices have again intensified inflation risks, which have virtually ruled out expectations of rate cuts this year.
At the same time, some signs of attempts to control the situation – in particular, Iran and Oman working on monitoring traffic through the Strait of Hormuz – partly restrain tensions.
The balance of factors remains unstable. Macroeconomic data indicates a slowdown, while geopolitics and inflation support a more hawkish scenario for Fed policy.
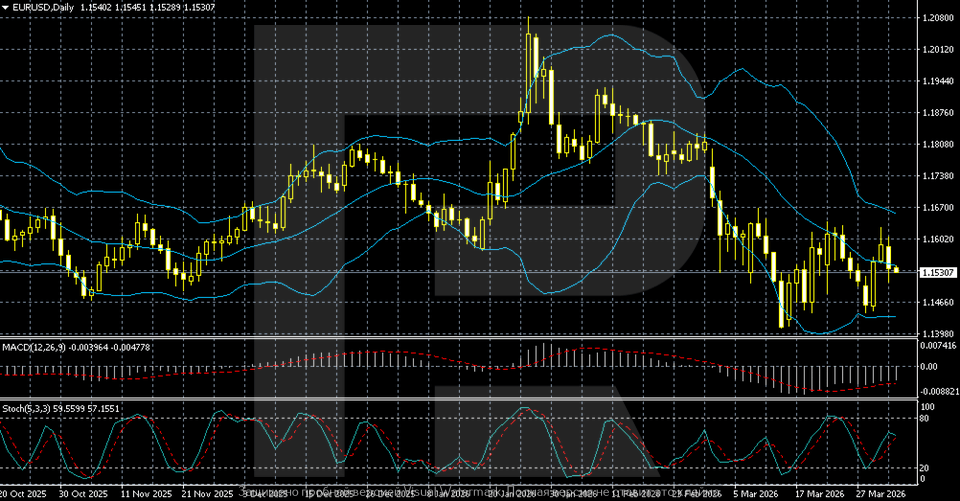
EURUSD technical analysis
On the daily chart, the EURUSD pair shows that after the impulsive rise in late January–early February into the zone above 1.2000, the market failed to gain a foothold at those levels and moved into a downward phase. The subsequent move formed a sequence of lower highs, indicating a medium-term downtrend.
From mid-February, pressure intensified, and the price dropped towards the 1.1400–1.1500 area, where a support zone formed. Bollinger Bands widened during the decline, reflecting higher volatility, and then began to narrow, signalling a transition into consolidation. MACD is in negative territory, confirming prevailing bearish momentum, although the pace of decline is slowing.
At present, the pair is trading sideways near 1.1500, holding around the middle Bollinger Band. The Stochastic Oscillator is hovering in neutral territory, indicating a lack of clear momentum. The key support level is located near 1.1400, with resistance in the 1.1600–1.1700 zone. A breakout beyond this range will determine the next direction.
EURUSD trading scenarios
The EURUSD pair ended the week at 1.1530. The dollar remained sensitive to macroeconomic data and geopolitics. On the one hand, the data signals slowing: jobless claims remain low, but continuing claims are rising, and the ADP report indicates a cooling labour market. On the other hand, retail sales show consumer resilience. Additional support for the dollar comes from Trump’s rhetoric about a possible escalation of the conflict with Iran, which boosts demand for safe-haven assets. Rising oil prices raise inflation risks and reduce the likelihood of Fed policy easing.
In March, the decline brought the price into the 1.1400–1.1500 area, where support formed, followed by consolidation. The EURUSD pair is now trading in the 1.1400–1.1600 range, near the middle Bollinger Band. MACD remains in negative territory; the Stochastic Oscillator is neutral. A resistance level stands in the 1.1600–1.1700 area.
- Buy scenario
Holding above 1.1500 would support a corrective rebound towards 1.1600–1.1700.
- Sell scenario
A breakout below 1.1500 would increase pressure and open the way to 1.1450–1.1400.
Conclusion: the baseline scenario suggests consolidation within the 1.1500–1.1650 range with a moderately bearish bias.
Summary
The EURUSD pair closed the week at 1.1530, with the dollar supported by geopolitical tensions and rising oil prices, which strengthen inflation risks and reduce the likelihood of the Federal Reserve easing. Macroeconomic data remains mixed: the labour market is gradually cooling, but consumer sentiment remains resilient. Trump’s rhetoric on Iran boosts demand for the dollar as a safe-haven asset.
Technically, the EURUSD pair remains in a downward correction after climbing towards 1.2000. A structure of lower highs has formed. The price is now fluctuating within the 1.1400–1.1600 range near the middle Bollinger Band, while MACD remains in negative territory. Resistance stands at 1.1600–1.1700. A breakout below 1.1500 will increase the risk of a decline to 1.1450–1.1400.
Editors’ picks
 EURUSD 2026-2027 forecast: key market trends and future predictions
This article provides the EURUSD forecast for 2026 and 2027 and highlights the main factors determining the direction of the pair’s movements. We will apply technical analysis, take into account the opinions of leading experts, large banks, and financial institutions, and study AI-based forecasts. This comprehensive insight into EURUSD predictions should help investors and traders make informed decisions.
 Gold (XAUUSD) forecast 2026 and beyond: expert insights, price predictions, and analysis
Dive deep into the Gold (XAUUSD) price outlook for 2026 and beyond, combining technical analysis, expert forecasts, and key macroeconomic factors. It explains the drivers behind gold’s recent surge, explores potential scenarios including a move toward 4,500 to 5,000 USD per ounce, and highlights why the metal remains a strong hedge during global uncertainty.
Forecasts presented in this section only reflect the author’s private opinion and should not be considered as guidance for trading. RoboForex bears no responsibility for trading results based on trading recommendations described in these analytical reviews.