
EURUSD weekly forecast: range with upside potential
The EURUSD pair enters the week of 10–14 August near 1.1521 amid conflicting signals from the US economy. Initial jobless claims remain low, but rising continuing claims and a weak ADP report point to slower hiring. At the same time, the Federal Reserve maintains a hawkish stance: the market is pricing in a 25-basis-point rate hike in September, while recovering oil prices provide additional support for the dollar through inflation risks.
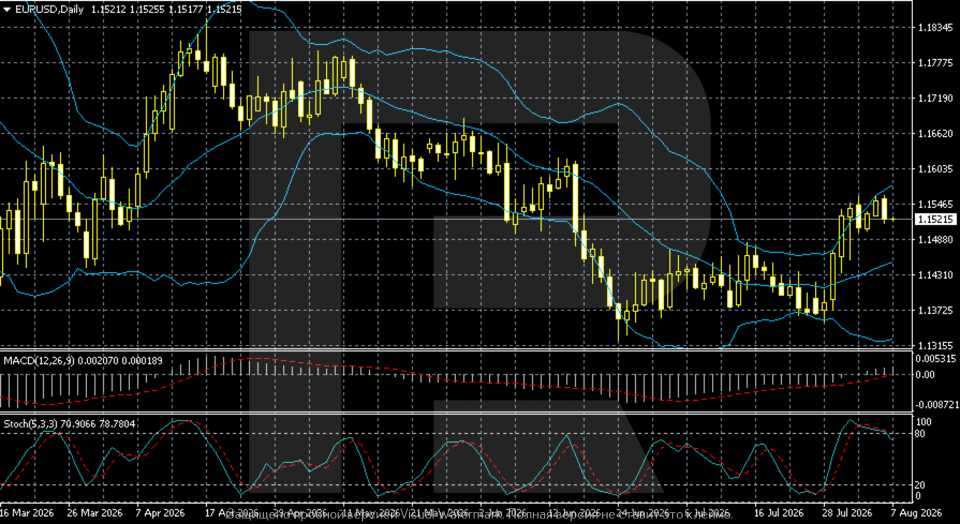
Technically, the EURUSD pair remains above the middle Bollinger Band, maintaining short-term bullish momentum. The nearest resistance level is located in the 1.1547–1.1560 zone, and a breakout above it would open the way towards 1.1604. The support level lies at 1.1488, followed by 1.1431 and 1.1373. The Stochastic Oscillator is turning down after leaving overbought territory, so a local correction is possible. As long as the pair remains above 1.1488, the baseline scenario is movement within the 1.1488–1.1560 range with a moderately positive bias.
EURUSD forecast for this week: quick overview
- Market focus: the EURUSD pair enters the week of 10–14 August near 1.1521. Signals from the US labour market remain mixed: initial jobless claims came in at 199 thousand versus the forecast of 203 thousand, but continuing claims rose to 1.801 million, while ADP showed employment increasing by only 44 thousand against the expected 68 thousand. At the same time, Federal Reserve officials are increasingly suggesting a rate hike as early as September if inflation remains high. Recovering oil prices amid tensions around the Strait of Hormuz further bolster the dollar
- Current trend: on the daily chart, the EURUSD pair is recovering from the July support and is trading near 1.1522. The price remains above the middle Bollinger Band and close to the indicator’s upper boundary. MACD has moved into positive territory and confirms strengthening bullish momentum, while the Stochastic is turning down after leaving overbought territory. The nearest resistance level is located in the 1.1547–1.1560 zone, followed by 1.1604 and 1.1662, with support levels at 1.1488, 1.1431, and 1.1373
- Weekly outlook: further price movements will depend on the persistence of inflation signals and expectations surrounding the Federal Reserve’s September decision. A consolidation above 1.1560 would open the way for the EURUSD rate towards 1.1604 and 1.1662. A return below 1.1488 would increase the risk of a correction towards 1.1431 and then 1.1373. The baseline scenario suggests movement within the 1.1488–1.1560 range with a moderately positive bias, although the broader downtrend has not yet been completely broken
EURUSD fundamental analysis
The EURUSD pair closed the week near 1.1521.
Signals from the US labour market appear mixed. Initial jobless claims remain low at 199 thousand versus the forecast of 203 thousand, indicating no sharp deterioration in the labour market. However, continuing claims rose to 1.801 million, while ADP data showed private sector employment increasing by only 44 thousand versus the expected 68 thousand, indicating slower hiring and greater difficulty in finding new employment.
Federal Reserve officials are increasingly signalling that a policy tightening is imminent. The market is already pricing in a 25-basis-point rate hike in September. According to the Financial Times, Kevin Warsh is prepared to support such a move if inflation readings remain high in the coming weeks. At the same time, his restrained communication style adds further uncertainty for investors.
The dollar is also supported by recovering oil prices after renewed tensions around the Strait of Hormuz. The baseline scenario remains neutral to positive: a strong employment report would reinforce expectations of a September rate hike and allow the US Dollar Index to return above 100, while weak data would increase pressure on the US currency.
EURUSD technical analysis
On the daily chart, the EURUSD pair continues to recover from the July support and is trading near 1.1522. The price remains above the middle Bollinger Band and close to the indicator’s upper boundary, confirming the buyers’ advantage. However, the broader downtrend formed after the April high has not yet been completely broken.
The nearest resistance level is located in the 1.1547–1.1560 zone. A breakout above it would open the way towards 1.1604 and then 1.1662. Support levels are located at 1.1488 and 1.1431, while a return below the middle Bollinger Band would increase the risk of a deeper correction towards 1.1373.
MACD has moved into positive territory, indicating increased bullish momentum. The Stochastic Oscillator is turning down after leaving overbought territory, so a pause or local pullback is possible at current levels. The baseline scenario remains movement within the 1.1488–1.1560 range with a moderately positive bias.
EURUSD trading scenarios
The EURUSD pair enters the week of 10–14 August near 1.1521. Signals from the US labour market remain mixed: initial jobless claims remain low at 199 thousand, but continuing claims rose to 1.801 million, while ADP showed private sector job growth of only 44 thousand against the expected 68 thousand. At the same time, Federal Reserve officials are increasingly signalling a rate hike as early as September if inflation remains persistent. The dollar is also bolstered by recovering oil prices amid tensions around the Strait of Hormuz.
From a technical perspective, the EURUSD pair continues to recover from the July lows and remains above the middle Bollinger Band. MACD has moved into positive territory and confirms stronger buying momentum, while the Stochastic Oscillator is turning down after leaving overbought territory. The broader downtrend formed after the April highs has not yet been completely broken.
- Buy scenario
A consolidation above the 1.1547–1.1560 resistance zone would confirm continued recovery and open the way towards 1.1604 and then 1.1662. Further cooling in the US labour market or weaker expectations of a Federal Reserve rate hike could provide additional support for the pair.
- Sell scenario
A return below the 1.1488 support level would signal a correction and create a risk of a decline towards 1.1431. A breakout below this level would increase pressure on the EURUSD rate and bring the 1.1373 area back into focus.
Conclusion: the short-term advantage remains with buyers, but upside potential is limited by expectations of a Federal Reserve rate hike and signs of overbought conditions. The baseline scenario for the week is movement within the 1.1488–1.1560 range with a moderately positive bias. To extend its gains, the EURUSD pair needs to consolidate firmly above 1.1560.
Summary
The EURUSD pair ended the week near 1.1521. Signals from the US labour market remain mixed: initial jobless claims remain low, but rising continuing claims and weak ADP data point to slower hiring. Meanwhile, the Federal Reserve maintains a hawkish stance, with the market pricing in a 25-basis-point rate hike in September.
On the daily chart, the EURUSD rate continues to recover from the July support and remains above the middle Bollinger Band. The nearest resistance is located in the 1.1547–1.1560 zone, and a breakout above it would open the way towards 1.1604. The support level lies at 1.1488, followed by 1.1431 and 1.1373. As long as the pair remains above 1.1488, the baseline scenario is movement within the 1.1488–1.1560 range with a moderately positive bias.
Editors’ picks
 EURUSD forecast 2026–2027: technical analysis, price levels & predictions
EURUSD has pulled back from the 2026 high of 1.1915 and is now trading near 1.1450 — below both EMA65 and EMA200 — with the active scenario shifting from bullish to bearish. The ECB raised rates to 2.40%, but the Fed holds at 3.75%, and US inflation (3.5%) continues to outpace the eurozone (2.8%). A confirmed break below 1.1280 opens the next downward wave toward 1.1080. We break down the key levels, three trading scenarios with entry triggers, and what Deutsche Bank, Morgan Stanley and UBS are forecasting for EURUSD in 2026.
 Gold (XAUUSD) forecast 2026: predictions based on fundamental and technical analysis
Gold has corrected over 25% from its all-time high of 5,597 USD and is now trading near 4,100 USD — testing a critical support zone. Is this the bottom, or will the downtrend continue? We break down the key levels (support 3,920 USD, breakout trigger 4,500 USD), three trading scenarios with entry levels, and what J.P. Morgan, Goldman Sachs and Deutsche Bank are forecasting for gold in 2026.
Forecasts presented in this section only reflect the author’s private opinion and should not be considered as guidance for trading. RoboForex bears no responsibility for trading results based on trading recommendations described in these analytical reviews.