GBPUSD could rise, but for now it is falling because of risks in the energy sector
The GBPUSD pair fell to 1.3400. The market is factoring in the possibility of an energy shock. More details are in our analysis for 25 March 2026.
GBPUSD forecast: key takeaways
- The GBPUSD pair may continue to rise if the news flow remains neutral
- The current structure looks like a sideways range within the boundaries of 1.3250–1.3480
- GBPUSD forecast for 25 March 2026: 1.3480
Fundamental analysis
The GBPUSD rate fell to 1.3400 amid weak PMI data and stronger tension in the Middle East. All of this has become the basis for fears about a possible energy shock.
Business activity in the UK slowed to its lowest levels since September 2025. The conflict around Iran is restraining economic growth and at the same time accelerating inflation. Costs in industry are rising at the fastest pace since Black Wednesday in 1992.
The market is also continuing to watch developments in the Middle East. Donald Trump previously announced a five-day pause in strikes on Iran’s energy infrastructure, stating that there were “positive negotiations”. However, Tehran denied this, although reports of informal contacts remain.
A sharp rise in energy prices has changed expectations for Bank of England policy. The market is now pricing in several rate hikes this year, whereas before the conflict it had expected two rate cuts.
The GBPUSD forecast remains moderate.
Technical outlook
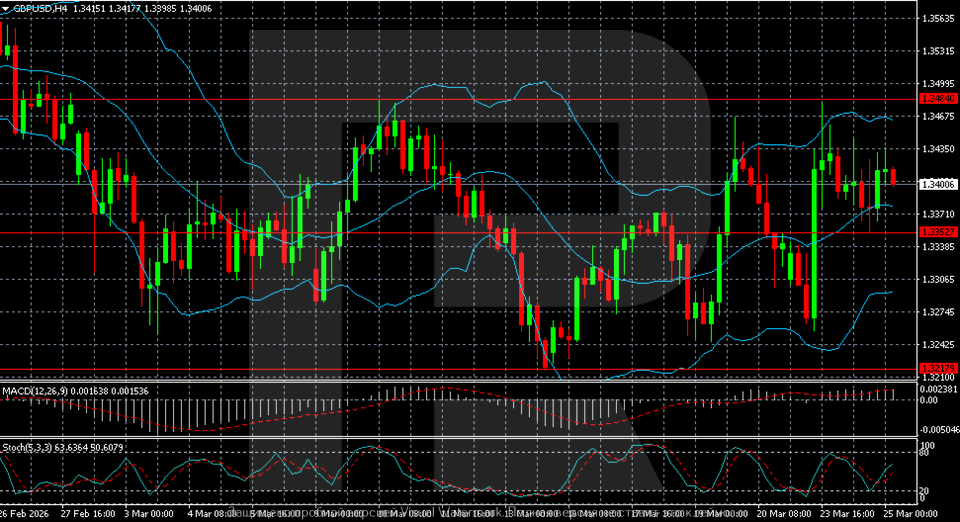
The GBPUSD (H4) chart shows that after declining in late February, the pair formed a local bottom around 1.3210–1.3220, from which a recovery began. Before that, the movement had been clearly downwards, with lows updated one after another. However, in the middle of March sellers lost control, and the market moved into a more volatile phase with attempts at growth.
The current structure looks like a sideways range of approximately 1.3250–1.3480. The price is testing the upper boundary near 1.3450–1.3480 repeatedly, but it cannot consolidate above it, which points to strong resistance. At the same time, buyers are supporting pullbacks above the 1.3300–1.3350 zone, forming higher lows and creating a basis for a possible continuation of the recovery. Bollinger Bands are gradually narrowing, signalling lower volatility.
Indicators reflect neutral dynamics with an upward bias. MACD is near the zero line and shows a weak positive impulse, while the stochastic is fluctuating in the middle zone, periodically entering overbought territory. This points to a balance of forces: a breakout of 1.3480 will strengthen the bullish scenario, while a return below 1.3350 may restore seller pressure and lead to a retest of the lower boundary of the range.
GBPUSD overview
- Asset: GBPUSD
- Timeframe: H4 (Intraday)
- Trend: sideways with an upward bias
- Key resistance levels: 1.3480 and 1.3550
- Key support levels: 1.3350 and 1.3220
GBPUSD trading scenarios for today
Main scenario (Buy Stop)
Consolidation above the 1.3480 level will confirm an exit from the range and the development of a recovery move. In this case, the pair may continue to rise amid a corrective impulse.
- Take Profit: 1.3550
- Stop Loss: 1.3400
Alternative scenario (Sell Stop)
A breakout of support at 1.3350 will increase pressure from sellers and point to a return to decline within the range.
- Take Profit: 1.3220
- Stop Loss: 1.3405
Risk factors
The risks to growth are linked to stronger geopolitical tension and a possible strengthening of the dollar. An additional factor will be the inability to consolidate above 1.3480, which may return the market to the lower boundary of the range.
Summary
The GBPUSD pair has edged lower, but it still retains some upward impulse. The GBPUSD forecast for today, 25 March 2026, does not rule out a rise towards 1.3480.
Editors’ picks
 EURUSD 2026-2027 forecast: key market trends and future predictions
This article provides the EURUSD forecast for 2026 and 2027 and highlights the main factors determining the direction of the pair’s movements. We will apply technical analysis, take into account the opinions of leading experts, large banks, and financial institutions, and study AI-based forecasts. This comprehensive insight into EURUSD predictions should help investors and traders make informed decisions.
 Gold (XAUUSD) forecast 2026 and beyond: expert insights, price predictions, and analysis
Dive deep into the Gold (XAUUSD) price outlook for 2026 and beyond, combining technical analysis, expert forecasts, and key macroeconomic factors. It explains the drivers behind gold’s recent surge, explores potential scenarios including a move toward 4,500 to 5,000 USD per ounce, and highlights why the metal remains a strong hedge during global uncertainty.
Forecasts presented in this section only reflect the author’s private opinion and should not be considered as guidance for trading. RoboForex bears no responsibility for trading results based on trading recommendations described in these analytical reviews.