EURUSD, USDJPY, GBPUSD, AUDUSD, USDCHF, NZDUSD, and USDCAD technical analysis and forecast for 16-20 September 2024
Here is a detailed weekly technical analysis and foreign exchange (forex) forecast for EURUSD, USDJPY, GBPUSD, AUDUSD, USDCHF, NZDUSD, and USDCAD for 16-20 September 2024.
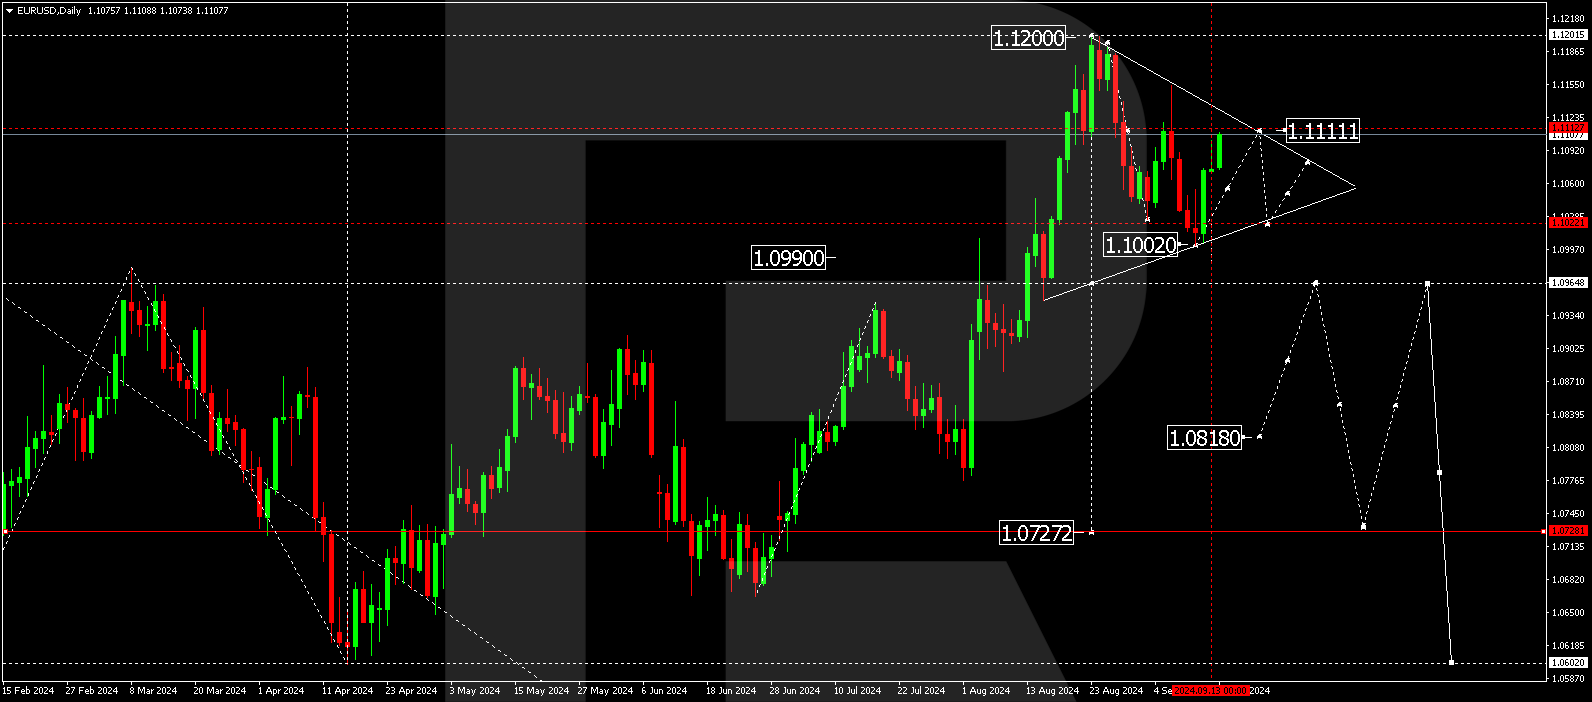
EURUSD forecast
The EURUSD forecast suggests that the pair offers to consider the first downward wave towards 1.1002. The second corrective wave is forming, with the target at 1.1111, potentially extending to 1.1128. A triangle technical pattern could form. Subsequently, the price is expected to decline to the pattern’s lower boundary at 1.1022. A breakout below this level will open the potential for a downward wave towards 1.0966, potentially continuing the trend to the local target of 1.0818.
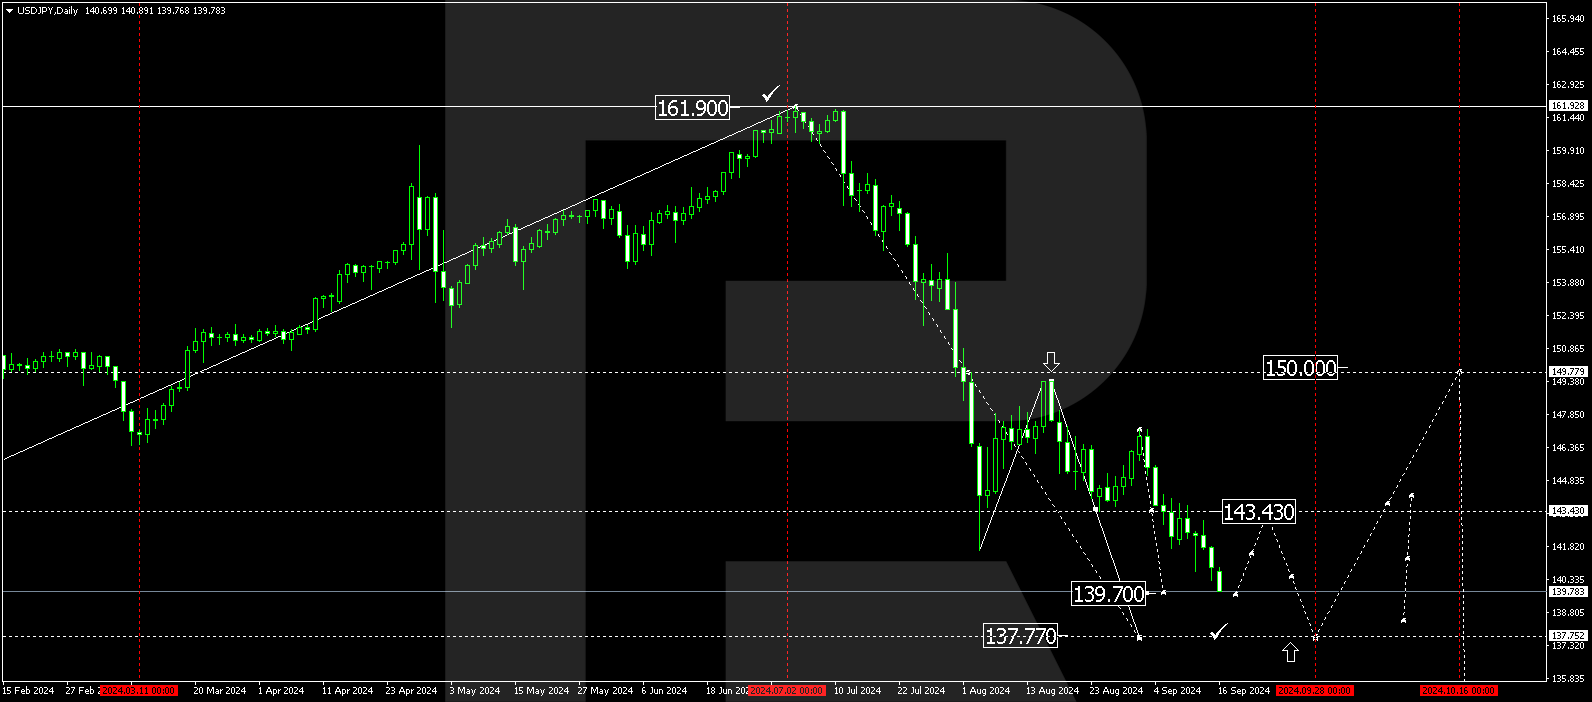
USDJPY forecast
The USDJPY forecast suggests that the pair maintains its downward trajectory towards 137.77. The market is forming the structure of the fifth wave. The price is expected to reach the wave’s local target of 139.70 today, with a rise to 143.43 (testing from below) possible this week. Subsequently, a new downward wave might start, aiming for 137.77 as the main target. Once the price hits this level, a new growth wave could begin, targeting 150.00.
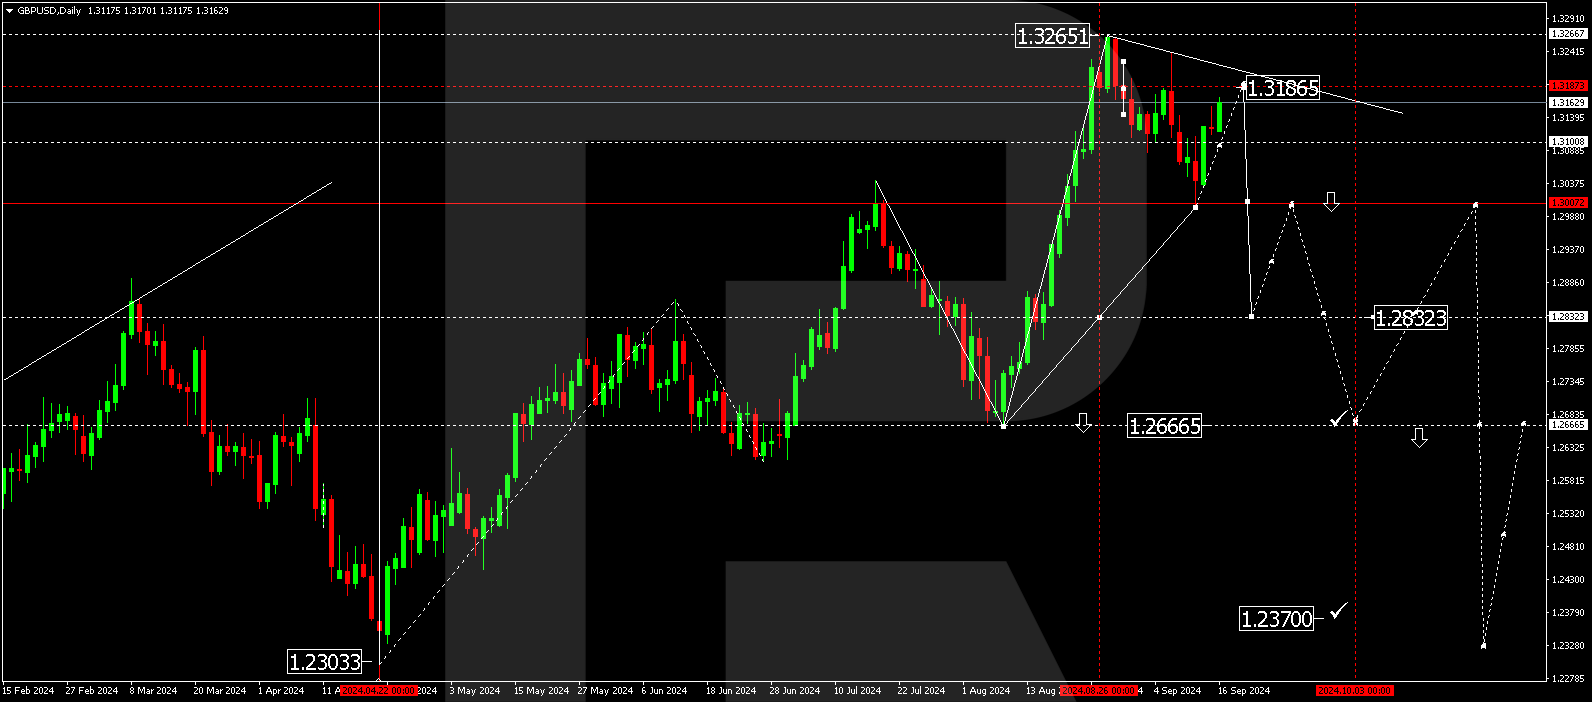
GBPUSD forecast
The GBPUSD pair has completed the first downward wave, reaching 1.3002. A correction towards 1.3186 is expected to form this week. Subsequently, a downward wave could start, aiming for 1.3000 in the short-term GBPUSD outlook. A breakout below this level may signal a continuation of the trend towards 1.2832, with the downward wave potentially developing towards 1.2666.
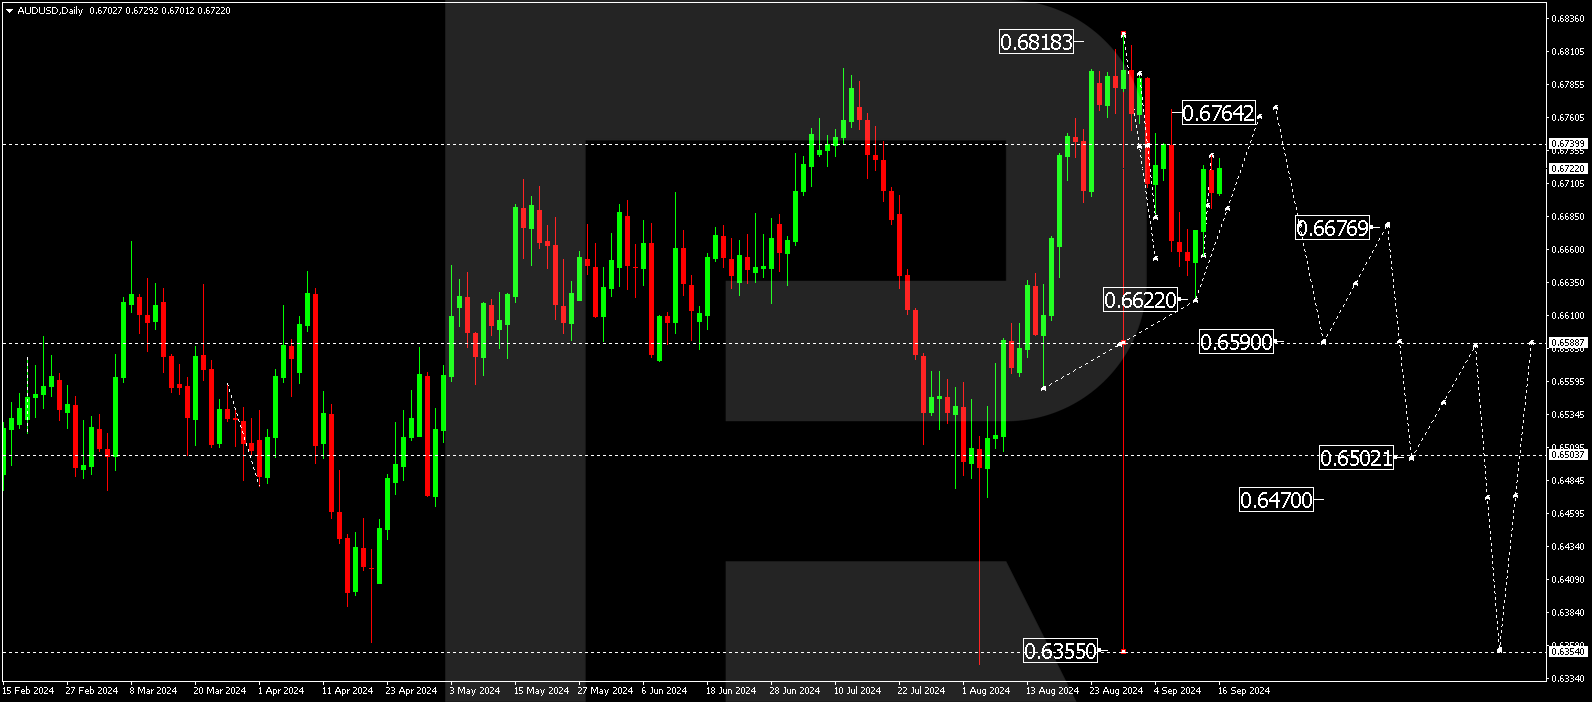
AUDUSD forecast
The AUDUSD pair has completed the first downward wave, reaching 0.6622. A correction towards at least 0.6740 is expected this week, potentially continuing towards 0.6764. Once the correction is complete, a new downward wave could develop, aiming for 0.6590. Breaking below this level may signal a continuation of the trend in the AUDUSD outlook towards the 0.6414 target level, with the downward wave potentially aiming for 0.6355.
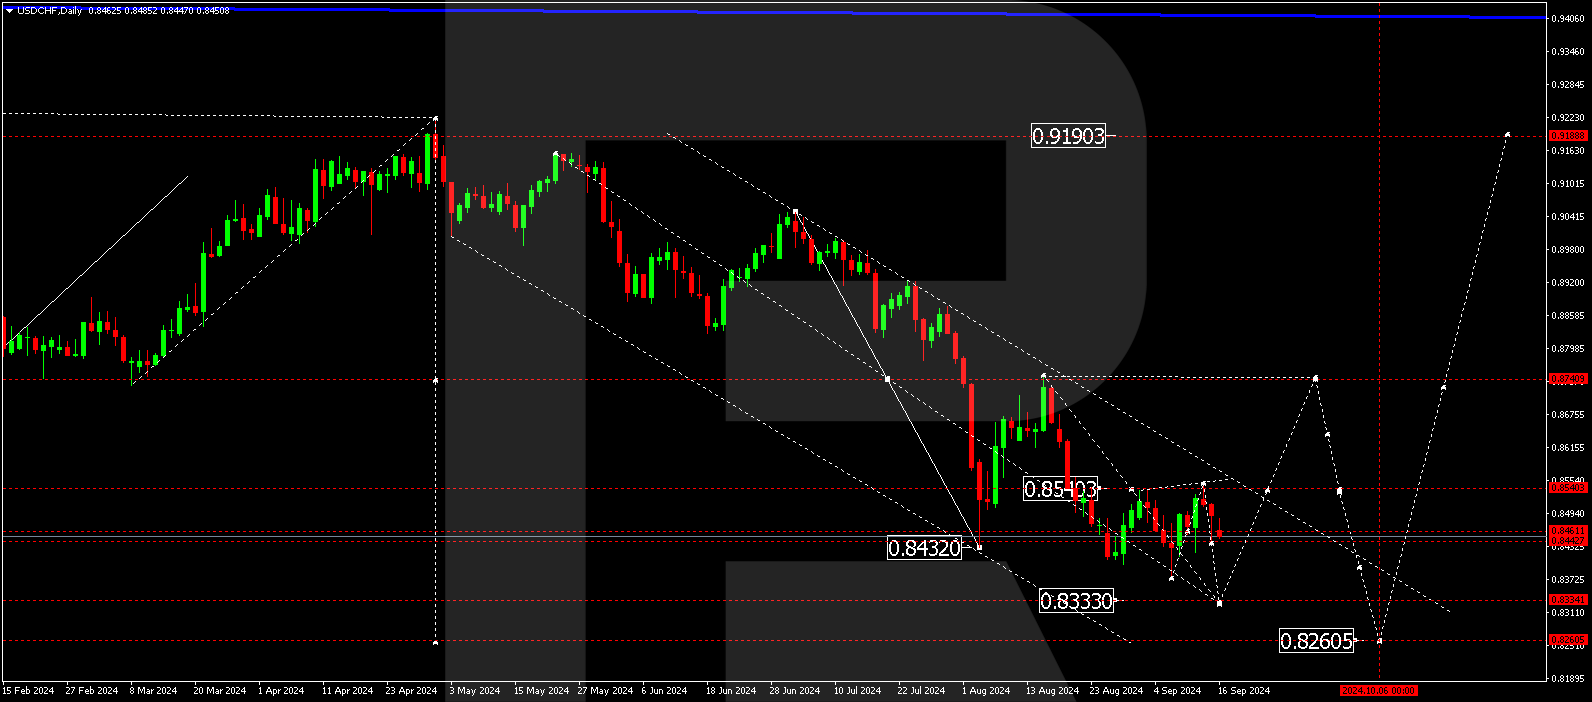
USDCHF forecast
The USDCHF forecast suggests that the pair is forming a consolidation range around 0.8460, which has been extended down to 0.8370 and up to 0.8540. A decline to the 0.8440 level and a breakout below it will open the potential for a downward wave towards 0.8333. After reaching this level, the price could correct towards 0.8540. Breaking above this level may signal a continuation of the growth wave towards 0.8740.
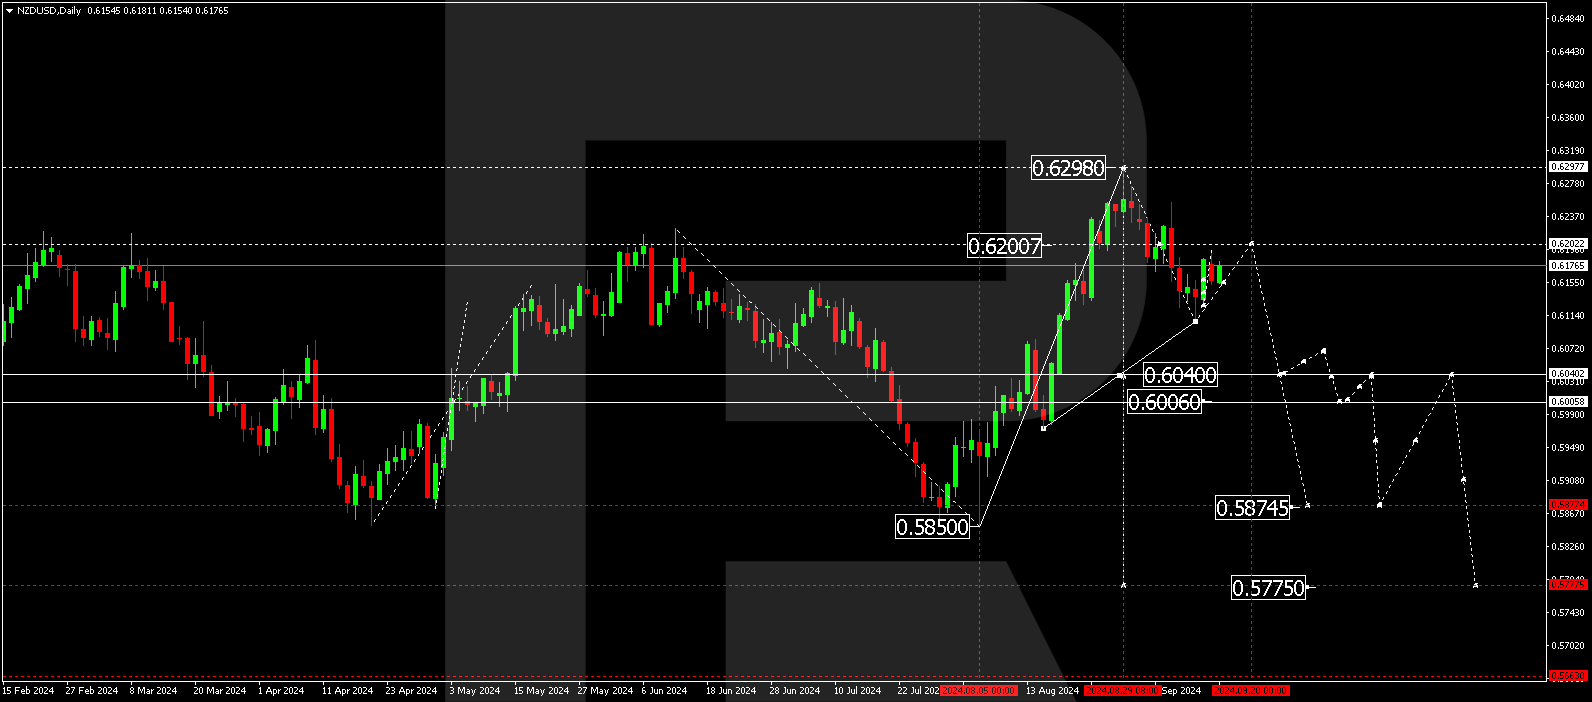
NZDUSD forecast
The NZDUSD pair has completed the first downward wave, reaching 0.6107. The market continues developing the second corrective wave towards 0.6200 (testing from below) today. Subsequently, the downward wave could continue towards 0.6040. Breaking below the 0.6040 level may be considered a signal for a continuation of the trend towards the local target of 0.5875. A downward wave is practically considered for NZDUSD prediction with the main target at 0.5775.
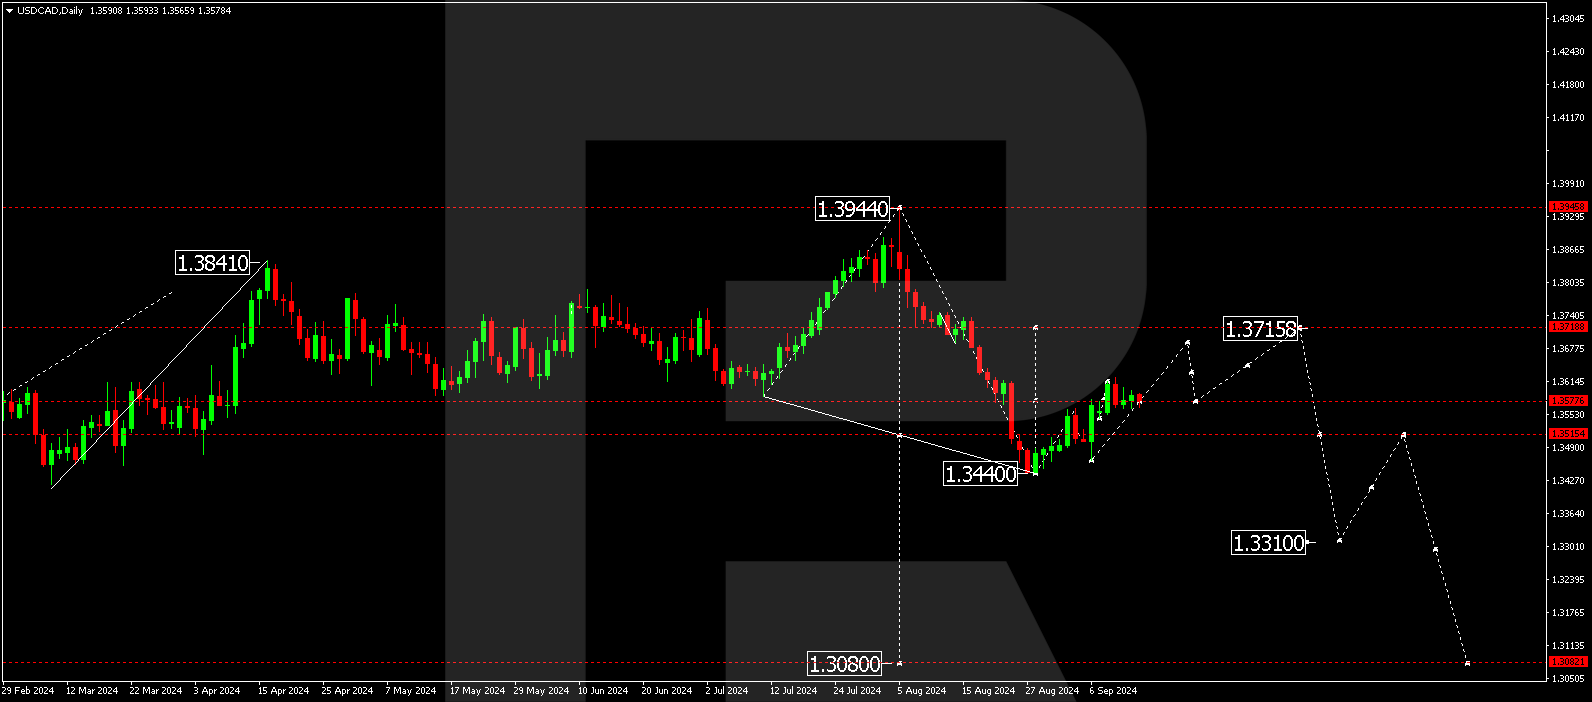
USDCAD forecast
The USDCAD outlook suggests that the pair has completed the first downward wave, reaching 1.3440. The growth impulse towards 1.3577 is complete, with a consolidation range forming around this level. An upward breakout of the range is possible this week, with the target at 1.3686. With a downward breakout, the trend could continue towards 1.3515. Breaking below this level may signal a continuation of the trend towards the local target of 0.3310. Based on the current USDCAD forecast, traders should monitor these key levels closely for potential trend reversals or continuations.
Forecasts presented in this section only reflect the author’s private opinion and should not be considered as guidance for trading. RoboForex bears no responsibility for trading results based on trading recommendations described in these analytical reviews.