USDCAD follows oil and gold: the Canadian dollar gains ground
The USDCAD pair opened March and the spring season at 1.3649, with the market focused on commodity markets and the trajectory of the US dollar. Find out more in our analysis for 2 March 2026.
USDCAD forecast: key takeaways
- The USDCAD pair is declining in response to rallies in gold and oil
- Canada’s GDP came in weak, showing the softest performance since 2020
- USDCAD forecast for 2 March 2026: 1.3610
Fundamental analysis
The USDCAD rate is hovering around 1.3649 on Monday. Last Friday, the Canadian dollar recovered most of its monthly losses amid broad US dollar weakness.
Additional support for the CAD came from rising gold prices and a weakening US dollar. The strengthening of the precious metal adds to pressure on the USD, pushing the USDCAD pair lower. Financial flows at the end of the month also played a role, with the Canadian dollar losing about 0.1% in February.
Oil prices are climbing amid concerns over supply disruptions, which is a positive development for Canada as a major oil exporter.
At the same time, macroeconomic data was weak. Canada’s Q4 GDP contracted by 0.6% year-on-year, while markets had expected stagnation. This marks the weakest annual growth pace since 2020. The economy appears weaker than the Bank of Canada’s forecasts, although some details of the report were stronger than the headline figure.
The USDCAD outlook is moderately negative.
Technical outlook
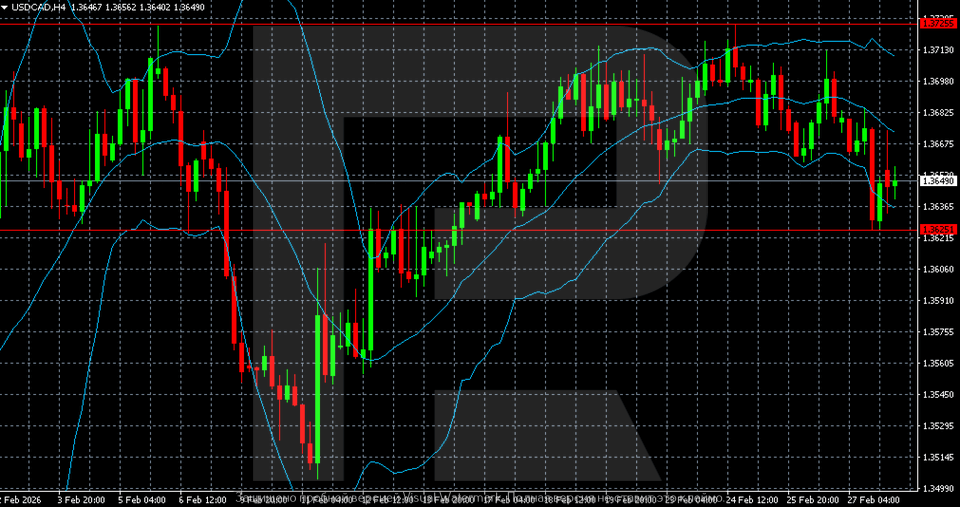
In early February, the USDCAD pair gained a sharp downward momentum on the H4 chart, reaching a new low near 1.3510–1.3520. From this area, a strong reversal occurred, accompanied by widening Bollinger Bands, indicating heightened volatility and strong momentum.
The pair then recovered towards the 1.3710–1.3725 resistance zone but failed to consolidate above it, shifting into range-bound trading.
In recent sessions, the price has declined towards the 1.3625 support level and is attempting to stabilise. Bollinger Bands are gradually narrowing, signalling a transition from an impulsive phase to consolidation.
The key support level lies at 1.3625, followed by 1.3510, with the resistance level at 1.3725. While the medium-term structure after the reversal remains recovery-oriented, in the short term, the pair is moving sideways with moderate downward pressure.
USDCAD overview
- Asset: USDCAD
- Timeframe: H4 (Intraday)
- Trend: bearish
- Key resistance levels: 1.3650 and 1.3725
- Key support levels: 1.3625 and 1.3510
USDCAD trading scenarios for today
Main scenario (Buy Stop)
A move above 1.3650 would confirm a breakout from local consolidation and create conditions for growth towards the upper boundary of the range at 1.3725. The risk-to-reward ratio is close to 1:2, with potential upside of around 70 pips and a risk of approximately 35–40 pips.
- Take Profit: 1.3725
- Stop Loss: 1.3610
Alternative scenario (Sell Stop)
A breakout below 1.3625 would intensify short-term pressure and open the way towards 1.3510. Losing this zone would revive the downward momentum formed in early February.
- Take Profit: 1.3510
- Stop Loss: 1.3665
Risk factors
The key drivers for the USDCAD pair remain oil and gold prices, which support the CAD, as well as expectations for Bank of Canada policy following weak GDP data (-0.6% year-on-year in Q4). Additional pressure or support will depend on US dollar dynamics and changes in Federal Reserve rate expectations.
Summary
The USDCAD pair is declining due to news pressure, with the forecast for 2 March 2026 suggesting a move lower towards 1.3610.
Editors’ picks
 EURUSD 2026-2027 forecast: key market trends and future predictions
This article provides the EURUSD forecast for 2026 and 2027 and highlights the main factors determining the direction of the pair’s movements. We will apply technical analysis, take into account the opinions of leading experts, large banks, and financial institutions, and study AI-based forecasts. This comprehensive insight into EURUSD predictions should help investors and traders make informed decisions.
 Gold (XAUUSD) forecast 2026 and beyond: expert insights, price predictions, and analysis
Dive deep into the Gold (XAUUSD) price outlook for 2026 and beyond, combining technical analysis, expert forecasts, and key macroeconomic factors. It explains the drivers behind gold’s recent surge, explores potential scenarios including a move toward 4,500 to 5,000 USD per ounce, and highlights why the metal remains a strong hedge during global uncertainty.
Forecasts presented in this section only reflect the author’s private opinion and should not be considered as guidance for trading. RoboForex bears no responsibility for trading results based on trading recommendations described in these analytical reviews.