What lies ahead for USDCAD: oil and the Bank of Canada versus the US Fed
The USDCAD pair continues its correction while waiting for fresh drivers. Quotes are hovering around 1.3725. Discover more in our analysis for 23 March 2026.
USDCAD forecast: key takeaways
- Rising oil prices increase export revenues and capital inflows into Canada
- On 18 March 2026, the Bank of Canada kept the key rate at 2.0%
- The US Federal Reserve left the rate unchanged at 3.75%
- USDCAD forecast for 23 March 2026: 1.3595
Fundamental analysis
Today’s USDCAD outlook favours the Canadian dollar: after the correction, the pair may form a new downward wave, with quotes currently hovering around 1.3725.
The main driver today is the escalation around the Strait of Hormuz. US President Donald Trump is considering a ground operation to seize Iran’s Kharg Island, a key oil hub. This statement pushed oil prices above 100.00 USD per barrel.
For Canada, one of the largest exporters of crude to the US, this is both a blessing and a curse:
- Pros for the CAD: higher oil prices boost export revenues and capital inflows into the country, which fundamentally supports the Canadian currency
- Cons for the USDCAD pair: this factor prevents the pair from moving into a confident rise, keeping it capped near the upper boundary of the channel
The monetary duo: Fed versus the Bank of Canada
Last week, both central banks held meetings, and their messaging created a unique setup for the pair:
- The Bank of Canada kept the key rate at 2.0% on 18 March 2026, effectively ending its aggressive easing cycle. In its statement, the BoC warned that uncertainty is rising: inflation risks are increasing due to expensive energy, while the economy is slowing. This puts the BoC in a bind: cutting rates to support growth is not an option due to inflation
- The US Federal Reserve held its rate unchanged at 3.75%, expressing concern that high oil prices could reignite an inflation spiral
The interest rate differential between the US and Canada remains significant (about 1.75% in favour of USD), making the US dollar more attractive for carry traders and being USD’s main advantage versus the CAD, outweighing even the oil factor.
The USDCAD pair is now in a fragile balance. Oil is trying to pull the CAD stronger, while the USD, backed by rising geopolitical tension and a steady rate premium, keeps the upper hand. As long as Middle East tensions remain elevated and the Federal Reserve does not shift to a more dovish tone, any drop in the USDCAD rate below 1.3700 will likely attract strong buying interest.
Technical outlook
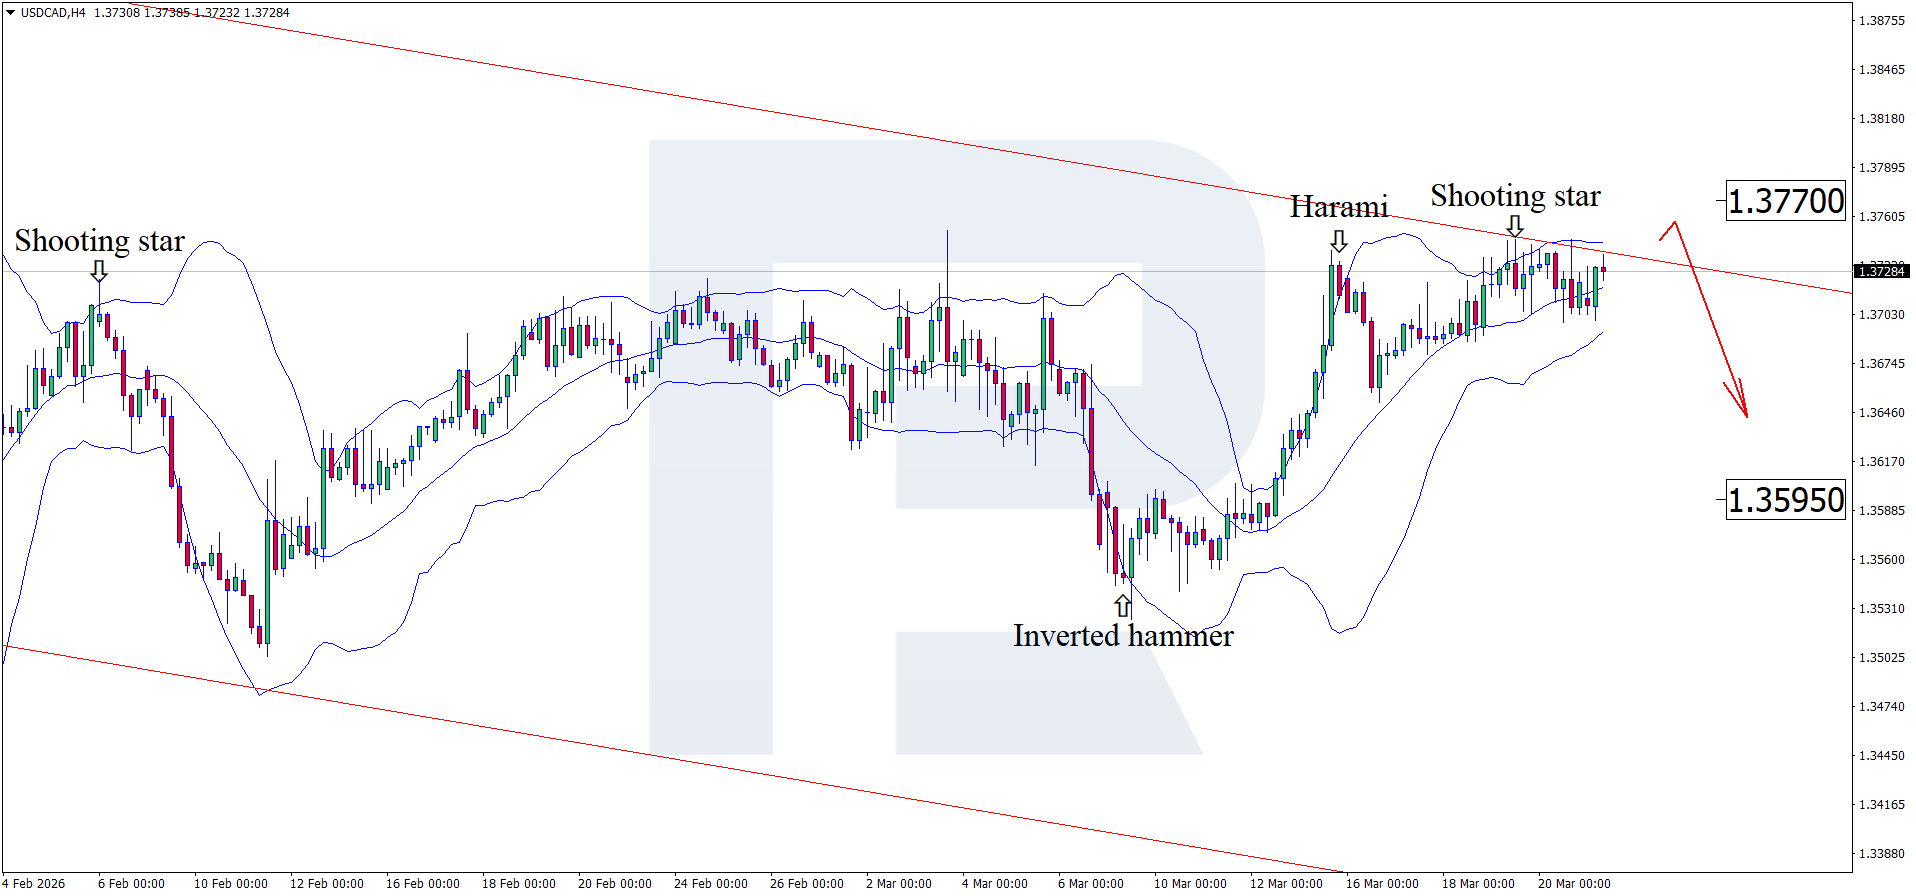
On the H4 chart, the USDCAD pair formed a Shooting Star reversal pattern near the upper Bollinger Band and may now develop a downward wave as the signal plays out. Since quotes are testing the upper boundary of the descending channel, a move down towards the nearest support level at 1.3595 is possible. A breakout below it would open the way for a continued downtrend.
At the same time, the forecast for 23 March 2026 also includes an alternative scenario where the price corrects up to 1.3770 before resuming the decline.
USDCAD overview
- Asset: USDCAD
- Timeframe: H4 (Intraday)
- Trend: bearish
- Key resistance levels: 1.3770 and 1.3925
- Key support levels: 1.3685 and 1.3595
USDCAD trading scenarios for today
Main scenario (Sell Stop)
A consolidation below 1.3685 would confirm a breakout from local consolidation and create conditions for a decline towards 1.3595. The risk-to-reward ratio is above 1:4. The downside potential is about 90 pips with a risk of around 20 pips.
- Take Profit: 1.3595
- Stop Loss: 1.3705
Alternative scenario (Buy Stop)
A breakout above the 1.3770 resistance level would strengthen bullish pressure and open the way to 1.3925, extending the growth wave that began in early March.
- Take Profit: 1.3925
- Stop Loss: 1.3745
Risk factors
Key drivers for the USDCAD pair remain rising oil prices that support the CAD, and expectations for Bank of Canada policy after weak GDP (-0.6% y/y in Q4). Additional pressure or support will depend on USD performance tied to Middle East developments and the revision of Fed and BoC rate expectations.
Summary
With oil prices rising, the CAD has a solid chance to stay supported in the near term. USDCAD technical analysis suggests a potential decline towards the support area at 1.3595.
Editors’ picks

EURUSD 2026-2027 forecast: key market trends and future predictions
This article provides the EURUSD forecast for 2026 and 2027 and highlights the main factors determining the direction of the pair’s movements. We will apply technical analysis, take into account the opinions of leading experts, large banks, and financial institutions, and study AI-based forecasts. This comprehensive insight into EURUSD predictions should help investors and traders make informed decisions.

Gold (XAUUSD) forecast 2026 and beyond: expert insights, price predictions, and analysis
Dive deep into the Gold (XAUUSD) price outlook for 2026 and beyond, combining technical analysis, expert forecasts, and key macroeconomic factors. It explains the drivers behind gold’s recent surge, explores potential scenarios including a move toward 4,500 to 5,000 USD per ounce, and highlights why the metal remains a strong hedge during global uncertainty.
Forecasts presented in this section only reflect the author’s private opinion and should not be considered as guidance for trading. RoboForex bears no responsibility for trading results based on trading recommendations described in these analytical reviews.