USDCAD in a trap: cheap oil is breaking the Canadian dollar’s game
After attempts to strengthen, the CAD is losing ground amid falling oil prices. At this stage, quotes are testing the 1.3600 level. Find more details in our analysis for 4 May 2026.
USDCAD forecast: key takeaways
- Starting on Monday, the US will begin an operation to escort neutral vessels blocked in the Persian Gulf through the Strait of Hormuz
- The USDCAD pair has stalled near the lower boundary of its annual range, awaiting a new driver
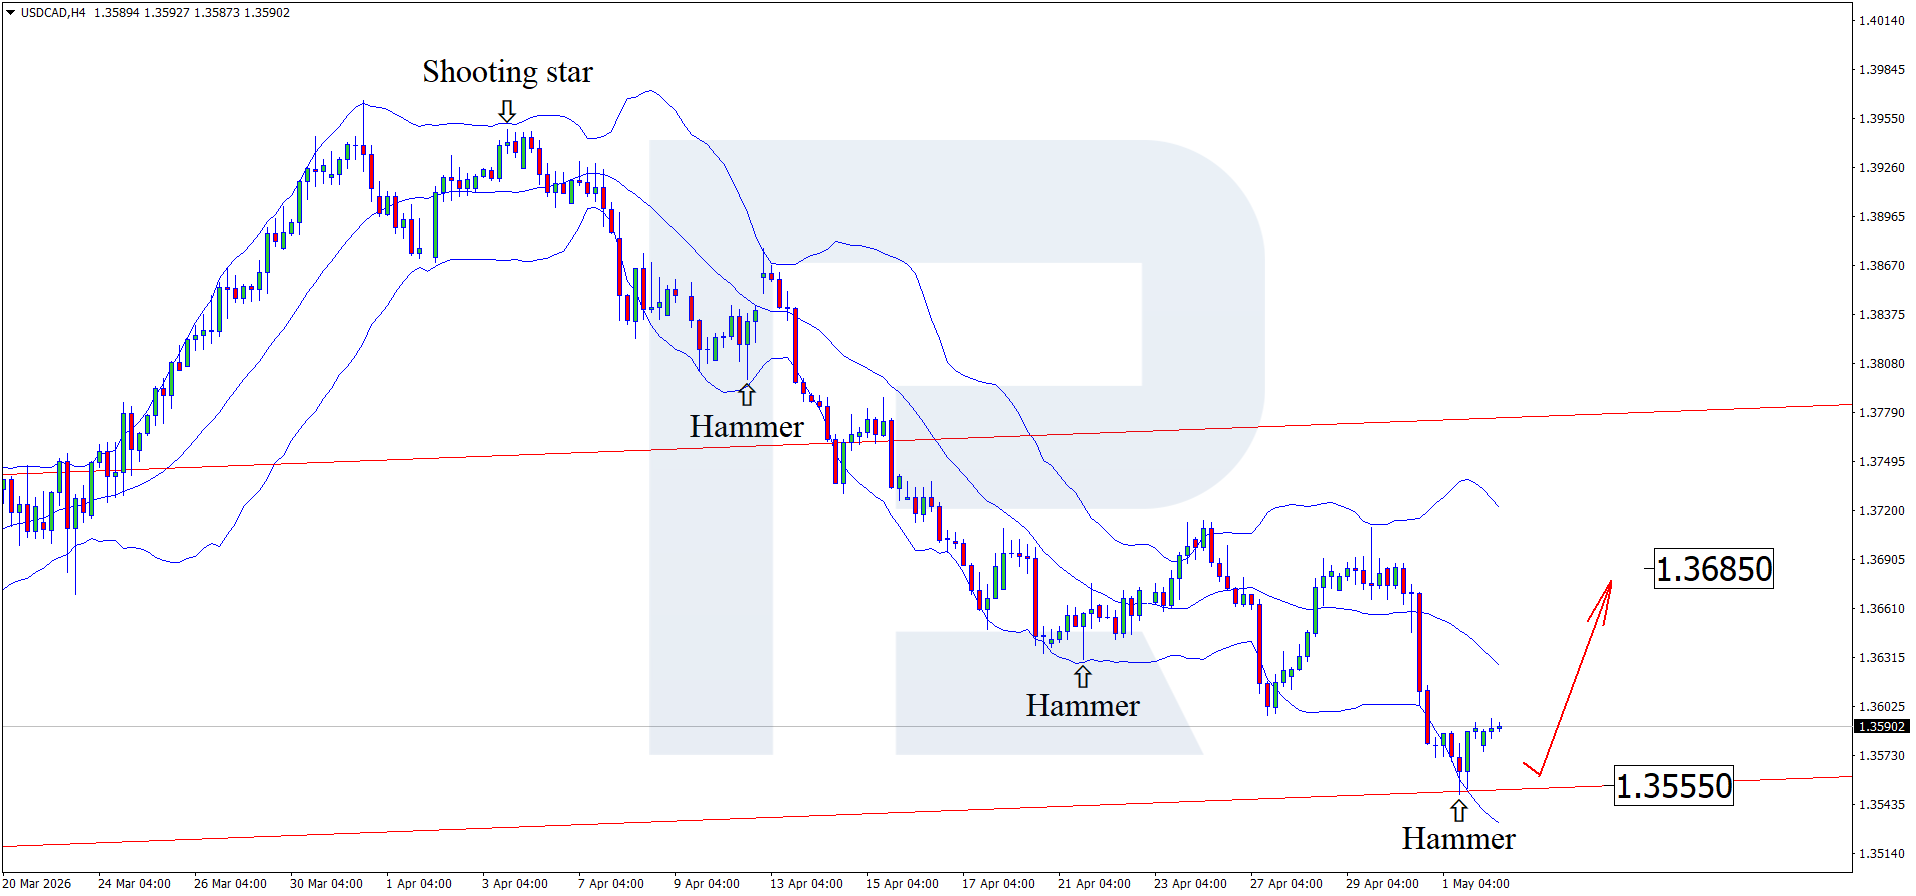
- USDCAD forecast for 4 May 2026: 1.3685 or 1.3555
Fundamental analysis
The USDCAD forecast for today, 4 May 2026, shows that the pair opened the week with growth, balancing near the lower boundary of the multi-month range. On Monday morning, quotes are consolidating around 1.3585-1.3590, showing a second consecutive session of growth after the pair closed last week at its lowest levels since the beginning of March.
On Sunday, 3 May, Donald Trump made a statement that changed the balance of power in the market. Starting on Monday, the US will begin an operation to escort neutral vessels blocked in the Persian Gulf through the Strait of Hormuz.
The market interpreted the news as a reduction in the immediate threat of further escalation. Contrary to logic, the Canadian dollar is weakening due to falling oil prices, while the dollar is not receiving support due to the declining geopolitical premium.
The US Dollar Index (DXY) is hovering near three-week lows. Investors have stopped buying the US currency as a safe-haven asset, as news of ships being escorted through the Strait of Hormuz and a new round of negotiations reduce the likelihood of an immediate full-scale war. The paradox of the day is that the CAD cannot take advantage of the dollar’s weakness, as the loonie’s main asset is high oil prices, which are currently falling.
The forecast for 4 May 2026 takes into account that the USDCAD rate is in a bind. Hopes for a de-escalation of the conflict, with vessel escorting and a one-month deadline for negotiations, have sent oil down, depriving the Canadian dollar of its main support, but at the same time, they have weakened demand for the dollar as a safe-haven asset. As a result, the pair has frozen near the lower boundary of its annual range, awaiting a new driver. Speeches by Bank of Canada officials could be a key driver this week: any suggestion that the pause in rate hikes will continue (at a time when the Fed and the ECB are tightening policy) could send the CAD tumbling and push the USDCAD rate back towards 1.3700. The risk of a breakout below the 1.3555 support level remains, but a bearish breakout needs a stronger signal than the current geopolitical hopes.
Technical outlook
On the H4 chart, the USDCAD pair has formed a Hammer reversal pattern near the lower Bollinger Band and may continue its upward movement following the signal. Since quotes remain within an ascending channel, growth towards the nearest resistance level at 1.3685 may be expected. A breakout above this level would open the way for continued upward momentum.
At the same time, the USDCAD forecast for today, 4 May 2026, also includes a market scenario in which the USDCAD rate falls to 1.3555.
USDCAD overview
- Asset: USDCAD
- Timeframe: H4 (Intraday)
- Trend: downward
- Key resistance levels: 1.3685 and 1.3800
- Key support levels: 1.3555 and 1.3485
USDCAD trading scenarios for today
Main scenario (Buy Stop)
Consolidation above 1.3685 would confirm the start of an uptrend and open the way to 1.3800 if external pressure on the CAD remains.
- Take Profit: 1.3800
- Stop Loss: 1.3655
Alternative scenario (Sell Stop)
A breakout below the 1.3555 support level would indicate stronger pressure on the USD and a continued downward wave, with the potential for quotes to fall towards the 1.3485 area.
- Take Profit: 1.3485
- Stop Loss: 1.3585
Risk factors
Geopolitics and oil prices remain factors influencing the USDCAD rate. Rising energy prices are supporting the CAD, but demand for the dollar as a safe-haven asset and expectations of hawkish Fed policy are keeping the USD strong. If Brent continues to fall, this will further weaken the CAD.
Summary
After strengthening, the CAD is once again losing ground, driven by falling oil prices amid the geopolitical situation in the Middle East. USDCAD technical analysis suggests growth towards the 1.3685 resistance level.
Editors’ picks
 EURUSD 2026-2027 forecast: key market trends and future predictions
This article provides the EURUSD forecast for 2026 and 2027 and highlights the main factors determining the direction of the pair’s movements. We will apply technical analysis, take into account the opinions of leading experts, large banks, and financial institutions, and study AI-based forecasts. This comprehensive insight into EURUSD predictions should help investors and traders make informed decisions.
 Gold (XAUUSD) forecast 2026 and beyond: expert insights, price predictions, and analysis
Dive deep into the Gold (XAUUSD) price outlook for 2026 and beyond, combining technical analysis, expert forecasts, and key macroeconomic factors. It explains the drivers behind gold’s recent surge, explores potential scenarios including a move toward 4,500 to 5,000 USD per ounce, and highlights why the metal remains a strong hedge during global uncertainty.
Forecasts presented in this section only reflect the author’s private opinion and should not be considered as guidance for trading. RoboForex bears no responsibility for trading results based on trading recommendations described in these analytical reviews.