The dollar at a crossroads: how unemployment data and the Fed may affect USDJPY
The yen attempts to regain ground, with the USDJPY rate trading near the 158.45 level. Discover more in our analysis for 15 January 2026.
USDJPY forecast: key takeaways
- US initial jobless claims: previously at 208 thousand, projected at 225 thousand
- Continuing jobless claims: previously at 1.896 million, projected at 1.914 million
- USDJPY forecast for 15 January 2026: 160.00
Fundamental analysis
The forecast for 15 January 2026 appears optimistic for the USD. The USDJPY pair, having formed a corrective wave, is trading near the 158.45 level.
The main triggers influencing the USDJPY rate:
- Initial jobless claims in the US reflect the number of people filing claims for the first time during the previous week. This indicator assesses labour market conditions, and its increase signals rising unemployment. The previous value stood at 208 thousand. The USDJPY forecast for today looks less optimistic, as claims are expected to rise to 225 thousand. While the expected increase is moderate, actual data may differ significantly from the forecast, and such a deviation may have a noticeable impact on USD positions
- US continuing jobless claims may also increase compared with the previous period, with the forecast at 1.914 million
- The upcoming Federal Reserve interest rate decision could impact the USDJPY rate, while the easing of US monetary policy will contribute to JPY strengthening
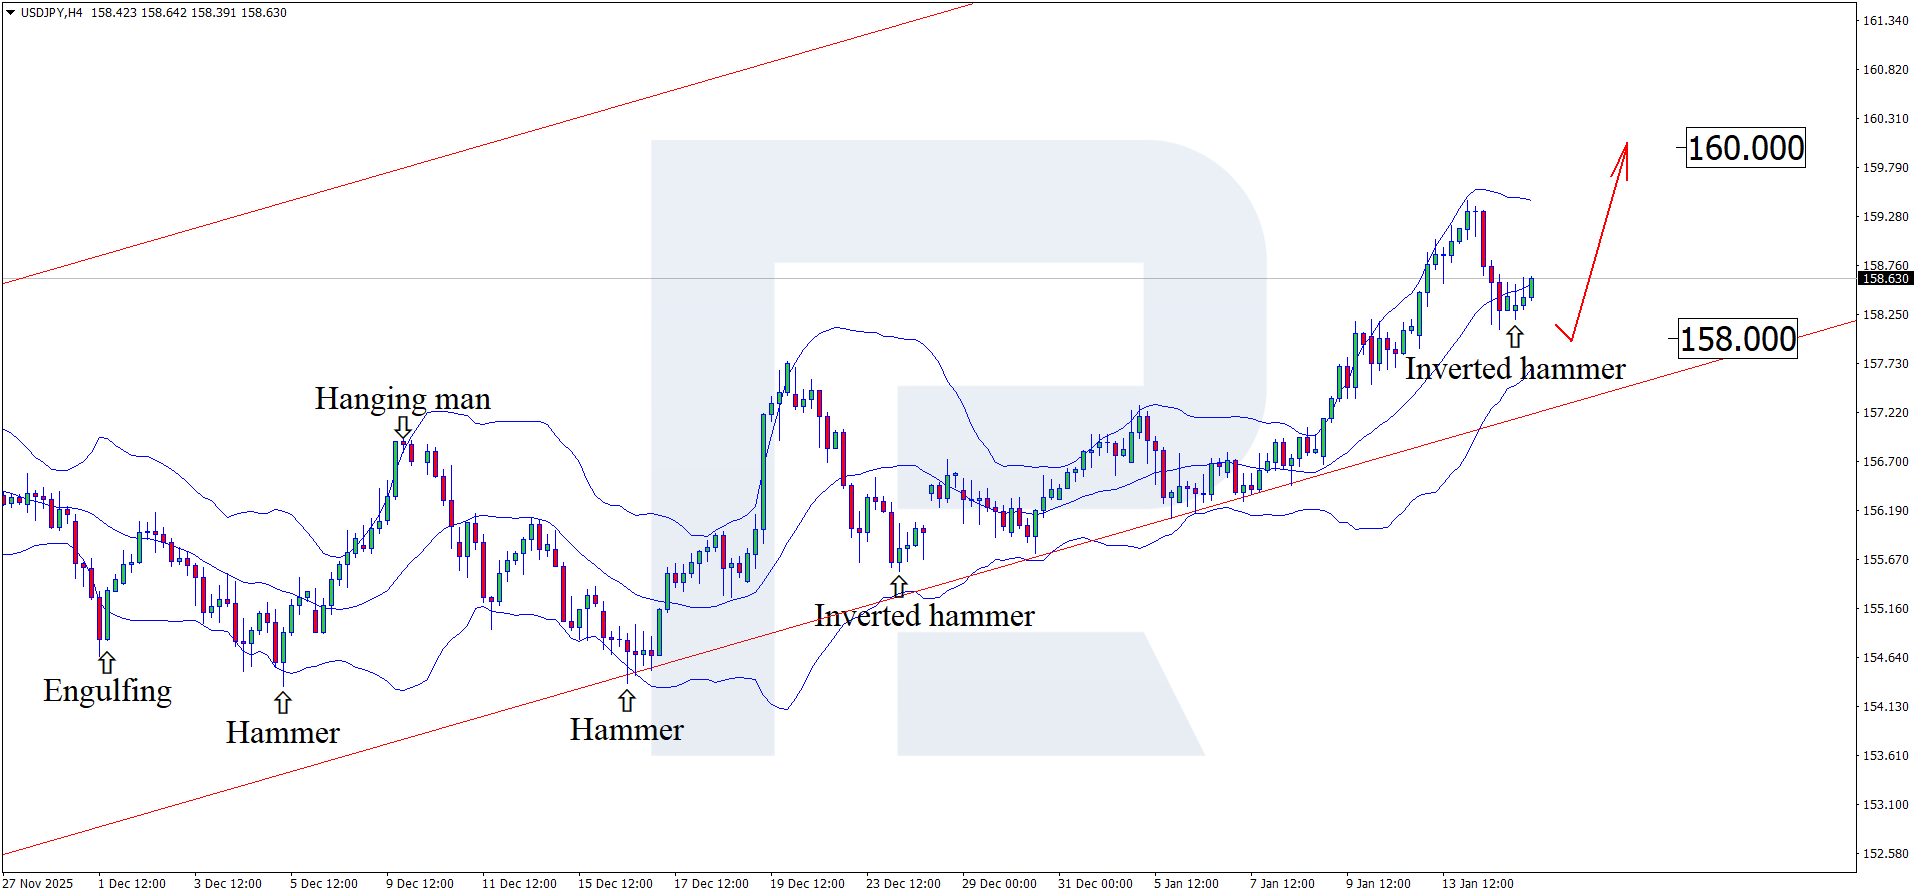
Technical outlook
On the H4 chart, the USDJPY pair has formed an Inverted Hammer reversal pattern near the lower Bollinger Band and is trading around 158.45. At this stage, it may continue an upward wave following the pattern signal, with the 160.00 level acting as an upside target in this scenario.
At the same time, the USDJPY forecast also considers an alternative scenario, with a decline towards the 158.00 level before growth resumes.
USDJPY overview
- Asset: USDJPY
- Timeframe: H4 (Intraday)
- Trend: Bullish
- Key resistance levels: 159.35 and 160.00
- Key support levels: 158.15 and 157.50
USDJPY trading scenarios for today
Main scenario (Buy Limit)
A correction towards the 158.40 level may indicate that conditions are forming for a long scenario.
The risk-to-reward ratio exceeds 1:5. Potential profit upon reaching the take-profit target amounts to 160 pips, while possible losses are limited to 30 pips.
- Buy Limit: 158.40
- Take Profit: 160.00
- Stop Loss: 158.10
Alternative scenario (Sell Stop)
Short positions are possible if the price breaks and consolidates below the 158.10 support level.
- Sell Stop: 158.00
- Take Profit: 157.10
- Stop Loss: 158.30
Risk factors
The main risk factor for the bullish scenario remains a weaker-than-expected US labour market report, which may weaken the US dollar.
Summary
US fundamental factors work against the USD, while USDJPY technical analysis suggests growth towards the 160.00 level.
Editors’ picks
 EURUSD 2026-2027 forecast: key market trends and future predictions
This article provides the EURUSD forecast for 2026 and 2027 and highlights the main factors determining the direction of the pair’s movements. We will apply technical analysis, take into account the opinions of leading experts, large banks, and financial institutions, and study AI-based forecasts. This comprehensive insight into EURUSD predictions should help investors and traders make informed decisions.
 Gold (XAUUSD) forecast 2026 and beyond: expert insights, price predictions, and analysis
Dive deep into the Gold (XAUUSD) price outlook for 2026 and beyond, combining technical analysis, expert forecasts, and key macroeconomic factors. It explains the drivers behind gold’s recent surge, explores potential scenarios including a move toward 4,500 to 5,000 USD per ounce, and highlights why the metal remains a strong hedge during global uncertainty.
Forecasts presented in this section only reflect the author’s private opinion and should not be considered as guidance for trading. RoboForex bears no responsibility for trading results based on trading recommendations described in these analytical reviews.