USDJPY at a two-week high: the rebound is progressing successfully
The USDJPY pair has risen to a two-week peak at 157.02. The market is awaiting political news and Japanese GDP data. Discover more in our analysis for 5 February 2026.
USDJPY forecast: key takeaways
- The USDJPY pair is extending its recovery after the late-January sell-off
- The market is tense and awaiting political news from Japan
- USDJPY forecast for 5 February 2026: 157.70 and 159.30
Fundamental analysis
The USDJPY pair is holding near 157.02 on Thursday. The yen is hovering close to its weakest levels in almost two weeks and has lost around 1% since the start of the week. This comes ahead of elections to the lower house of parliament, which will take place this weekend.
Japan’s ruling Liberal Democratic Party, led by Prime Minister Sanae Takaichi, is expected to strengthen its position as it seeks voter support for increased government spending and other economic policy priorities. Since Takaichi took office, Japanese government bonds and the yen have remained under pressure. The shift towards expansionary fiscal policy has heightened concerns about the country’s debt sustainability.
Markets are also awaiting the release of Japan’s Q4 GDP data next week. The forecast suggests an economic recovery after a sharp contraction in the previous quarter. Earlier, Takaichi stated that a weak yen could benefit exporters. She later clarified that her comments referred to the need to build an economy resilient to currency fluctuations.
At the end of January, the yen rose by nearly 4.5% amid speculation about a possible joint currency intervention by the US and Japan. Since then, it has lost more than half of those gains.
The USDJPY outlook is favourable.
Technical outlook
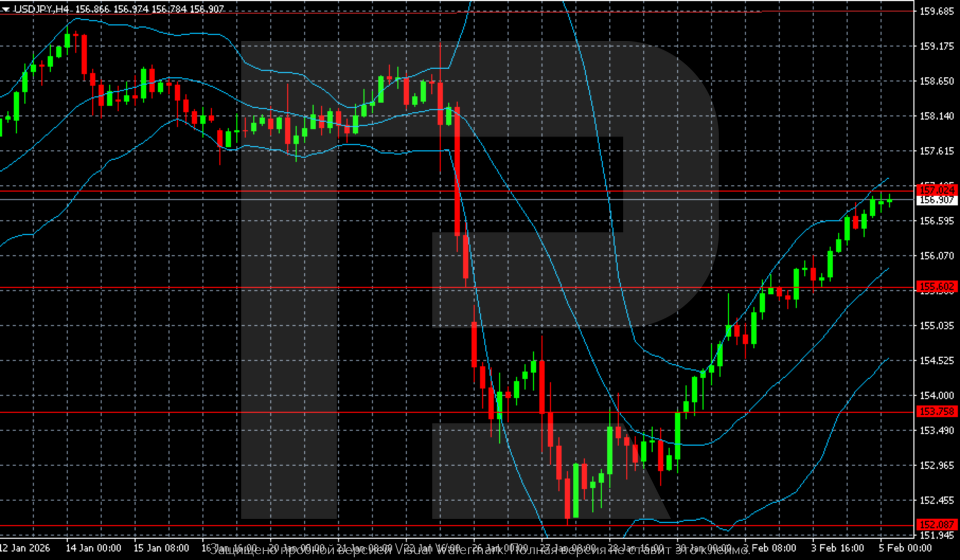
On the H4 chart, following the sharp sell-off in late January, the USDJPY pair formed a local bottom in the 152.0–152.2 area and has since shifted into a recovery phase. The rise is impulsive. The price has confidently returned within Bollinger Bands and is moving along their upper boundary, indicating buyer dominance.
Currently, quotes are testing the 156.8–157.1 zone. This area represents a key resistance level that previously acted as support. A consolidation above this range would open the way towards 158.5–159.0. In the event of a pullback, the nearest support level will shift to 155.6 and then to 153.7. Overall, the structure after the January sell-off appears to be recovering, but the pair has reached a technically sensitive zone.
USDJPY overview
- Asset: USDJPY
- Timeframe: H4 (Intraday)
- Trend: bullish
- Key resistance levels: 157.70 and 159.30
- Key support levels: 155.40 and 152.15
USDJPY trading scenarios for today
Main scenario (Buy Stop)
A consolidation above 157.70 will confirm a breakout above the key resistance zone and indicate a continuation of the recovery move after the January sell-off. In this case, focus shifts towards the upper target near 159.30.
The risk-to-reward ratio is around 1:4. The upside potential is about 160 pips with a risk of approximately 40 pips.
- Take Profit: 159.30
- Stop Loss: 157.30
Alternative scenario (Sell Stop)
A breakout and consolidation below the 155.40 support level would indicate weakening bullish momentum and increase the risk of a deeper correction after a failed upside attempt.
- Take Profit: 152.15
- Stop Loss: 156.00
Risk factors
Risks to further USDJPY gains include the upcoming elections in Japan and potential comments from authorities regarding the yen, which could increase volatility and demand for safe-haven assets. Additional pressure on the pair may come from expectations surrounding Japan’s Q4 GDP release if the data points to a stronger economic recovery. Technically, the 156.8–157.1 area remains a sensitive resistance zone, where corrective profit-taking is possible.
Summary
The USDJPY pair continues to recover from the January sell-off, but important political news from Japan lies ahead. The USDJPY forecast for today, 5 February 2026, does not rule out a move above 157.70, with a shift in focus towards 159.30.
Editors’ picks
 EURUSD 2026-2027 forecast: key market trends and future predictions
This article provides the EURUSD forecast for 2026 and 2027 and highlights the main factors determining the direction of the pair’s movements. We will apply technical analysis, take into account the opinions of leading experts, large banks, and financial institutions, and study AI-based forecasts. This comprehensive insight into EURUSD predictions should help investors and traders make informed decisions.
 Gold (XAUUSD) forecast 2026 and beyond: expert insights, price predictions, and analysis
Dive deep into the Gold (XAUUSD) price outlook for 2026 and beyond, combining technical analysis, expert forecasts, and key macroeconomic factors. It explains the drivers behind gold’s recent surge, explores potential scenarios including a move toward 4,500 to 5,000 USD per ounce, and highlights why the metal remains a strong hedge during global uncertainty.
Forecasts presented in this section only reflect the author’s private opinion and should not be considered as guidance for trading. RoboForex bears no responsibility for trading results based on trading recommendations described in these analytical reviews.