USDJPY rebounds after a four-day decline
The USDJPY rate is attempting a corrective recovery; however, fundamental factors create a mixed backdrop and limit confident upward movement. The price currently stands at 153.17. Find out more in our analysis for 13 February 2026.
USDJPY forecast: key takeaways
- Buyers are holding the 152.25 support level and preventing consolidation below this mark
- The Japanese government intends to stimulate economic growth without significantly increasing the debt burden
- Japan’s top currency diplomat stated that authorities are ready to respond to sharp exchange rate fluctuations
- USDJPY forecast for 13 February 2026: 151.25
Fundamental analysis
The USDJPY rate is recovering after declining for four consecutive trading sessions. Buyers are holding the 152.25 support level, preventing the price from consolidating below this mark. At the same time, selling pressure persists, limiting the upside potential.
The Japanese yen received additional support following statements by Prime Minister Sanae Takaichi. Her plans to expand fiscal policy are aimed at stimulating economic growth without excessively increasing the debt burden. The currency also benefited from verbal interventions. Japan’s top currency diplomat, Atsushi Mimura, emphasised that authorities remain on high alert to respond to sharp exchange rate fluctuations despite the recent strengthening of the yen.
Additional pressure on the US dollar came from comments by Federal Reserve Governor Stephen Miran. In his remarks, he stated that current monetary policy may be restraining US economic growth. According to him, interest rates may remain tighter than necessary, even taking into account fiscal support measures from the presidential administration, including tax cuts.
Technical outlook
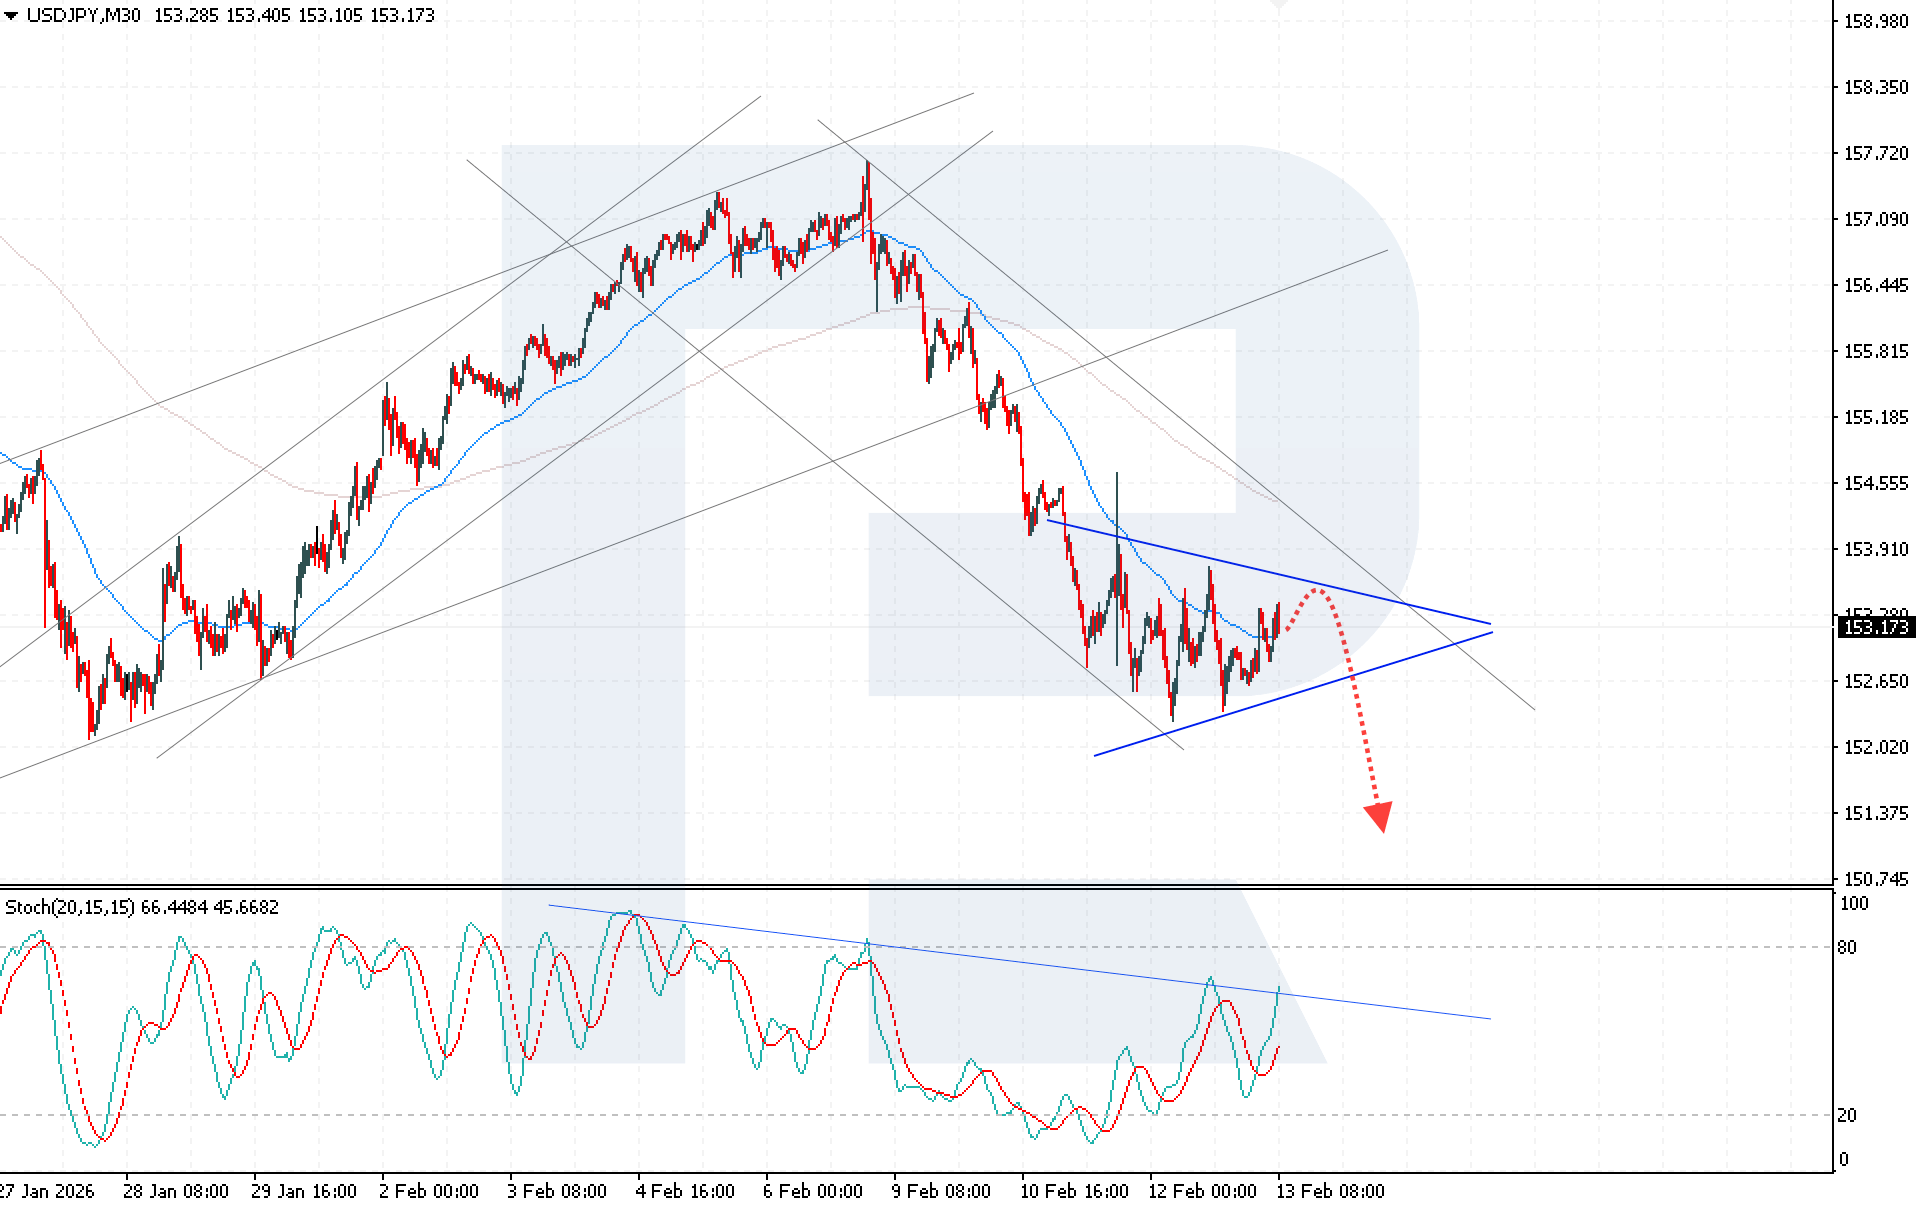
The USDJPY pair is developing a corrective move within a Triangle pattern. Sellers are keeping the price below the 152.65 resistance level, maintaining control over short-term dynamics.
Today’s USDJPY forecast suggests a rebound from the upper boundary of the Triangle pattern and a renewed decline towards 151.25. The technical picture indicates the formation of potential for a bearish scenario. The Stochastic Oscillator reinforces downside signals. The signal lines have reached the resistance zone, from which a downward reversal has previously occurred, increasing the likelihood of another wave of selling.
The key condition for the decline remains consolidation below 152.35. A breakout below this level would open the way for an exit below the lower boundary of the Triangle pattern and the implementation of the pattern with targets around 151.25 and lower.
USDJPY overview
- Asset: USDJPY
- Timeframe: M30 (Intraday)
- Trend: bearish
- Key resistance levels: 152.65 and 154.55
- Key support levels: 152.25 and 151.35
USDJPY trading scenarios for today
Main scenario (Sell Stop)
A breakout below the lower boundary of the Triangle pattern with consolidation below 152.35 will confirm the start of pattern implementation and create conditions for opening short positions. The risk-to-reward ratio exceeds 1:4. The potential profit upon reaching the take-profit level is approximately 110 pips, while possible losses are limited to 30 pips.
- Take Profit: 151.25
- Stop Loss: 152.65
Alternative scenario (Buy Stop)
Consolidation above the upper boundary of the Triangle pattern may trigger a bullish correction, and a breakout above the 156.70 resistance level will create opportunities for opening long positions.
- Take Profit: 155.40
- Stop Loss: 156.35
Risk factors
Risk factors for a decline in the USDJPY pair include buyers maintaining support at 152.25 and sellers’ inability to gain a foothold below 152.35, which may trigger a deeper upward correction. An additional risk to the bearish scenario is a potential easing of verbal interventions by Japanese authorities or a shift in Federal Reserve rhetoric that could support demand for the US dollar.
Summary
The fundamental backdrop for the USDJPY pair indicates continued elevated volatility and limited upside potential amid steady support for the yen and increasing pressure on the US dollar. At the same time, technical analysis of USDJPY confirms a high probability of a renewed decline towards 151.25 and below if quotes consolidate below 152.35.
Editors’ picks
 EURUSD 2026-2027 forecast: key market trends and future predictions
This article provides the EURUSD forecast for 2026 and 2027 and highlights the main factors determining the direction of the pair’s movements. We will apply technical analysis, take into account the opinions of leading experts, large banks, and financial institutions, and study AI-based forecasts. This comprehensive insight into EURUSD predictions should help investors and traders make informed decisions.
 Gold (XAUUSD) forecast 2026 and beyond: expert insights, price predictions, and analysis
Dive deep into the Gold (XAUUSD) price outlook for 2026 and beyond, combining technical analysis, expert forecasts, and key macroeconomic factors. It explains the drivers behind gold’s recent surge, explores potential scenarios including a move toward 4,500 to 5,000 USD per ounce, and highlights why the metal remains a strong hedge during global uncertainty.
Forecasts presented in this section only reflect the author’s private opinion and should not be considered as guidance for trading. RoboForex bears no responsibility for trading results based on trading recommendations described in these analytical reviews.