USDJPY tests resistance amid slowing momentum
The USDJPY rate maintains its upward momentum amid hawkish Federal Reserve rhetoric and US dollar resilience, despite strong macroeconomic data from Japan. The current quote is 155.09. Discover more in our analysis for 19 February 2026.
USDJPY forecast: key takeaways
- The Federal Reserve delivered more hawkish signals on monetary policy
- The minutes showed that some participants consider a rate hike possible if inflation remains elevated
- The market has revised expectations for the US rate path
- USDJPY forecast for 19 February 2026: 154.25
Fundamental analysis
The USDJPY rate is rising for the second consecutive trading session after breaking above the upper boundary of a consolidation channel. Buyers built up strong bullish momentum, but activity began to wane at 155.35, and the market encountered resistance.
The US dollar strengthened following unexpectedly hawkish signals from the Federal Reserve. The minutes of the latest meeting showed that several participants supported wording that leaves open the possibility of a rate hike if inflation remains above target. The market has revised expectations for the US monetary policy trajectory, boosting demand for the dollar.
At the same time, even strong macroeconomic data from Japan failed to support the yen. Machinery orders rebounded sharply in December after declining in November. The Reuters Tankan index for Japanese manufacturers rose to +13 in February 2026 from +7 in January, marking the first improvement in the past three months. The increase was driven by higher orders and a weaker yen.
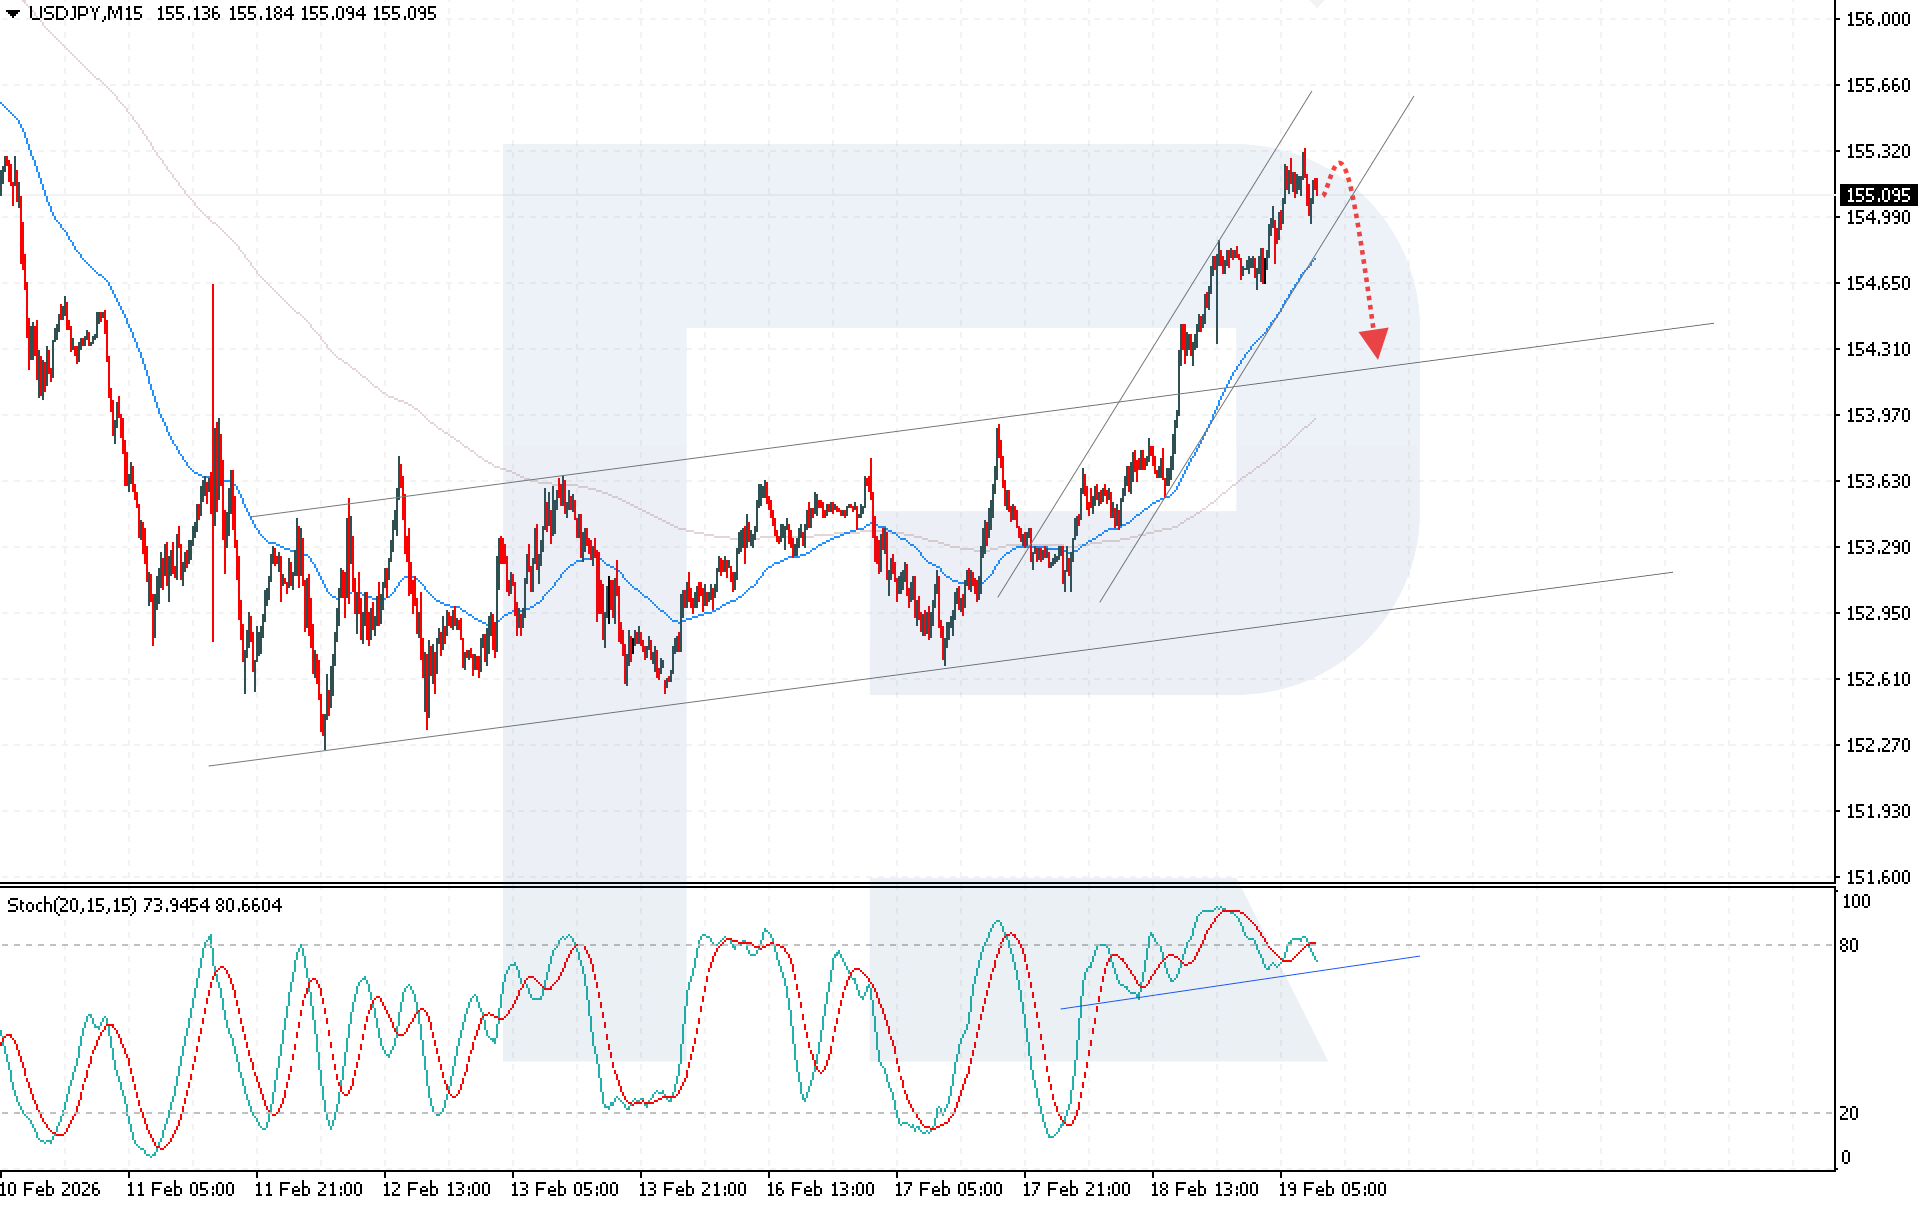
Technical outlook
Although the USDJPY pair continues to move within an ascending channel, signs of waning bullish momentum are emerging. Current dynamics indicate a gradual weakening of buying activity near the upper boundary of the range. A Head and Shoulders reversal pattern is forming on the Stochastic Oscillator, signalling a likely transition to a downward correction and the completion of the current upward wave. In addition, the indicator’s signal lines have exited overbought territory and formed a bearish crossover, increasing the risk of a decline. The USDJPY forecast for today suggests a renewed decline towards 154.25. A breakout below the lower boundary of the ascending channel, with the price consolidating below 154.65, will further confirm the bearish scenario. The alternative scenario will be activated if the price breaks above the local resistance level and consolidates above 155.45, opening the way for further growth.
USDJPY overview
- Asset: USDJPY
- Timeframe: M15 (Intraday)
- Trend: possible completion of bullish momentum
- Key resistance levels: 155.35 and 155.65
- Key support levels: 154.95 and 154.60
USDJPY trading scenarios for today
Main scenario (Sell Stop)
A breakout below 154.85 would indicate consolidation below the lower boundary of the ascending channel, creating conditions for opening short positions and increasing pressure on the pair. The risk-to-reward ratio is 1:2. The downside potential is about 60 pips with a risk of around 30 pips.
- Take Profit: 154.25
- Stop Loss: 155.15
Alternative scenario (Buy Stop)
The bullish scenario will be activated if the price breaks above the resistance level and consolidates above 155.45, opening the door for further growth.
- Take Profit: 156.75
- Stop Loss: 155.05
Risk factors
Risks to the downside scenario for USDJPY include continued hawkish Fed rhetoric, which may strengthen demand for the dollar and trigger new highs above 155.35. An additional invalidation factor for the bearish scenario would be a breakout and consolidation above the 155.45 resistance level, signalling continued buyer dominance and persistent upward momentum.
Summary
Hawkish Federal Reserve rhetoric continues to provide strong support to the US dollar, allowing the USDJPY pair to maintain its upward momentum despite noticeable improvements in Japan’s macroeconomic indicators. Technical analysis points to an increased probability of a corrective decline towards 154.25, provided that the price breaks and consolidates below the 154.65 support level.
Editors’ picks
 EURUSD 2026-2027 forecast: key market trends and future predictions
This article provides the EURUSD forecast for 2026 and 2027 and highlights the main factors determining the direction of the pair’s movements. We will apply technical analysis, take into account the opinions of leading experts, large banks, and financial institutions, and study AI-based forecasts. This comprehensive insight into EURUSD predictions should help investors and traders make informed decisions.
 Gold (XAUUSD) forecast 2026 and beyond: expert insights, price predictions, and analysis
Dive deep into the Gold (XAUUSD) price outlook for 2026 and beyond, combining technical analysis, expert forecasts, and key macroeconomic factors. It explains the drivers behind gold’s recent surge, explores potential scenarios including a move toward 4,500 to 5,000 USD per ounce, and highlights why the metal remains a strong hedge during global uncertainty.
Forecasts presented in this section only reflect the author’s private opinion and should not be considered as guidance for trading. RoboForex bears no responsibility for trading results based on trading recommendations described in these analytical reviews.