USDJPY: a pause amid strong movements
The USDJPY pair is correcting towards 157.23. Investors are monitoring developments in the energy market. Find out more in our analysis for 3 March 2026.
USDJPY forecast: key takeaways
- The USDJPY pair is slightly correcting but remains in a strong position
- Markets are focused on what the Bank of Japan governor will say today
- USDJPY forecast for 3 March 2026: 157.75
Fundamental analysis
On Tuesday, the USDJPY rate stood at 157.23. The yen is attempting to recover part of its recent losses. Earlier, pressure on the Japanese currency intensified due to rising energy prices amid escalating tensions in the Middle East, since Japan is heavily dependent on energy imports.
Finance Minister Satsuki Katayama stated that authorities are prepared to consider currency interventions to support the yen. According to her, the government is monitoring the weakening exchange rate and coordinating actions with the US.
Japan’s economy faces a dual challenge: weak growth on one hand and persistent inflation on the other. This complicates the policy path of the Bank of Japan. Deputy Governor Ryozo Himino confirmed the intention to continue raising interest rates but did not specify a timeline.
Investors are awaiting remarks from Bank of Japan Governor Kazuo Ueda later today for additional guidance.
Last week, the government nominated two academics advocating a dovish stance to the Bank of Japan’s board. Prime Minister Sanae Takaichi expressed concern over potential further rate hikes.
The outlook for USDJPY is positive.
Technical outlook
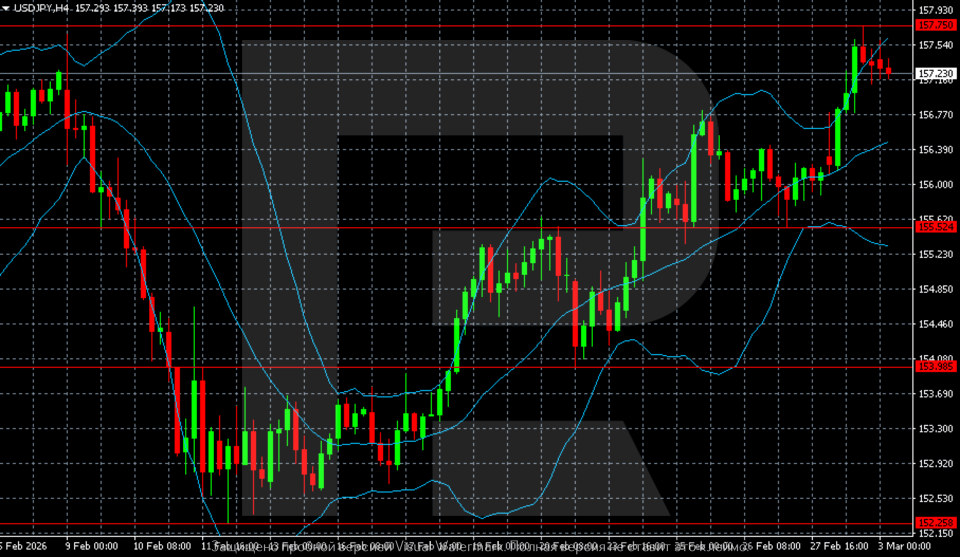
On the H4 chart, the USDJPY pair formed a low near 152.25–152.30 after a sharp decline in early February. From this zone, a steady upward reversal began. The rise was accompanied by expanding Bollinger Bands, indicating strengthening momentum and increasing volatility.
The pair then formed a sequence of higher lows and higher highs. Key levels at 153.98 and 155.52 were broken, accelerating the move. In late February, the price reached the 157.75 resistance level and tested the 157.70–157.90 area.
Currently, the pair is trading slightly below local highs, around 157.20–157.40. After the strong impulse, momentum has slowed: candlesticks are less directional, and short-term consolidation is forming below the 157.75 resistance level. Bollinger Bands remain wide but are beginning to flatten, suggesting a pause in growth.
The nearest support level lies at 155.52, followed by 153.98, with the key resistance level at 157.75. The overall H4 structure remains bullish; however, near the upper boundary of the range, the risk of a local correction or sideways movement increases before another attempt at growth.
USDJPY overview
- Asset: USDJPY
- Timeframe: H4 (Intraday)
- Trend: bullish
- Key resistance levels: 157.75 and 158.50
- Key support levels: 155.52 and 153.98
USDJPY trading scenarios for today
Main scenario (Buy Stop)
A breakout and consolidation above 157.75 would confirm continued upward momentum after a series of higher lows and highs and open the way towards 158.50. The potential move is about 75 pips with a risk of approximately 30–35 pips. The risk-to-reward ratio is close to 1:2.
- Take Profit: 158.50
- Stop Loss: 157.40
Alternative scenario (Sell Stop)
A consolidation below 155.52 would increase corrective pressure after testing the highs and create conditions for a decline towards 153.98.
- Take Profit: 153.98
- Stop Loss: 156.20
Risk factors
Risks to the bullish scenario include hawkish rhetoric from the Bank of Japan or currency interventions by authorities. Energy price dynamics and Fed rate expectations will also influence the pair: a weaker US dollar could correct USDJPY’s upward movement.
Summary
The USDJPY pair has strengthened significantly and is now pausing for a correction. The forecast for 3 March 2026 suggests continued growth towards 157.75.
Editors’ picks
 EURUSD 2026-2027 forecast: key market trends and future predictions
This article provides the EURUSD forecast for 2026 and 2027 and highlights the main factors determining the direction of the pair’s movements. We will apply technical analysis, take into account the opinions of leading experts, large banks, and financial institutions, and study AI-based forecasts. This comprehensive insight into EURUSD predictions should help investors and traders make informed decisions.
 Gold (XAUUSD) forecast 2026 and beyond: expert insights, price predictions, and analysis
Dive deep into the Gold (XAUUSD) price outlook for 2026 and beyond, combining technical analysis, expert forecasts, and key macroeconomic factors. It explains the drivers behind gold’s recent surge, explores potential scenarios including a move toward 4,500 to 5,000 USD per ounce, and highlights why the metal remains a strong hedge during global uncertainty.
Forecasts presented in this section only reflect the author’s private opinion and should not be considered as guidance for trading. RoboForex bears no responsibility for trading results based on trading recommendations described in these analytical reviews.