USDJPY rises for the third week: the Middle East factor remains in play
The USDJPY pair is hovering near 157.48, with the yen under pressure from the strong US dollar. Find out more in our analysis for 6 March 2026.
USDJPY forecast: key takeaways
- The USDJPY pair will resume growth after a local pause
- The strong US dollar and the Middle East factor continue to drive the yen
- USDJPY forecast for 6 March 2026: 157.95
Fundamental analysis
The USDJPY rate slipped to 157.48 at the end of the first week of March. Despite the pause, the yen is ending its third consecutive week in negative territory. The currency remains under pressure from a stronger US dollar, which is in demand as a safe-haven asset amid the escalation of the Middle East conflict.
The US and Israel’s military operation against Iran has entered its seventh day. Tehran responded with a new wave of missile and drone strikes against countries in the Persian Gulf.
Rising oil prices have added to pressure on the yen. Japan is heavily dependent on imports of energy resources from the Middle East, so higher energy costs increase risks to the economy.
Bank of Japan Governor Kazuo Ueda said the conflict could significantly affect the country’s economy, raising the likelihood that the current interest rate policy will remain in place for longer.
At the same time, Japan’s Finance Minister Satsuki Katayama stressed that currency intervention remains a possible tool to support the yen. According to her, the authorities are closely monitoring the currency’s weakness and coordinating actions with the US.
The USDJPY outlook is positive.
Technical outlook
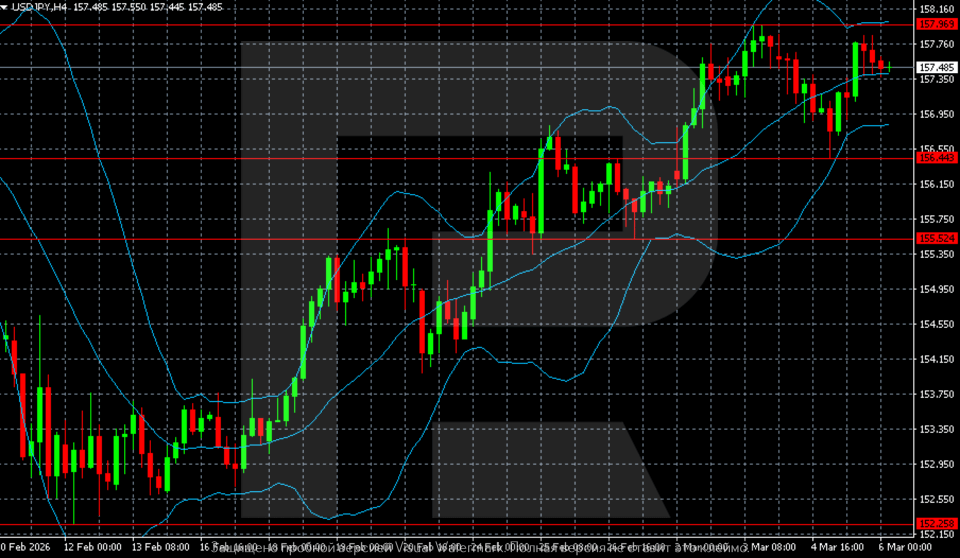
On the H4 chart, the USDJPY pair retains an upward structure after a reversal in mid-February.
After forming a low near 152.25, the pair began a steady rise. The price has formed a series of higher lows and higher highs, indicating the development of an uptrend. The move was accompanied by expanding Bollinger Bands, confirming strengthening momentum and rising volatility.
In late February, quotes broke through the key levels of 155.52 and 156.44, after which the rally accelerated and the pair reached the 157.90–158.10 area, where the nearest strong resistance is located. A local correction started from this zone.
The price is now hovering around 157.48, slightly below the upper boundary of the recent range. After a sharp surge, the market shifted into a phase of short-term consolidation. Bollinger Bands are starting to flatten, which may indicate a pause in the move.
The nearest support level lies around 156.44, with the next one at 155.52. The key resistance level remains in the 157.95–158.10 zone. As long as quotes hold above 156.44, the overall H4 structure remains bullish, and the current dynamics look like a correction before a possible new attempt at growth.
USDJPY overview
- Asset: USDJPY
- Timeframe: H4 (Intraday)
- Trend: bullish
- Key resistance levels: 157.95 and 158.10
- Key support levels: 156.44 and 155.52
USDJPY trading scenarios for today
Main scenario (Buy Stop)
A breakout and consolidation above 157.95 would confirm the end of the consolidation phase and create conditions for a continued upward move. The rally is supported by a strong dollar and demand for safe-haven assets amid the Middle East conflict. The upside potential is about 100–120 pips with a risk of around 50–60 pips. The risk-to-reward ratio is close to 1:2.
- Take Profit: 158.90
- Stop Loss: 156.90
Alternative scenario (Sell Stop)
Consolidation below 156.44 would increase corrective pressure and may trigger a test of a deeper support level.
- Take Profit: 155.52
- Stop Loss: 157.30
Risk factors
A risk to further USDJPY growth remains increased expectations of BoJ tightening or currency intervention by the authorities. Easing geopolitical tensions would add to pressure, reducing demand for the dollar as a safe-haven asset.
Summary
The USDJPY pair has paused its rise, but this is a local pause. The USDJPY forecast for today, 6 March 2026, suggests a return to the upside target of 157.95.
Editors’ picks
 EURUSD 2026-2027 forecast: key market trends and future predictions
This article provides the EURUSD forecast for 2026 and 2027 and highlights the main factors determining the direction of the pair’s movements. We will apply technical analysis, take into account the opinions of leading experts, large banks, and financial institutions, and study AI-based forecasts. This comprehensive insight into EURUSD predictions should help investors and traders make informed decisions.
 Gold (XAUUSD) forecast 2026 and beyond: expert insights, price predictions, and analysis
Dive deep into the Gold (XAUUSD) price outlook for 2026 and beyond, combining technical analysis, expert forecasts, and key macroeconomic factors. It explains the drivers behind gold’s recent surge, explores potential scenarios including a move toward 4,500 to 5,000 USD per ounce, and highlights why the metal remains a strong hedge during global uncertainty.
Forecasts presented in this section only reflect the author’s private opinion and should not be considered as guidance for trading. RoboForex bears no responsibility for trading results based on trading recommendations described in these analytical reviews.