USDJPY rises amid higher oil prices and shifting expectations for Fed rates
The USDJPY pair is strengthening, with the Japanese yen under increasing pressure from oil price spikes and revised expectations for US monetary policy. The rate currently stands at 159.40. Find out more in our analysis for 13 March 2026.
USDJPY forecast: key takeaways
- The Japanese yen has fallen to its weakest levels since mid-2024
- The weakening of the national currency increases the risk of possible currency interventions by Japanese authorities
- Market participants are revising expectations regarding Federal Reserve policy, supporting USDJPY gains
- USDJPY forecast for 13 March 2026: 160.35
Fundamental analysis
The USDJPY rate continues its confident advance for the fourth consecutive trading session. As a result, the Japanese yen has slipped to its weakest levels since mid-2024. Such performance traditionally makes market participants more cautious, since a rapid weakening of the national currency increases the likelihood of currency intervention by Japanese authorities.
Additional pressure on the yen comes from a sharp rise in oil prices. Energy quotes jumped after Iran’s new Supreme Leader stated an intention to effectively block the Strait of Hormuz, one of the key routes for global oil trade. At the same time, Tehran stepped up attacks on oil and transport facilities in the region. The escalation of geopolitical tensions in the Middle East increases the risk of supply disruptions, supporting further gains in oil prices.
Higher oil prices intensify fears of accelerating global inflation and, at the same time, shift investors’ expectations for the Federal Reserve’s future policy path. Market participants have started to reassess the timing of possible rate cuts. While investors had previously expected the first easing step as early as June, the baseline scenario now suggests this move will be postponed to September.
Technical outlook
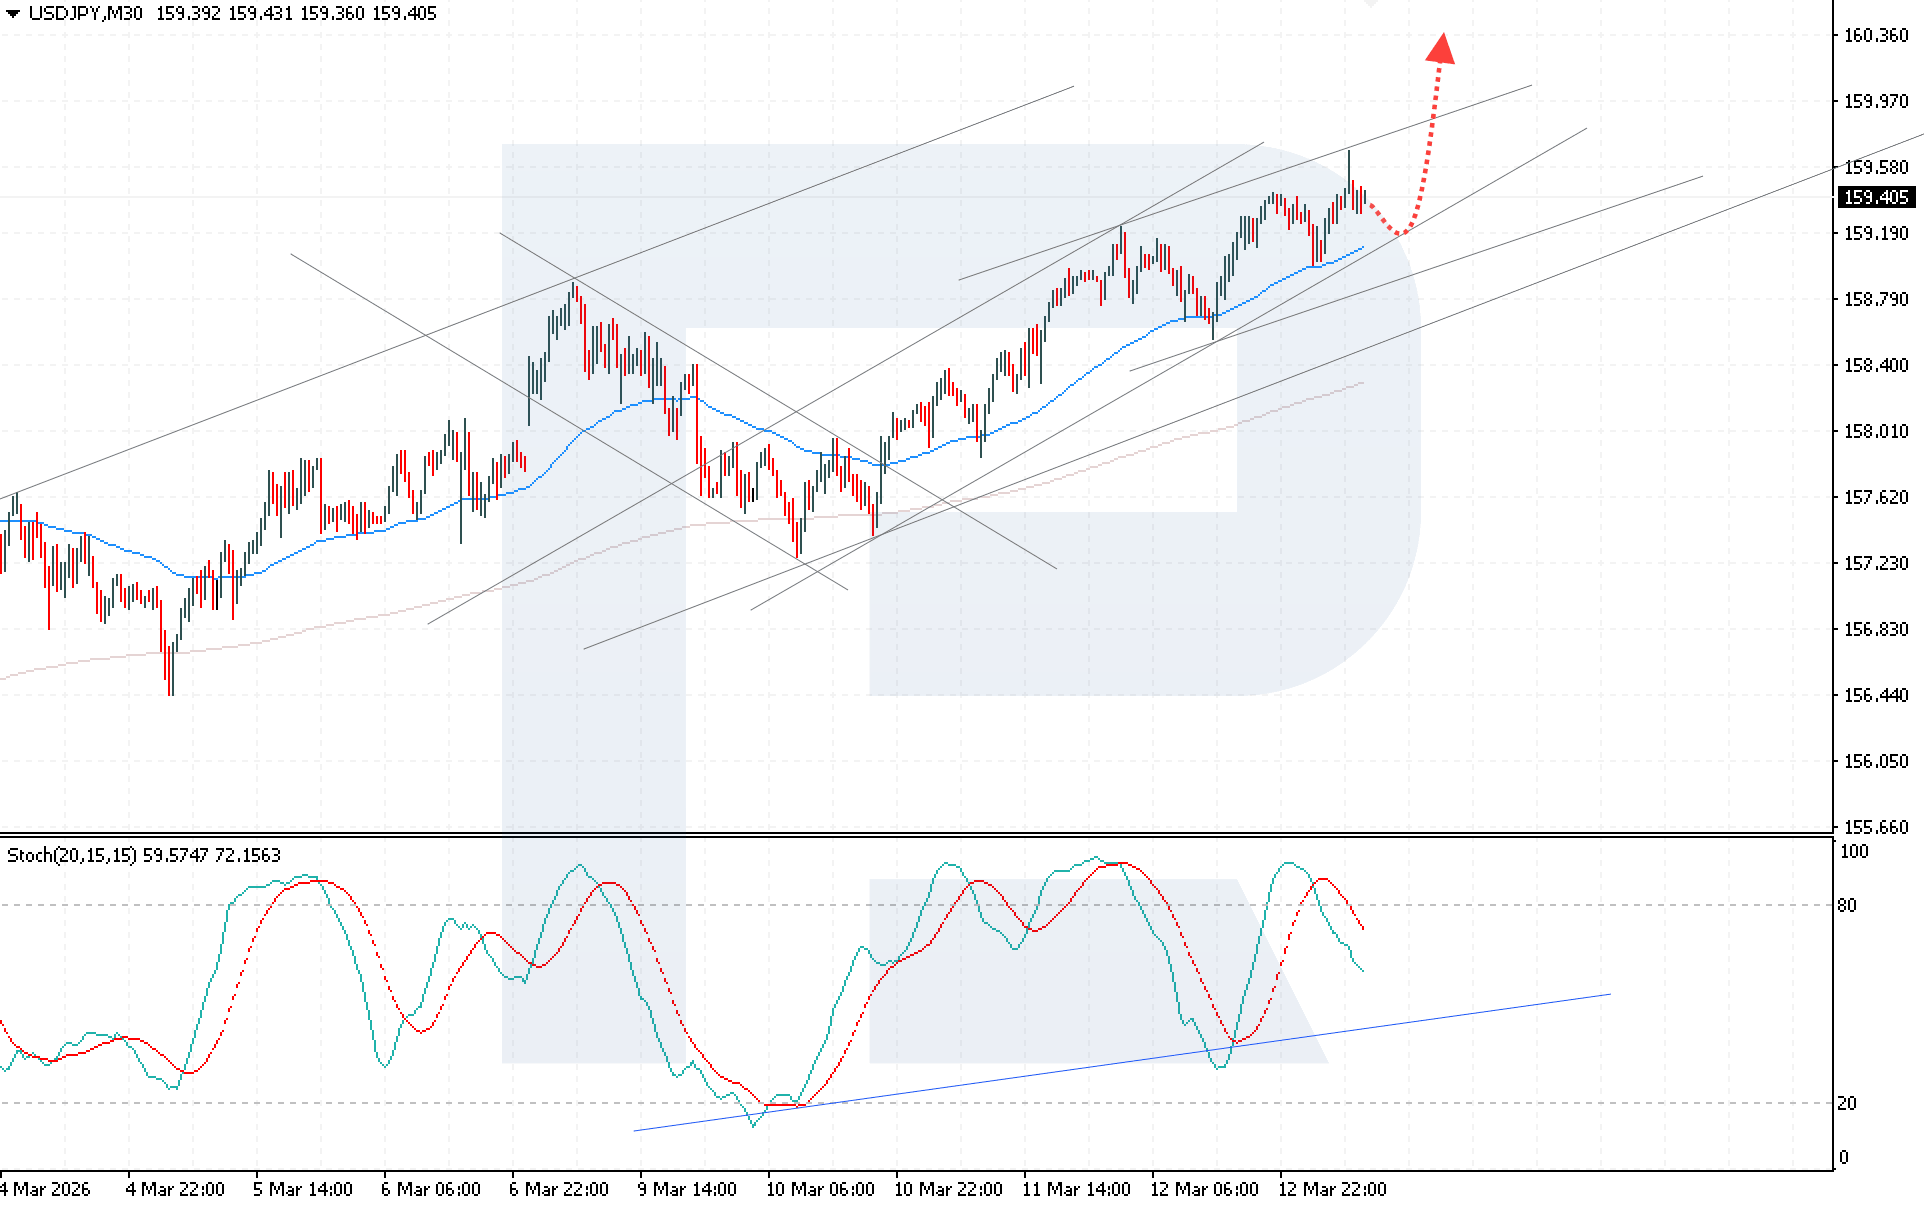
The USDJPY rate continues to move within an ascending channel, with buyers holding the price above the EMA-65, indicating persistent bullish pressure. Today’s USDJPY forecast suggests another attempt to extend the rally towards 160.35.
The technical setup still favours buyers. The Stochastic Oscillator is exiting overbought territory and starting to decline, which may indicate a local correction before a new bullish momentum develops. A confident breakout above the upper boundary of the ascending channel, with the price consolidating above 159.95, will further confirm the main scenario. Such a signal would reinforce the bullish bias and open the way for further upside.
An alternative scenario suggests a breakout below the lower boundary of the ascending channel and a consolidation below 159.05. This scenario would indicate weakening buying pressure and increase the likelihood of a deeper correction towards 158.45 and lower.
USDJPY overview
- Asset: USDJPY
- Timeframe: M30 (Intraday)
- Trend: bullish
- Key resistance levels: 159.60 and 160.35
- Key support levels: 159.05 and 158.35
USDJPY trading scenarios for today
Main scenario (Buy Limit)
A rebound from the lower boundary of the bullish channel at 159.20 would confirm renewed upward momentum and create conditions for opening long positions. The upside potential is about 115 pips with a risk of around 40 pips. The risk-to-reward ratio exceeds 1:2.
- Take Profit: 160.35
- Stop Loss: 158.80
Alternative scenario (Sell Stop)
A breakout below the lower boundary of the bullish channel and a consolidation below 159.05 may serve as a signal for a short-term correction.
- Take Profit: 158.65
- Stop Loss: 159.55
Risk factors
A key risk for further USDJPY upside is a possible currency intervention by Japanese authorities if the yen weakens sharply further. Additional pressure on the pair could come from a decline in oil prices or a shift in market expectations towards an earlier Federal Reserve rate cut.
Summary
A combination of factors, such as yen weakness, rising oil prices, heightened geopolitical risks, and revised expectations for Federal Reserve policy, provides solid support for continued USDJPY gains. The USDJPY forecast indicates a sustained upward momentum, with a likely test of 160.35, as long as the price holds above the 159.05 support level and the EMA-65.
Editors’ picks
 EURUSD 2026-2027 forecast: key market trends and future predictions
This article provides the EURUSD forecast for 2026 and 2027 and highlights the main factors determining the direction of the pair’s movements. We will apply technical analysis, take into account the opinions of leading experts, large banks, and financial institutions, and study AI-based forecasts. This comprehensive insight into EURUSD predictions should help investors and traders make informed decisions.
 Gold (XAUUSD) forecast 2026 and beyond: expert insights, price predictions, and analysis
Dive deep into the Gold (XAUUSD) price outlook for 2026 and beyond, combining technical analysis, expert forecasts, and key macroeconomic factors. It explains the drivers behind gold’s recent surge, explores potential scenarios including a move toward 4,500 to 5,000 USD per ounce, and highlights why the metal remains a strong hedge during global uncertainty.
Forecasts presented in this section only reflect the author’s private opinion and should not be considered as guidance for trading. RoboForex bears no responsibility for trading results based on trading recommendations described in these analytical reviews.