Market on edge: how the ADP report and Japan’s rhetoric could shift USDJPY in the coming days
The BoJ is on the verge of intervention, the Federal Reserve may keep interest rates unchanged, and the USDJPY pair is testing 159.20. Find out more in our analysis for 17 March 2026.
USDJPY forecast: key takeaways
- Weekly US employment change (ADP): previously at 15.5 thousand
- The BoJ is on the verge of intervention
- The market is awaiting meetings of the Fed and the BoJ
- USDJPY forecast for 17 March 2026: 160.00
Fundamental analysis
The forecast for 17 March 2026 appears optimistic for the USD: after a correction, the USDJPY pair is forming an upward wave and may continue to rise. At the moment, the pair is trading around 159.20.
The weekly ADP report provides an overview of employment trends in the private sector, offering up-to-date labour market insights based on regular ADP updates. These figures can be viewed as a preliminary indicator of the Nonfarm Payrolls report published by the Bureau of Labor Statistics. Released by Automatic Data Processing Inc., the report represents a four-week moving average and reflects changes in private sector employment in the US. Typically, a higher reading supports consumer spending and stimulates economic activity. Therefore, strong figures are traditionally interpreted as a bullish signal for the US dollar, while weak figures are considered bearish.
Since the indicator has increased over the last four reporting periods, a further rise is possible. Data above the previous reading would become a trigger for the USDJPY pair to move towards 160.00.
Verbal intervention against the bears: Japan’s Finance Minister Katayama once again used heavy rhetorical artillery, calling the current yen weakening inconsistent with fundamentals. The market is holding its breath ahead of decisive action, turning the 160.00 level into a true psychological (and potentially tactical) line of defence for Tokyo.
Simultaneous meetings of the ‘Big Two’: the market is frozen ahead of the Federal Reserve meeting due on Wednesday and the BoJ meeting scheduled for Thursday. The Fed is expected to keep the rate at 3.75%, but inflationary pressure from higher oil prices due to the Iran conflict could change the decision. Japan’s central bank will likely hold the rate steady at 0.75%, but any hints of tightening in April could immediately strengthen the yen.
Technical outlook
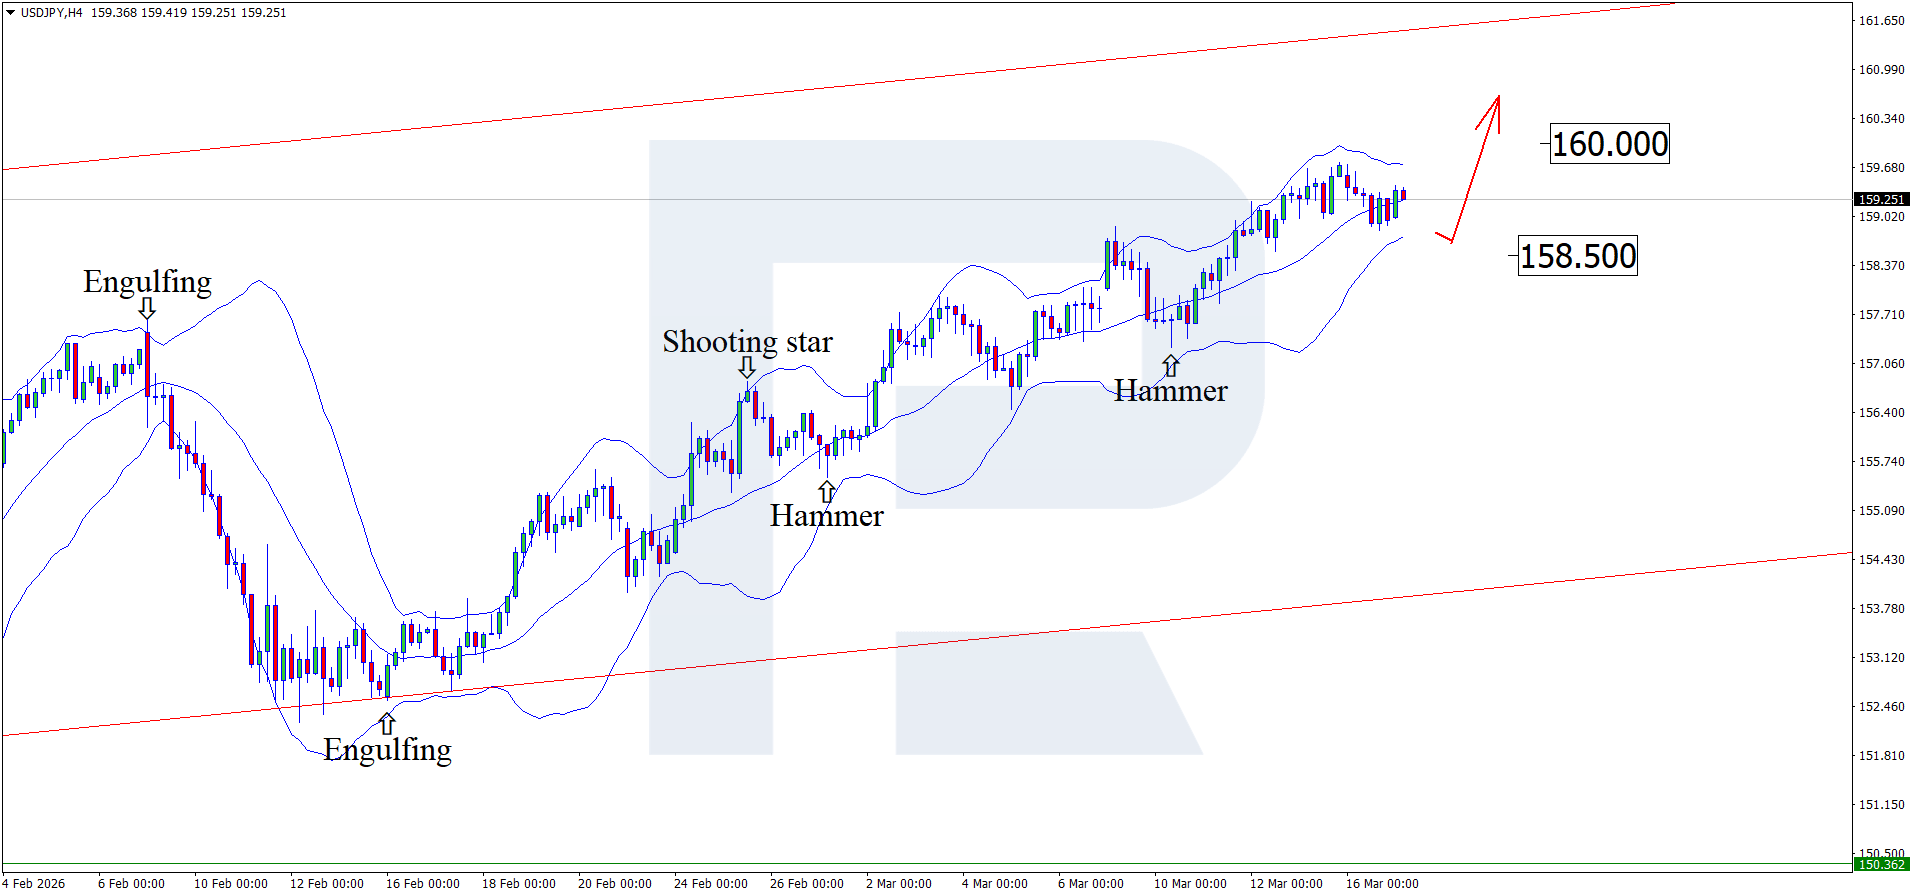
On the H4 chart, the USDJPY pair formed a Hammer reversal pattern near the lower Bollinger Band and is trading around 159.20. At this stage, it may continue its upward trajectory as the pattern’s signal plays out, with the upside target at 160.00.
At the same time, today’s USDJPY forecast also considers an alternative scenario: the price may form a corrective wave and test the 158.50 support level before growth.
USDJPY overview
- Asset: USDJPY
- Timeframe: H4 (Intraday)
- Trend: bullish
- Key resistance levels: 159.70 and 160.00
- Key support levels: 158.50 and 157.60
USDJPY trading scenarios for today
Main scenario (Buy Limit)
A rebound from the support level around 158.50 would confirm continued upward momentum that has been forming since mid-February. The pair remains in an uptrend, hovering near the middle Bollinger Band. The upside potential is aimed at the psychological level of 160.00.
The upside potential is about 150 pips with a risk of roughly 50 pips, resulting in a risk-to-reward ratio of about 1:3.
- Take Profit: 160.00
- Stop Loss: 158.00
Alternative scenario (Sell Stop)
A breakout below 158.50 may signal a short-term correction after the prolonged rise.
- Take Profit: 157.60
- Stop Loss: 159.00
Risk factors
A key risk to further USDJPY upside remains a possible currency intervention by Japanese authorities as the pair approaches 160.00. Additional support for the dollar comes from higher oil prices and geopolitical tensions related to the Iran conflict, which increases pressure on Japan’s economy as a major energy importer.
Summary
The yen continues to lose ground against the USD ahead of the upcoming interest rate decisions from the Fed and the BoJ.
Editors’ picks
 EURUSD 2026-2027 forecast: key market trends and future predictions
This article provides the EURUSD forecast for 2026 and 2027 and highlights the main factors determining the direction of the pair’s movements. We will apply technical analysis, take into account the opinions of leading experts, large banks, and financial institutions, and study AI-based forecasts. This comprehensive insight into EURUSD predictions should help investors and traders make informed decisions.
 Gold (XAUUSD) forecast 2026 and beyond: expert insights, price predictions, and analysis
Dive deep into the Gold (XAUUSD) price outlook for 2026 and beyond, combining technical analysis, expert forecasts, and key macroeconomic factors. It explains the drivers behind gold’s recent surge, explores potential scenarios including a move toward 4,500 to 5,000 USD per ounce, and highlights why the metal remains a strong hedge during global uncertainty.
Forecasts presented in this section only reflect the author’s private opinion and should not be considered as guidance for trading. RoboForex bears no responsibility for trading results based on trading recommendations described in these analytical reviews.