Sellers are increasing pressure on USDJPY amid news from the Middle East
The USDJPY pair is declining steadily amid a weakening dollar and rising demand for safe-haven assets, with the rate currently at 158.18. Discover more in our analysis for 8 April 2026.
USDJPY forecast: key takeaways
- Easing geopolitical tensions are putting pressure on the US dollar
- Donald Trump postpones strikes on Iranian infrastructure
- The market ignores weak Japanese macroeconomic data
- USDJPY forecast for 8 April 2026: 155.90
Fundamental analysis
The USDJPY rate is declining aggressively, with sellers increasing their activity and seeking to gain a foothold below the crucial 158.25 support level. The US currency is weakening amid easing geopolitical risks. Washington, Tehran, and Tel Aviv agreed on a two-week pause in hostilities for talks on a potential peaceful settlement. Donald Trump decided to postpone strikes on Iranian civilian infrastructure, describing the current situation as a mutual ceasefire. For its part, Iran confirmed its intention to resume shipping through the Strait of Hormuz.
An additional factor supporting the Japanese yen came from growing expectations of possible currency intervention by the BoJ. Japanese officials are stepping up their criticism of the excessive weakness of the national currency. In addition, market participants are pricing in the likelihood of an imminent rate hike by the Bank of Japan.
Even unfavourable macroeconomic data from Japan is not putting significant pressure on the yen. Thus, the Economy Watchers Index for Current Conditions fell to 42.2 points in March 2026 from 48.9 in February, significantly worse than the forecast of 48.0 and matching the lowest levels since February 2022. The forecast for the Japan Economy Watchers Index for Future Conditions also declined, from 50.0 to 38.7 points, reaching the lowest level since December 2020 and reflecting growing pessimism about the prospects for recovery in the Japanese economy.
Technical outlook
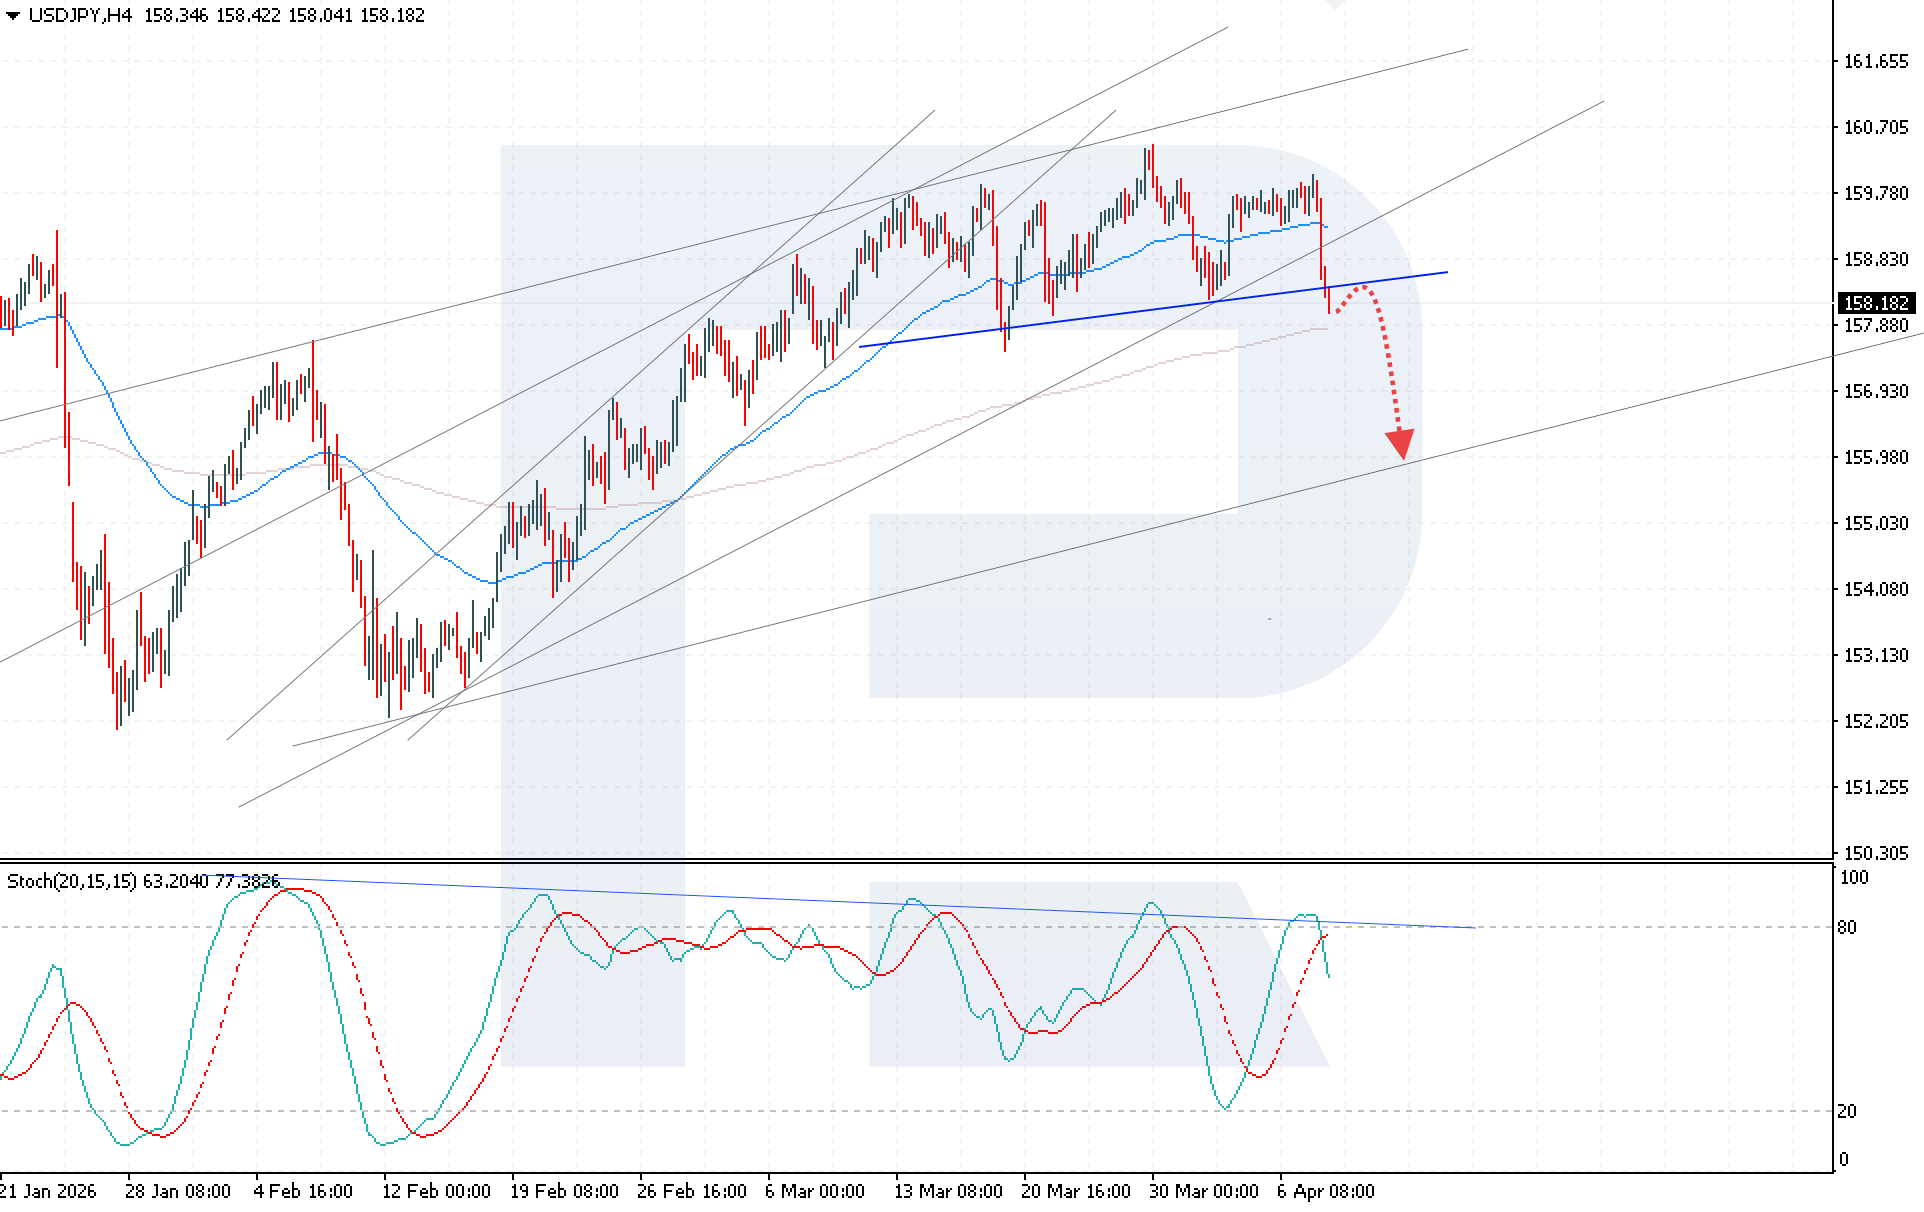
USDJPY quotes continue to decline, while sellers are increasing pressure and seeking to consolidate below the neckline of a Head and Shoulders reversal pattern, indicating a high probability of the bearish scenario with lower targets.
The technical picture remains bearish. The Stochastic Oscillator is rebounding from the descending resistance line and is forming a bearish crossover, increasing the probability of a new downward momentum. An additional signal comes from the indicator’s exit from overbought territory, which confirms weakening buying pressure. A breakout of the EMA-285 with price consolidation below 157.55 will confirm continued downward movement.
An alternative scenario suggests renewed growth if the price returns above the neckline and consolidates above 158.80, opening the way for a deeper upward correction.
USDJPY overview
- Asset: USDJPY
- Timeframe: H4 (Intraday)
- Trend: upward with signs of completion
- Key resistance levels: 158.25 and 159.05
- Key support levels: 157.85 and 156.75
USDJPY trading scenarios for today
Main scenario (Sell Stop)
Consolidation below 158.00 would indicate stronger pressure from bears and renewed downward momentum.
- Take Profit: 155.90
- Stop Loss: 158.50
Alternative scenario (Buy Stop)
A breakout above the 158.80 level would indicate a return of prices above the 158.25 key support level and trigger a bullish correction.
- Take Profit: 159.80
- Stop Loss: 158.15
Risk factors
The risks to the USDJPY downside scenario are associated with a possible escalation of geopolitical tensions, which may restore demand for the US dollar as a safe-haven asset and push the pair higher. An additional risk factor will be the market abandoning expectations of tighter BoJ policy or the lack of confirmation of a breakout of key technical levels, leading to an upward correction.
Summary
The dominance of the geopolitical factor and expectations of tighter Bank of Japan policy are creating sustained pressure on the USDJPY rate and creating conditions for a further decline below 158.25. USDJPY technical analysis indicates a bearish scenario and a high probability of a decline towards the 155.90 level.
Editors’ picks
 EURUSD 2026-2027 forecast: key market trends and future predictions
This article provides the EURUSD forecast for 2026 and 2027 and highlights the main factors determining the direction of the pair’s movements. We will apply technical analysis, take into account the opinions of leading experts, large banks, and financial institutions, and study AI-based forecasts. This comprehensive insight into EURUSD predictions should help investors and traders make informed decisions.
 Gold (XAUUSD) forecast 2026 and beyond: expert insights, price predictions, and analysis
Dive deep into the Gold (XAUUSD) price outlook for 2026 and beyond, combining technical analysis, expert forecasts, and key macroeconomic factors. It explains the drivers behind gold’s recent surge, explores potential scenarios including a move toward 4,500 to 5,000 USD per ounce, and highlights why the metal remains a strong hedge during global uncertainty.
Forecasts presented in this section only reflect the author’s private opinion and should not be considered as guidance for trading. RoboForex bears no responsibility for trading results based on trading recommendations described in these analytical reviews.