USDJPY rises despite BoJ signals and intervention risks
Rising geopolitical tensions and the jump in oil prices add to pressure on the yen, pushing the USDJPY rate towards key levels. The rate currently stands at 159.63. Discover more in our analysis for 29 April 2026.
USDJPY forecast: key takeaways
- The USDJPY pair is rising for the second consecutive trading session
- Finance Minister Satsuki Katayama stated that the authorities are ready for currency interventions
- The Federal Reserve is expected to keep interest rates unchanged
- USDJPY forecast for 29 April 2026: 161.65
Fundamental analysis
The USDJPY rate has been on the rise for the second consecutive trading session. Buyers are repeatedly hitting the 159.80 level, a key resistance that is still preventing the market from shifting to a full-fledged rise.
On Tuesday, the Bank of Japan predictably left the interest rate at 0.75%. However, the regulator revised its forecasts: inflation is now expected to be higher, while growth for fiscal 2026 has, on the contrary, been lowered, taking into account the consequences of the conflict in the Middle East. Three out of nine members of the Board have already spoken in favour of a rate hike. This is a signal of growing concern within the regulator over inflationary pressures related to the war with Iran. Moreover, Finance Minister Satsuki Katayama confirmed that the authorities are ready to intervene in the currency market at any moment if the situation requires support for the yen.
Meanwhile, the Federal Reserve is also expected to hold rates steady. But this is not bringing calm to the markets. Traders will focus on the regulator’s rhetoric and its assessment of the consequences of the escalation in the Middle East for the US economy.
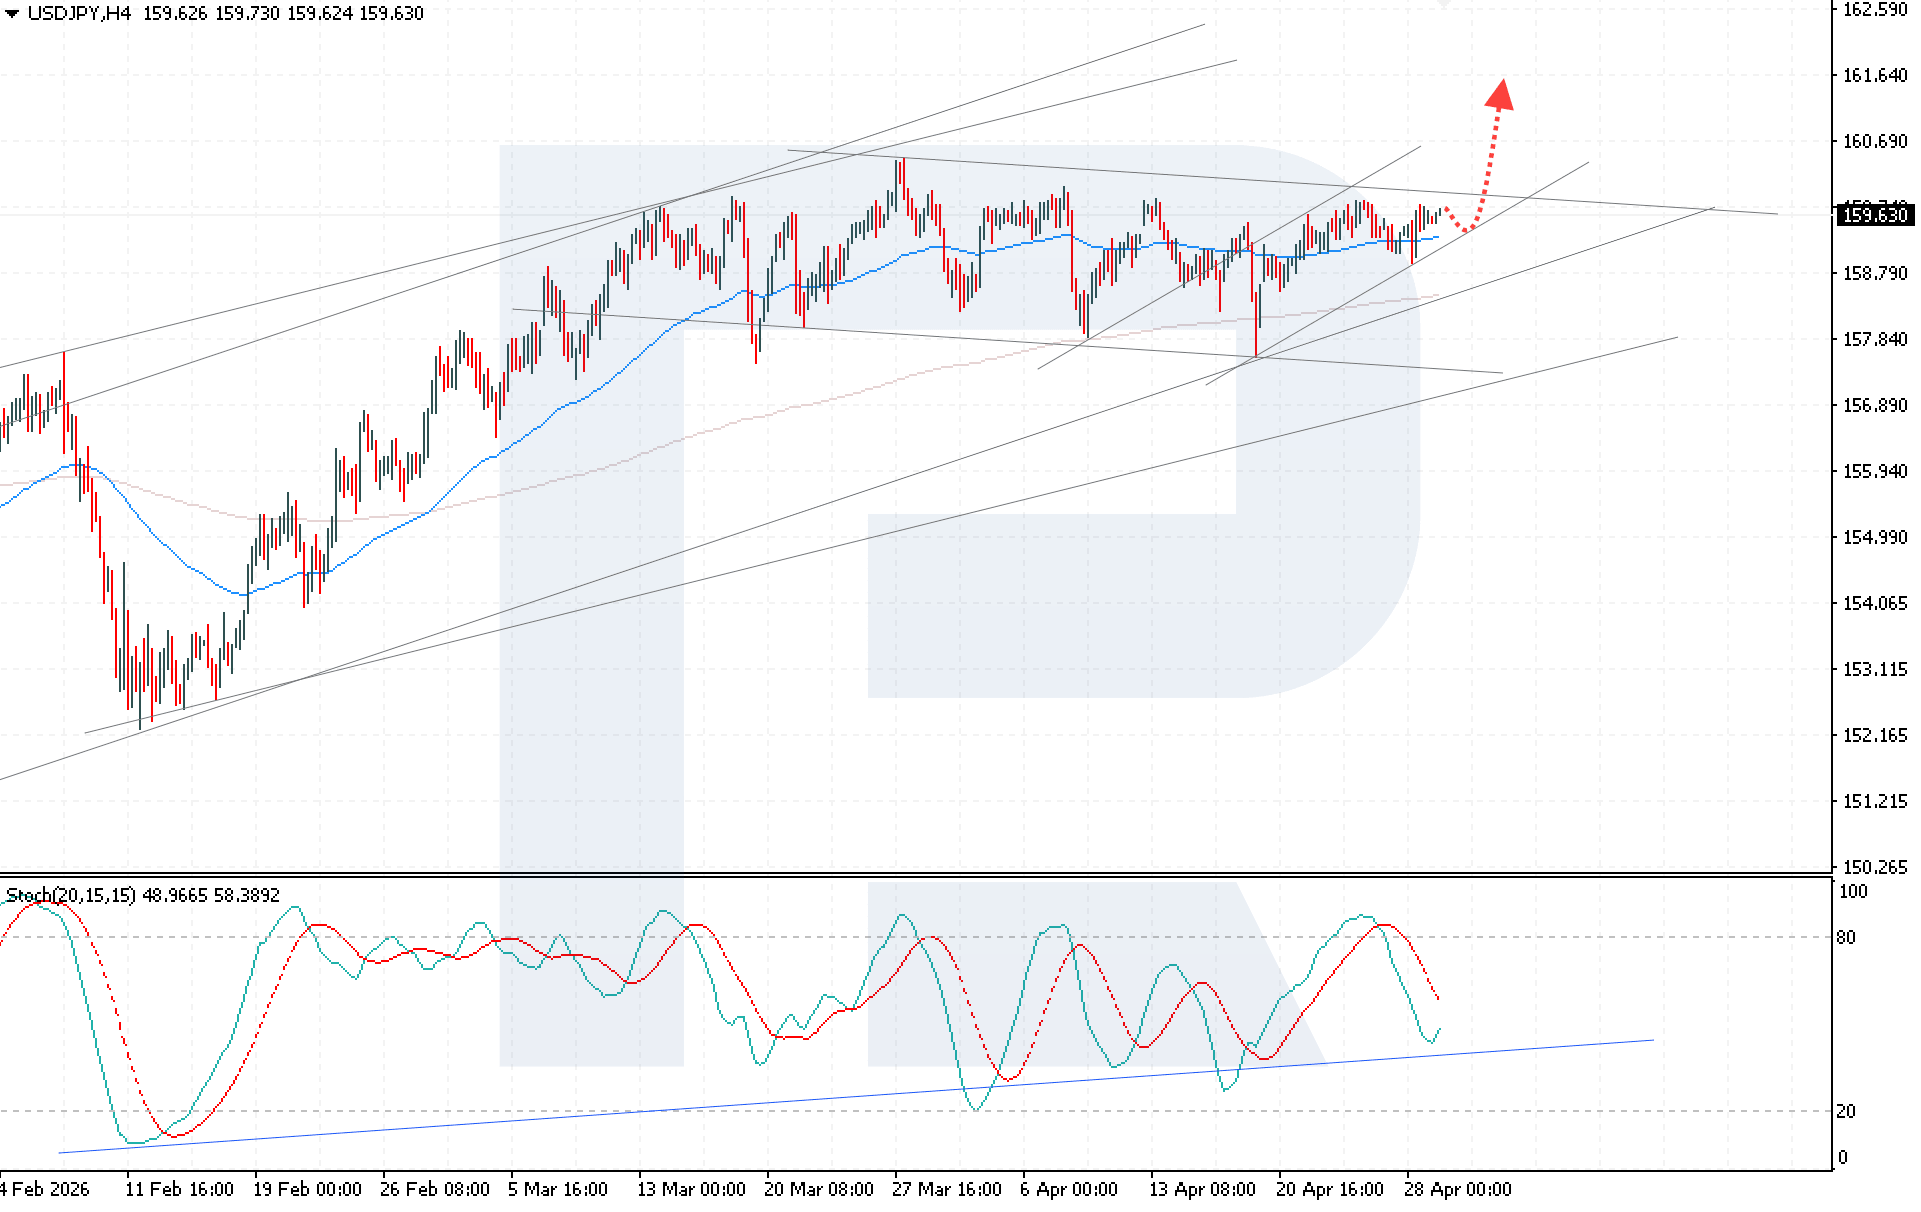
Technical outlook
The USDJPY rate continues to rise, but buyers have encountered resistance near the upper boundary of the descending channel, which is restraining the upward move. At the same time, the price is holding confidently above the EMA-65, indicating that the bulls remain in control, as downward pullbacks continue to be accompanied by active buying. Today’s USDJPY forecast suggests a high probability of a new upward momentum. The key signal could be a rebound from the channel’s lower boundary, followed by a move towards 161.65.
The technical picture remains bullish. The Stochastic Oscillator is forming a rebound from the upward trend line, indicating the potential for continued growth. Consolidation above 160.05 would confirm a breakout of the descending channel boundary and strengthen the signal for further growth.
The alternative scenario suggests a renewed decline if the price breaks below the lower boundary of the correction channel and consolidates below 159.25. In this case, the likelihood of a deeper downward correction will increase.
USDJPY overview
- Asset: USDJPY
- Timeframe: H4 (Intraday)
- Trend: range
- Key resistance levels: 159.80 and 160.00
- Key support levels: 159.25 and 157.85
USDJPY trading scenarios for today
Main scenario (Buy Stop)
A breakout above the key resistance level at 159.80 would confirm increased buying pressure and create conditions for opening long positions.
- Take Profit: 161.65
- Stop Loss: 159.50
Alternative scenario (Sell Stop)
Consolidation below the 159.25 level would indicate a breakout below the lower boundary of the bullish channel and trigger a deeper correction in the pair.
- Take Profit: 158.45
- Stop Loss: 159.55
Risk factors
The key risk to continued USDJPY growth remains a failure to consolidate above the 159.80 level, which may trigger profit-taking and increased selling pressure. An additional threat is possible currency interventions by the BoJ and a breakout below 159.25, which will open the way to a deeper downward correction.
Summary
The USDJPY pair maintains its bullish momentum, but the 159.80 level remains a critical obstacle, while the risk of currency interventions from Japan is limiting the pair’s further upside potential. USDJPY technical analysis suggests continued upside potential with an upside target at 161.65, but a breakout below the 159.25 level would open the door to a deeper downward correction.
Editors’ picks
 EURUSD 2026-2027 forecast: key market trends and future predictions
This article provides the EURUSD forecast for 2026 and 2027 and highlights the main factors determining the direction of the pair’s movements. We will apply technical analysis, take into account the opinions of leading experts, large banks, and financial institutions, and study AI-based forecasts. This comprehensive insight into EURUSD predictions should help investors and traders make informed decisions.
 Gold (XAUUSD) forecast 2026 and beyond: expert insights, price predictions, and analysis
Dive deep into the Gold (XAUUSD) price outlook for 2026 and beyond, combining technical analysis, expert forecasts, and key macroeconomic factors. It explains the drivers behind gold’s recent surge, explores potential scenarios including a move toward 4,500 to 5,000 USD per ounce, and highlights why the metal remains a strong hedge during global uncertainty.
Forecasts presented in this section only reflect the author’s private opinion and should not be considered as guidance for trading. RoboForex bears no responsibility for trading results based on trading recommendations described in these analytical reviews.