USDJPY is holding near the 157.85 resistance level
The USDJPY rate maintains a steady upward momentum amid strong US inflation and lower expectations of Fed policy easing, currently standing at 157.72. Discover more in our analysis for 13 May 2026.
USDJPY forecast: key takeaways
- Inflation in the US has reached its highest level since May 2023
- Strong US inflation data supports USDJPY growth
- Markets have almost completely ruled out Federal Reserve rate cuts in 2026
- USDJPY forecast for 13 May 2026: 158.55
Fundamental analysis
The USDJPY pair is rising for the third consecutive trading session. Despite continued upward momentum, buyers have yet to secure a firm foothold above the key resistance level at 157.85.
The US currency is bolstered by stronger-than-expected US inflation data, which has reduced expectations of near-term Fed monetary easing.
According to the published statistics, the US Consumer Price Index rose by 3.8% year-on-year in April, reaching its highest level since May 2023. The acceleration in inflation is largely linked to higher energy prices amid the conflict in the Middle East. Against this background, market participants have virtually ruled out the probability of Fed interest rate cuts this year.
The Federal Reserve continues to closely monitor consumer price movements, as inflation remains one of the key benchmarks in monetary policy decisions. Its inflation target remains 2%.
Technical outlook
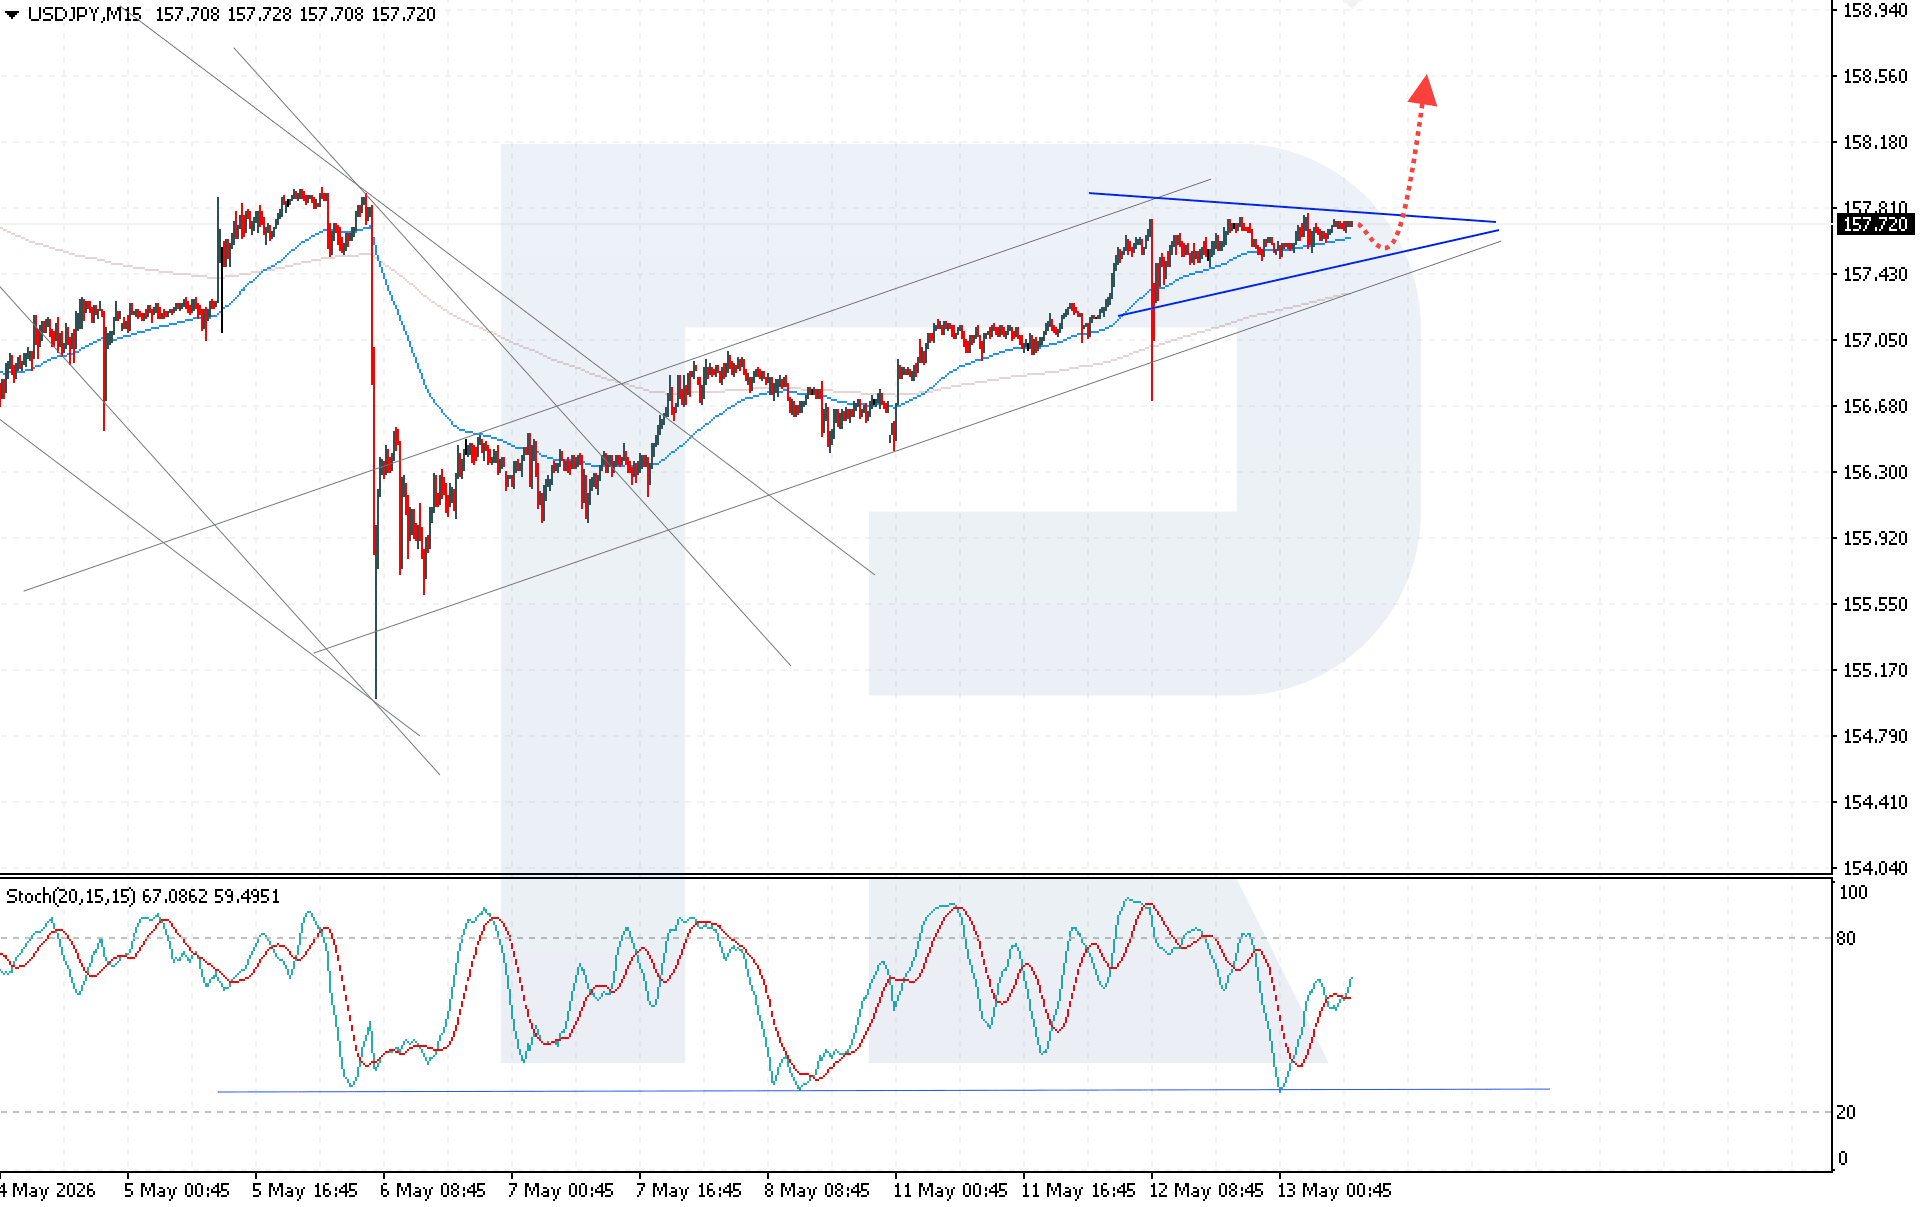
The USDJPY pair is correcting while forming a Triangle pattern. Despite the current range-bound movement, the currency pair maintains aggressive bullish momentum. The USDJPY forecast for today suggests a rebound from the lower boundary of the Triangle pattern, followed by upward momentum towards 158.55.
The technical picture remains bullish. The Stochastic Oscillator rebounded from the support line, signalling a high probability of continued growth momentum. A breakout of the Triangle’s upper boundary and consolidation above the 158.95 level would strengthen the USDJPY buy signal.
An alternative scenario suggests a renewed decline if the lower boundary of the medium-term bullish channel is broken and the price consolidates below 157.35. In this case, the likelihood of a renewed bearish correction will increase.
USDJPY overview
- Asset: USDJPY
- Timeframe: M15 (Intraday)
- Trend: upward
- Key resistance levels: 157.85 and 158.65
- Key support levels: 157.45 and 157.05
USDJPY trading scenarios for today
Main scenario (Buy Stop)
A breakout above the upper boundary of the Triangle pattern and consolidation above 157.85 would create conditions for opening long positions.
- Take Profit: 158.55
- Stop Loss: 157.50
Alternative scenario (Sell Stop)
A breakout below the lower boundary of the bullish channel and consolidation below the 157.35 level would indicate easing buying pressure and create conditions for a deeper bearish correction.
- Take Profit: 156.65
- Stop Loss: 157.65
Risk factors
A risk to the USDJPY upside scenario would be the failure of buyers to break through and consolidate above the 157.85 resistance level, which could trigger profit-taking and deepen the corrective decline. An additional negative signal would come from a breakout of the 157.25 support level, increasing the likelihood of a deeper bearish correction.
Summary
The USDJPY future trajectory will depend on whether buyers can hold above the 157.85 resistance level. USDJPY technical analysis suggests continued bullish momentum and a high probability of further growth towards 158.55, provided the price remains above the 157.25 support level.
Editors’ picks
 EURUSD 2026-2027 forecast: key market trends and future predictions
This article provides the EURUSD forecast for 2026 and 2027 and highlights the main factors determining the direction of the pair’s movements. We will apply technical analysis, take into account the opinions of leading experts, large banks, and financial institutions, and study AI-based forecasts. This comprehensive insight into EURUSD predictions should help investors and traders make informed decisions.
 Gold (XAUUSD) forecast 2026 and beyond: expert insights, price predictions, and analysis
Dive deep into the Gold (XAUUSD) price outlook for 2026 and beyond, combining technical analysis, expert forecasts, and key macroeconomic factors. It explains the drivers behind gold’s recent surge, explores potential scenarios including a move toward 4,500 to 5,000 USD per ounce, and highlights why the metal remains a strong hedge during global uncertainty.
Forecasts presented in this section only reflect the author’s private opinion and should not be considered as guidance for trading. RoboForex bears no responsibility for trading results based on trading recommendations described in these analytical reviews.