
USDJPY rises amid weak Japanese economic data
The USDJPY rate is hovering near local highs amid worsening Japanese macroeconomic indicators and continued demand for the US dollar. The rate currently stands at 159.08. Discover more in our analysis for 26 May 2026.
USDJPY forecast: key takeaways
- Japan’s Leading Economic Index was revised down to 114.0 from the preliminary estimate of 114.5
- Japan’s unemployment rate rose to 2.7%
- Japan’s employment fell by 120 thousand, reaching the lowest level in 11 months
- USDJPY forecast for 26 May 2026: 159.65
Fundamental analysis
The USDJPY pair continues to strengthen after rebounding from the 158.75 support level. However, quotes have remained within a sideways range for seven consecutive trading sessions, with resistance at 159.20 and support near 158.75. Pressure on the Japanese yen intensified following the release of weak macroeconomic statistics from Japan.
Japan’s Leading Economic Index was revised down to 114.0 in March 2026 from the preliminary estimate of 114.5. Labour market data provided additional support for USDJPY growth. The unemployment rate rose to 2.7%, while the number of employed people fell by 120 thousand, reaching an 11-month low. Consumer confidence in Japan also deteriorated, reaching the lowest level since April 2025.
The latest economic reports signal only a moderate improvement in the Japanese economy. At the same time, risks associated with the escalation of the conflict in the Middle East and ongoing uncertainty around US trade policy continue to increase pressure on the Japanese currency.
Technical outlook
The USDJPY pair is on the rise after breaking above the upper boundary of the descending channel. Buyers managed to gain a foothold above the EMA-65, despite the short-term downward momentum. The bulls are now approaching the upper boundary of the Triangle pattern, a breakout above which could trigger a stronger upward impulse. The USDJPY forecast for today suggests a rise towards the 159.65 level.
The technical picture remains favourable for further steady gains in the USDJPY rate. The Stochastic Oscillator has consolidated above the downward trendline, signalling a likely strengthening of the bullish momentum in the near term. A breakout above the upper boundary of the Triangle pattern, with the price consolidating above 159.15, would further confirm growth.
An alternative scenario suggests stronger selling pressure if the reversal pattern's lower boundary is broken and prices settle below 158.80. This signal would confirm a breakout of the Triangle pattern’s lower boundary and a downward momentum with a target at 158.05.
USDJPY overview
- Asset: USDJPY
- Timeframe: M15 (Intraday)
- Trend: sideways with a Triangle pattern forming
- Key resistance levels: 159.15 and 159.55
- Key support levels: 158.75 and 158.25
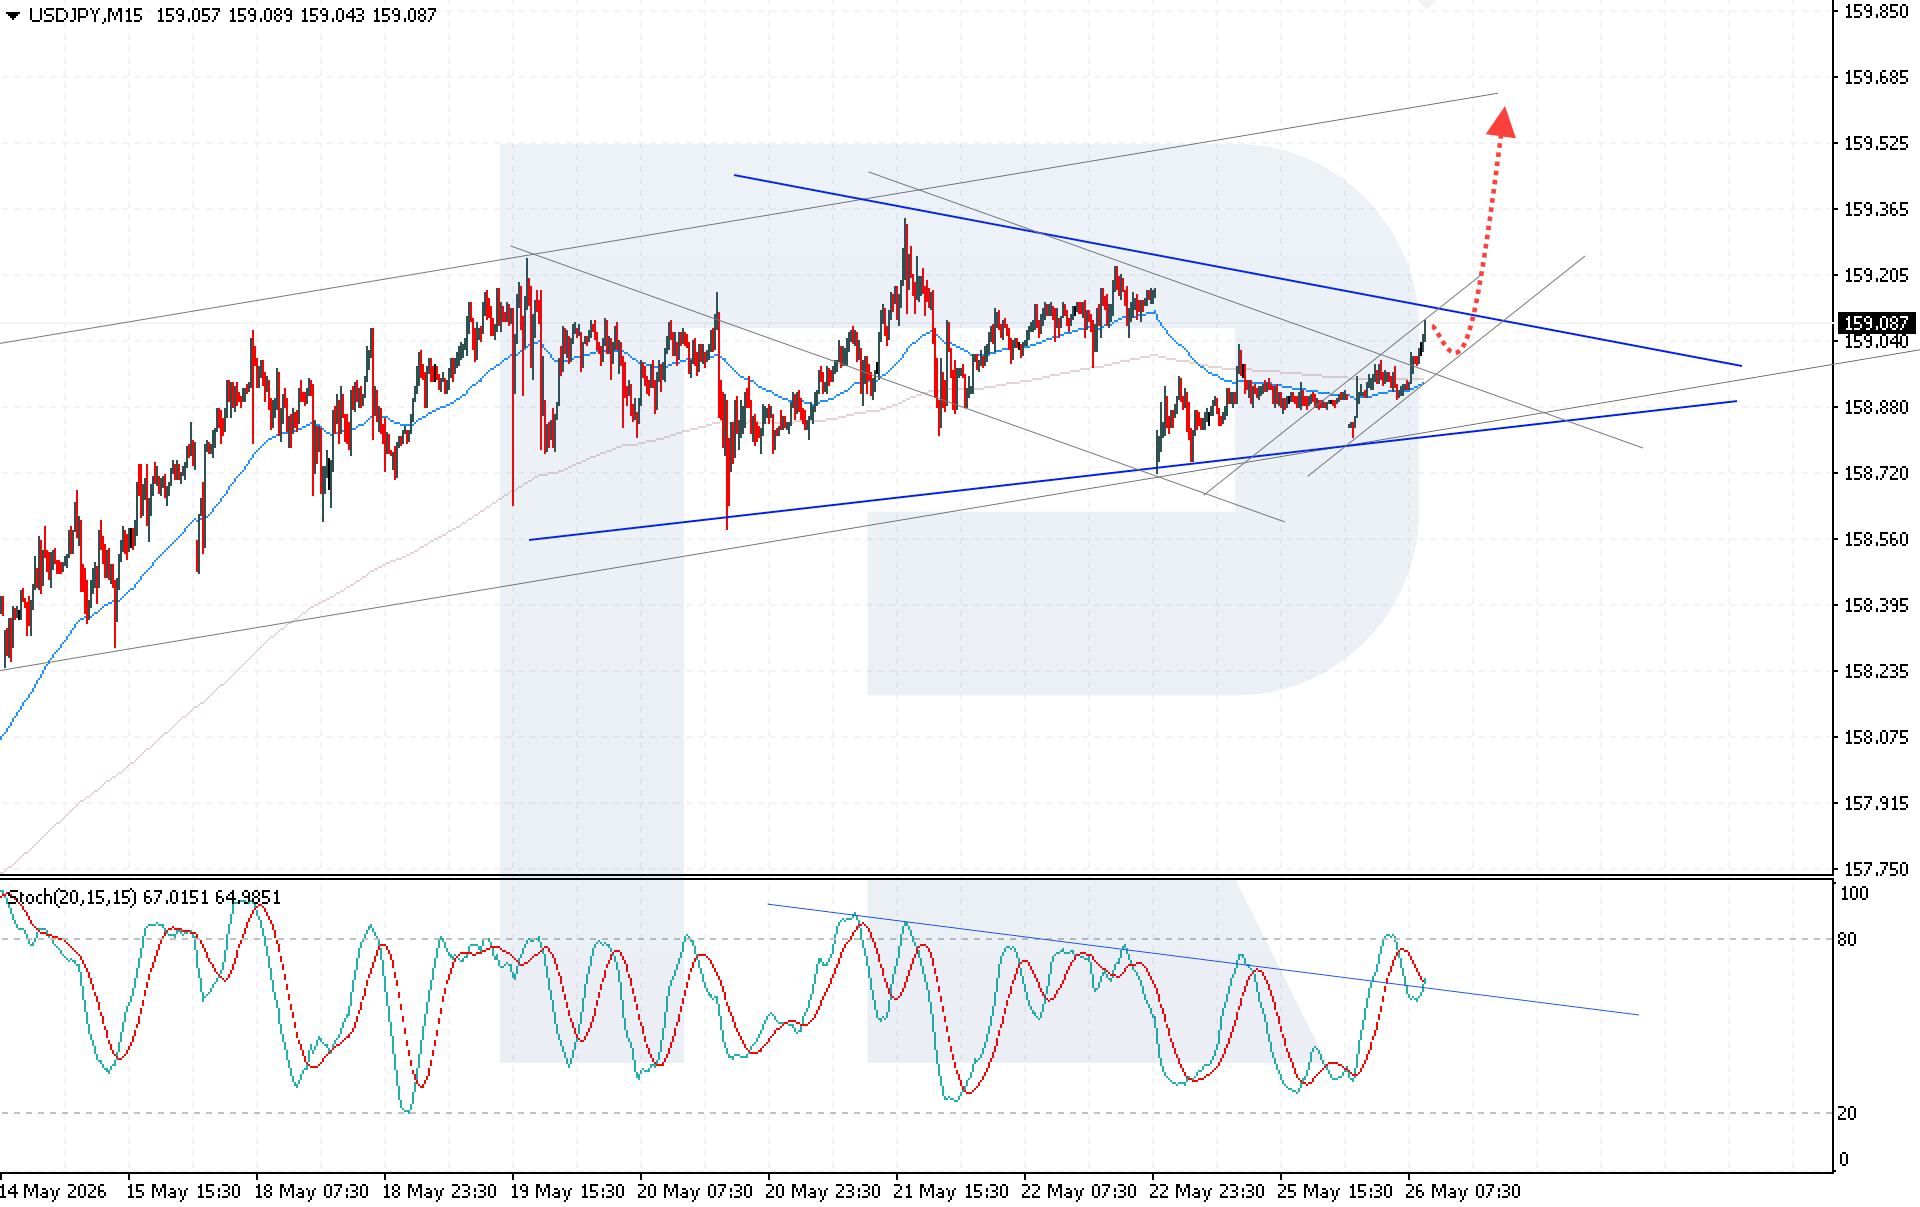
USDJPY trading scenarios for today
Main scenario (Buy Stop)
A breakout above the upper boundary of the Triangle pattern, with consolidation above 159.15, would indicate that conditions are forming for opening long positions.
- Take Profit: 159.65
- Stop Loss: 159.05
Alternative scenario (Sell Stop)
A breakout below the pattern’s lower boundary and consolidation below 158.80 would increase selling pressure and could trigger a decline to 158.05.
- Take Profit: 158.05
- Stop Loss: 159.10
Risk factors
The main risks to the USDJPY upside scenario include the possibility of increased selling pressure if quotes fail to consolidate above the 159.15 resistance level and the upper boundary of the Triangle pattern. An additional negative factor could be a return below 158.80, which would break the short-term bullish structure and strengthen the downward momentum towards 158.05.
Summary
USDJPY technical analysis suggests that the upward momentum remains intact, with growth likely to continue towards 159.65 if the price breaks above the upper boundary of the Triangle pattern.
Editors’ picks
 EURUSD 2026-2027 forecast: key market trends and future predictions
This article provides the EURUSD forecast for 2026 and 2027 and highlights the main factors determining the direction of the pair’s movements. We will apply technical analysis, take into account the opinions of leading experts, large banks, and financial institutions, and study AI-based forecasts. This comprehensive insight into EURUSD predictions should help investors and traders make informed decisions.
 Gold (XAUUSD) forecast 2026 and beyond: expert insights, price predictions, and analysis
Dive deep into the Gold (XAUUSD) price outlook for 2026 and beyond, combining technical analysis, expert forecasts, and key macroeconomic factors. It explains the drivers behind gold’s recent surge, explores potential scenarios including a move toward 4,500 to 5,000 USD per ounce, and highlights why the metal remains a strong hedge during global uncertainty.
Forecasts presented in this section only reflect the author’s private opinion and should not be considered as guidance for trading. RoboForex bears no responsibility for trading results based on trading recommendations described in these analytical reviews.