
USDJPY has risen 2% since last Thursday: it is too early to talk about a trend reversal
The USDJPY pair ended Friday’s trading near 157.87. Trading volatility has declined significantly. Discover more in our analysis for 10 August 2026.
USDJPY forecast: key takeaways
- The USDJPY pair has completed its correction and may enter a sideways range
- Since the start of the week, the yen has fallen by more than 2%
- USDJPY forecast for 10 August 2026: 159.75 or 160.00
Fundamental analysis
The USDJPY pair ended last week’s trading near 157.87. The fundamental backdrop for USDJPY currently appears mixed, but with a moderate bias towards yen strengthening and a decline in the pair. The main factor that continues to support the dollar is the substantial interest rate differential. The Federal Reserve keeps its interest rate in the 3.50–3.75% range, while the Bank of Japan’s rate is around 1.0%. This gap continues to make the dollar relatively more attractive.
In recent weeks, the situation has begun to shift in favour of the Japanese currency. Weak US labour market data reduced expectations of further Federal Reserve rate hikes, putting pressure on the dollar. At the same time, support for faster interest rate hikes is growing within the Bank of Japan, with expectations for a policy tightening as early as September increasing after the July meeting. This points to a potential narrowing of the interest rate gap between the US and Japan.
The USDJPY forecast is cautious.
Technical outlook
On the H4 chart, the USDJPY pair continues its corrective rise. This is unlikely to reverse the broader downtrend, but in the short term, it creates entry points for long positions.
The nearest support level is located at 157.80. A rebound from this mark would allow the pair to continue its recovery towards 159.75, with the potential for further growth to 160.00. Support levels lie at 157.80 and 156.62, with the key one at 155.71. A breakout below the latter would signal a continuation of the downtrend.
On the daily chart, the main resistance and support levels remain at 163.95 and 155.15, respectively. There is a risk that the price could trade sideways between these levels for an extended period before further strengthening. However, if the current correction leads to a breakout above the 163.95 resistance level, the trend would turn bullish.
USDJPY overview
- Asset: USDJPY
- Timeframe: H4 (intraday)
- Trend: range with a neutral-to-negative bias
- Key resistance levels: 159.75 and 160.00
- Key support levels: 156.62 and 157.80
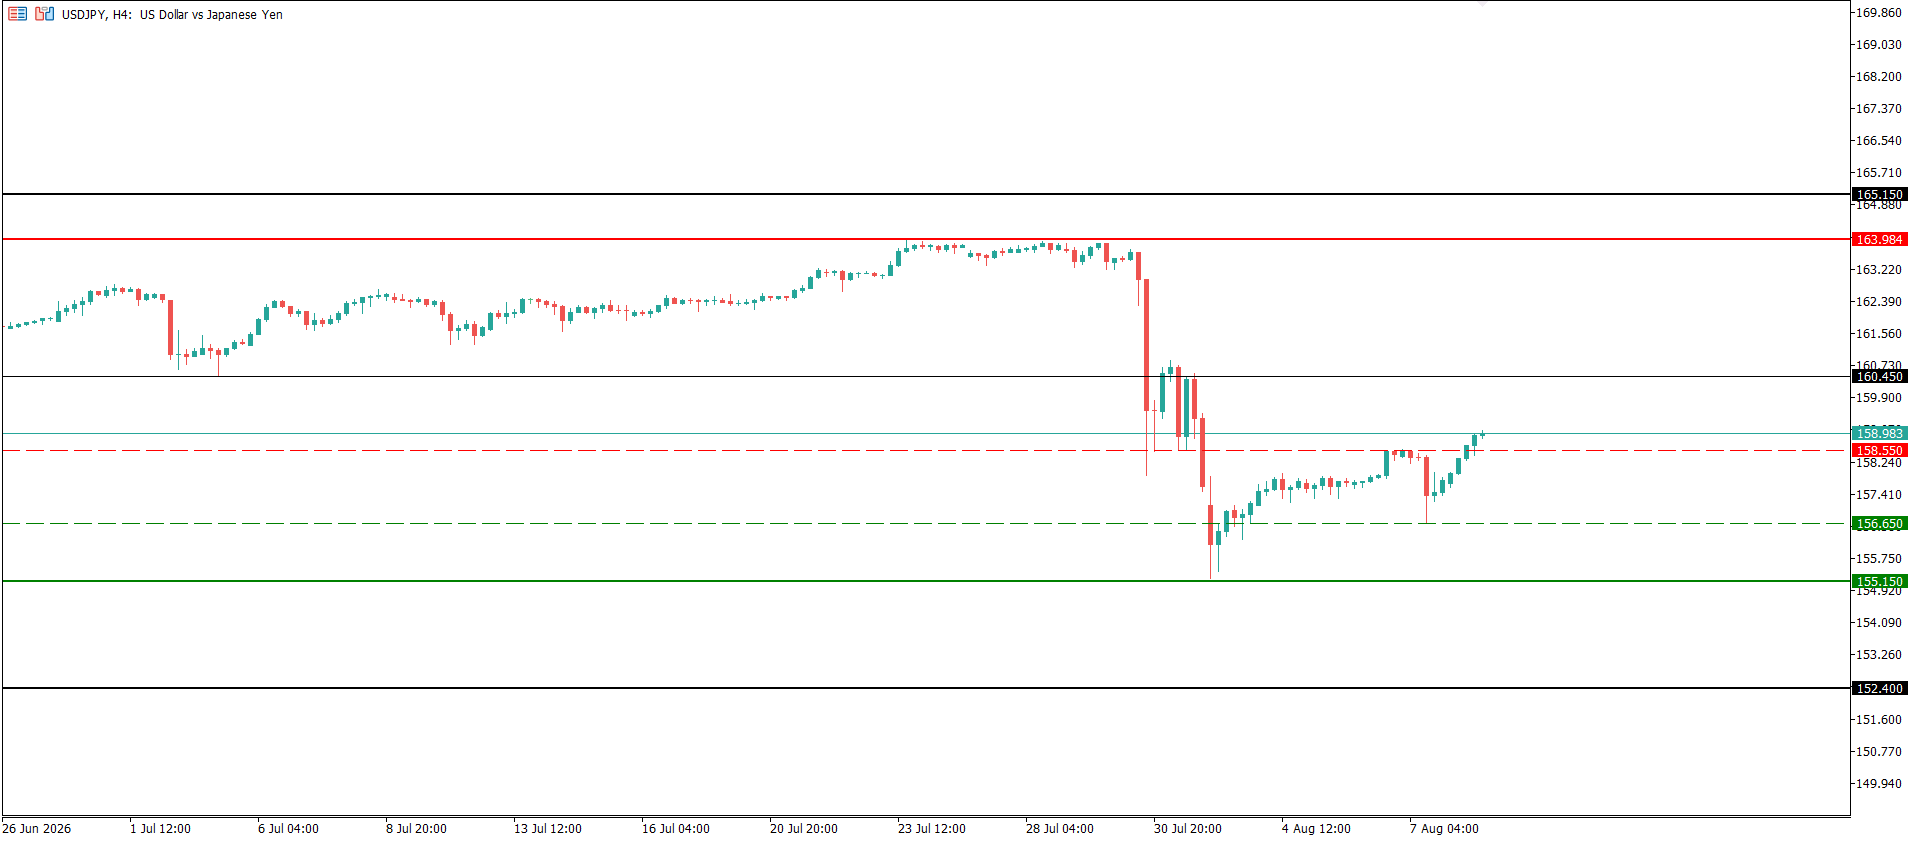
USDJPY trading scenarios for today
Main scenario (Buy Limit)
A rebound from the 157.80 support level followed by further growth would confirm the corrective upward move in USDJPY.
- Take Profit: 159.75
- Stop Loss: 157.80
Alternative scenario (Buy Limit)
A breakout and consolidation above the 159.75 resistance level would confirm a corrective recovery after the pair’s sharp decline.
- Take Profit: 160.00
- Stop Loss: 157.70
Risk factors
The main risk factor for further USDJPY growth remains currency intervention. After the yen fell to multi-year lows, Japan and the US conducted a joint intervention to prop up the Japanese currency and stated that they were prepared to act again. Therefore, as the USDJPY rate approaches high levels, the likelihood of renewed action by the authorities may restrain dollar buyers.
Summary
The USDJPY pair continues to correct. The USDJPY forecast for today, 10 August 2026, suggests a rebound from the 157.80 support level, with the nearest upside target at 159.75.
Editors’ picks
 EURUSD forecast 2026–2027: technical analysis, price levels & predictions
EURUSD has pulled back from the 2026 high of 1.1915 and is now trading near 1.1450 — below both EMA65 and EMA200 — with the active scenario shifting from bullish to bearish. The ECB raised rates to 2.40%, but the Fed holds at 3.75%, and US inflation (3.5%) continues to outpace the eurozone (2.8%). A confirmed break below 1.1280 opens the next downward wave toward 1.1080. We break down the key levels, three trading scenarios with entry triggers, and what Deutsche Bank, Morgan Stanley and UBS are forecasting for EURUSD in 2026.
 Gold (XAUUSD) forecast 2026: predictions based on fundamental and technical analysis
Gold has corrected over 25% from its all-time high of 5,597 USD and is now trading near 4,100 USD — testing a critical support zone. Is this the bottom, or will the downtrend continue? We break down the key levels (support 3,920 USD, breakout trigger 4,500 USD), three trading scenarios with entry levels, and what J.P. Morgan, Goldman Sachs and Deutsche Bank are forecasting for gold in 2026.
Forecasts presented in this section only reflect the author’s private opinion and should not be considered as guidance for trading. RoboForex bears no responsibility for trading results based on trading recommendations described in these analytical reviews.