
USDJPY moves higher as doubts over the yen persist
The USDJPY pair has risen to 159.37, with the US dollar back in the market spotlight. Find out more in our analysis for 25 August 2026.
USDJPY forecast: key takeaways
- The USDJPY pair continues to rise amid market demand for the US dollar as a safe-haven asset
- The likelihood of a BoJ rate hike in September is around 80%
- USDJPY forecast for 25 August 2026: 159.81 and 160.65
Fundamental analysis
The USDJPY rate is rising gradually and approaching 159.37. The US dollar has been supported by demand for safe-haven assets amid US plans to isolate Iran from the global financial system. This has once again highlighted the dollar's key role in international settlements.
However, the dollar's growth remains limited by concerns over the US debt situation. Investors doubt whether the Treasury's expanded bond buyback program can stabilise the market and contain borrowing costs for long.
In Japan, former Bank of Japan board member Seiji Adachi said the regulator is likely to raise rates as early as next month and could then take another step in January. According to him, a decision not to tighten policy could lead to a sell-off of the yen and accelerate imported inflation.
The market currently estimates the likelihood of a 25-basis-point BoJ rate hike to 1.25% next month at around 80%. Before the regulator's July meeting, this figure stood at about 23%.
The USDJPY outlook is moderately positive.
Technical outlook
On the H4 chart, the USDJPY pair retains a sideways structure with a moderately positive bias. After falling to 158.20–158.40, the pair recovered to 159.37 and is once again approaching the upper boundary of the local range. The price is above the middle Bollinger Band, although the key 159.81 resistance level is still limiting further growth.
A consolidation above 159.81 would confirm increased buying pressure and open the way towards 160.65 and then 161.76. The nearest support level is located at 158.43, followed by 157.32 and the key 156.73 level. MACD remains near the zero line, indicating weak momentum, while the Stochastic Oscillator has risen to 80, so a local pause or correction may occur before a breakout of the resistance level.
The baseline trading idea is to buy after a consolidation above 159.81, with a buy stop at 159.82, a take profit at 160.65, and a stop loss at 159.32. The potential profit is about 83 pips with a risk of 50, giving a risk-to-reward ratio of approximately 1:1.7. The trade idea is valid until 8:00 AM on 26 August 2026, provided the USDJPY rate does not consolidate below 158.43.
USDJPY overview
- Asset: USDJPY
- Timeframe: H4 (intraday)
- Trend: neutral-to-positive
- Key resistance levels: 159.81 and 160.65
- Key support levels: 158.43 and 157.32
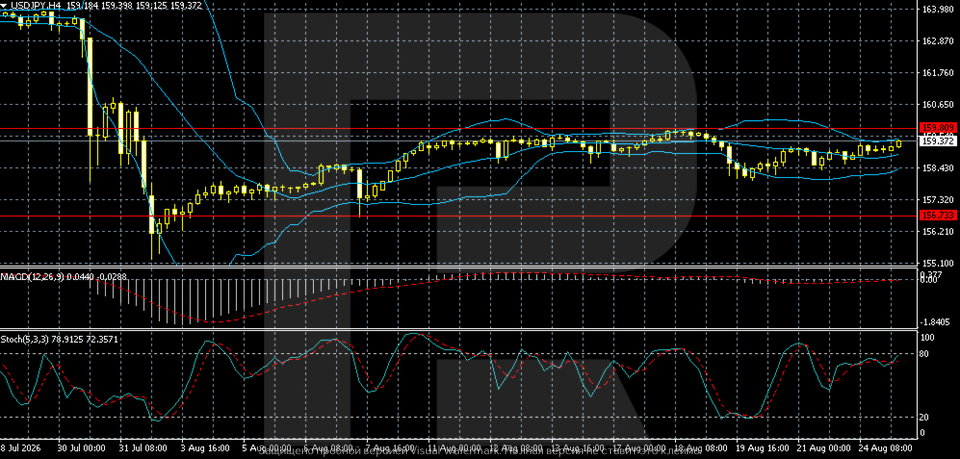
USDJPY trading scenarios for today
Main scenario (Buy Stop)
A consolidation above the 159.81 resistance level would confirm increased upward momentum and create conditions for further USDJPY growth.
- Current price: 159.37
- Entry point: 159.82
- Take profit: 160.65
- Stop loss: 159.32
- Risk-to-reward ratio: about 1:1.7
The trade idea is valid until 8:00 AM on 26 August 2026.
Alternative scenario (Sell Stop)
A breakout and consolidation below the 158.43 support level would indicate a strengthening yen and create conditions for a decline in the USDJPY rate.
- Entry point: 158.42
- Take profit: 157.32
- Stop loss: 158.90
- Risk-to-reward ratio: about 1:2.4
The trade idea is valid until 8:00 AM on 26 August 2026.
Risk factors
The main risks to further USDJPY upside are linked to heightened expectations of a September rate hike by the Bank of Japan, with the market pricing in around an 80% probability of a 25-basis-point move. Lower US Treasury yields and renewed intervention risks could add further pressure on the pair. At the same time, demand for the dollar as a safe-haven asset and the persistently wide interest rate differential continue to limit the yen's upside potential.
Summary
The USDJPY pair continues to rise as investors seek safe-haven assets. The USDJPY forecast for today, 25 August 2026, suggests the upward wave could continue towards 159.81 and then 160.65.
Editors’ picks
 EURUSD forecast 2026–2027: technical analysis, price levels & predictions
EURUSD has pulled back from the 2026 high of 1.1915 and is now trading near 1.1450 — below both EMA65 and EMA200 — with the active scenario shifting from bullish to bearish. The ECB raised rates to 2.40%, but the Fed holds at 3.75%, and US inflation (3.5%) continues to outpace the eurozone (2.8%). A confirmed break below 1.1280 opens the next downward wave toward 1.1080. We break down the key levels, three trading scenarios with entry triggers, and what Deutsche Bank, Morgan Stanley and UBS are forecasting for EURUSD in 2026.
 Gold (XAUUSD) forecast 2026: predictions based on fundamental and technical analysis
Gold has corrected over 25% from its all-time high of 5,597 USD and is now trading near 4,100 USD — testing a critical support zone. Is this the bottom, or will the downtrend continue? We break down the key levels (support 3,920 USD, breakout trigger 4,500 USD), three trading scenarios with entry levels, and what J.P. Morgan, Goldman Sachs and Deutsche Bank are forecasting for gold in 2026.
Forecasts presented in this section only reflect the author’s private opinion and should not be considered as guidance for trading. RoboForex bears no responsibility for trading results based on trading recommendations described in these analytical reviews.