
USDJPY moves higher, but the market remains range-bound
The USDJPY pair is strengthening towards 159.81, with trading volumes remaining low. The interest rate differential continues to weigh on the yen. Discover more in our analysis for 1 September 2026.
USDJPY forecast: key takeaways
- The USDJPY pair is edging higher but remains broadly within its established trading range
- The market is appropriately assessing the possibility of renewed intervention to support the yen
- USDJPY forecast for 1 September 2026: 159.34 or 160.23
Fundamental analysis
The USDJPY rate is edging higher towards 159.81 on Tuesday. The Japanese yen is attempting to recover after testing the psychologically important 160 level. The approach to this mark has once again heightened concerns about possible currency intervention by the authorities.
Following the joint intervention by Japan and the US in late July, the yen has already surrendered more than half of those gains. The currency remains under pressure from structural factors such as the wide interest rate differential, rising fiscal risks in Japan, and high oil prices amid the conflict in the Middle East.
Investors are also assessing the outlook for Bank of Japan policy. According to media reports, US Treasury Secretary Scott Bessent urged Prime Minister Satsuki Katayama and BoJ Governor Kazuo Ueda to raise interest rates.
Expectations of a Bank of Japan rate hike in September are strengthening amid yen weakness and the risk of accelerating imported inflation. For the USDJPY pair, the 160 area remains not only a significant technical level but also a potential intervention threshold.
The USDJPY outlook is moderately positive.
Technical outlook
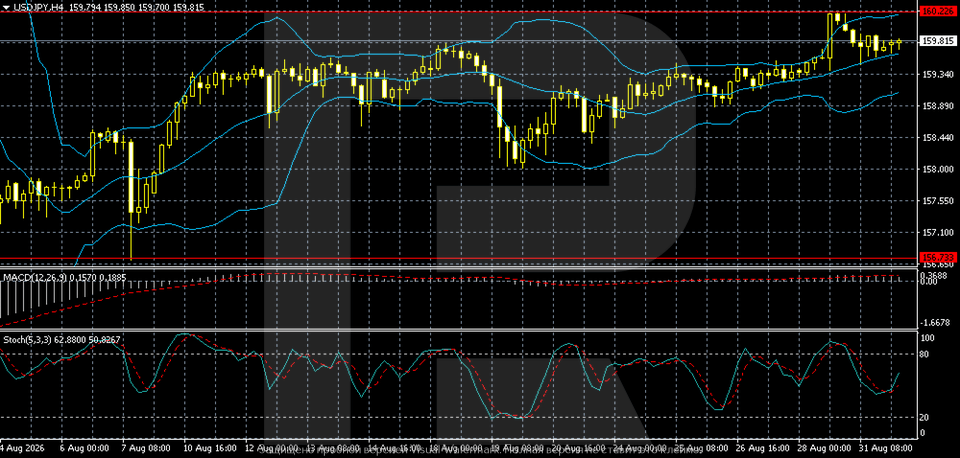
On the H4 chart, the USDJPY rate maintains a moderately bullish structure after the recent test of the psychologically important 160.00–160.23 zone. The pair corrected from the local high but remained above the middle Bollinger Band and is currently trading around 159.82. As long as the price remains above the 159.34 level, buyers retain the advantage.
The key resistance level is located at 160.23. A confident consolidation above this mark would confirm continued growth and create room for a move towards 160.65 and beyond. The nearest support level lies at 159.34, followed by 158.89 and 158.44. A breakout below 159.34 would increase the risk of a deeper correction, although the structure of higher lows remains intact for now.
MACD is in positive territory, although bullish momentum weakened somewhat after the test of the 160.23 level. The Stochastic Oscillator turned higher from the lower part of its range and moved above 50, supporting the likelihood of another resistance test. The baseline scenario remains range-bound trading between 159.34 and 160.23 with a moderately bullish bias.
USDJPY overview
- Asset: USDJPY
- Timeframe: H4 (intraday)
- Trend: moderately bullish
- Key resistance levels: 160.23 and 160.65
- Key support levels: 159.34 and 158.89
USDJPY trading scenarios for today
Main scenario (Buy Stop)
A consolidation above the 160.23 resistance level would confirm continued upward momentum and create conditions for further USDJPY gains.
- Current price: 159.81
- Entry level: 160.24
- Take profit: 160.65
- Stop loss: 159.95
- Risk-to-reward ratio: about 1:1.4
The trade idea is valid until 8:00 AM on 2 September 2026 (server time, UTC+3).
Alternative scenario (Sell Stop)
A breakout and consolidation below the 159.34 support level would indicate a correction and create conditions for a decline in the USDJPY rate.
- Entry level: 159.33
- Take profit: 158.89
- Stop loss: 159.60
- Risk-to-reward ratio: about 1:1.6
The trade idea is valid until 8:00 AM on 2 September 2026 (server time, UTC+3).
Risk factors
The main risks to further USDJPY gains are stronger expectations of a Bank of Japan rate hike in September and the possibility of another currency intervention if the pair moves steadily above 160. These factors could support the yen and push the pair back below 159.34. At the same time, the wide interest rate differential between the US and Japan, expectations of a Federal Reserve rate hike, fiscal risks in Japan, and high oil prices continue to limit the yen’s upside potential.
Summary
The USDJPY pair is attempting to rise, but market activity remains subdued. The USDJPY forecast for today, 1 September 2026, suggests continued range-bound trading between 159.34 and 160.23, with attempts to move higher.
Editors’ picks
 EURUSD forecast 2026–2027: technical analysis, price levels & predictions
EURUSD has recovered from the July lows and is trading near 1.1545 — back in bullish territory. The pair has reclaimed EMA65 on the daily, formed a bullish EMA crossover on H4, and the US-eurozone GDP gap has narrowed sharply (US 1.5% vs eurozone 1.0%). Goldman Sachs and Deutsche Bank both now target 1.2500 by year-end. A confirmed close above 1.1700 opens the path to 1.1805. We break down the key levels, three trading scenarios, and what the unprecedented 9-3 FOMC dissent vote means for EURUSD.
 Gold (XAUUSD) forecast 2026: technical analysis, price levels & predictions
Gold has reversed its downtrend and is trading near 4,360 USD, back above both EMA65 and EMA200. ETF flows turned positive in July with 3 billion USD of net inflows, and central banks bought 288.9 tonnes in Q2 — up 62% year-on-year. A breakout above 4,500 USD opens the path to 4,855 USD and the 5,597 USD all-time high. We break down the key levels, three trading scenarios with entry triggers, and what J.P. Morgan, Deutsche Bank and Goldman Sachs are forecasting for gold in 2026.
Forecasts presented in this section only reflect the author’s private opinion and should not be considered as guidance for trading. RoboForex bears no responsibility for trading results based on trading recommendations described in these analytical reviews.