
USDJPY tests resistance: the yen gears up for a correction out of the sideways channel
The yen's strengthening has stalled, with the USDJPY pair poised for a correction. The USDJPY rate currently stands at 154.45. Find more details in our analysis for 14 September 2026.
USDJPY forecast: key takeaways
- US inflation came in at 3.4% year-on-year, in line with the forecast
- According to a Reuters poll dated 9 September, 70% of economists expect the rate to remain unchanged
- The market awaits the US Federal Reserve's interest rate decision this Wednesday
- USDJPY forecast for 14 September 2026:156.25
Fundamental analysis
The fundamental backdrop for the USDJPY pair on 14 September 2026 is mixed following the release of US inflation data, although it has a slight bias towards a decline in the pair. The annual CPI came in at 3.4% in August, exactly matching the forecast and the previous reading. As a result, the year-on-year CPI figure itself did not provide an unexpected catalyst for the dollar. However, the report revealed persistent underlying inflationary pressure, with the monthly CPI up 0.4%, and the core CPI up 0.3%. Against the backdrop of persistent inflation and a strong PPI reading, the market sharply raised the probability of a 25-basis-point Federal Reserve rate hike at the upcoming meeting to around 86%. The two-year US Treasury yield remains near 4.6%, supporting the dollar.
Bank of Japan policy is now equally important for the USDJPY pair. The market expects the BoJ to raise its rate by 25 basis points to 1.25% next week, while the regulator may maintain a fairly hawkish stance due to persistent inflation. Expectations of further policy tightening in Japan are already supporting the yen, which strengthened by around 0.5% on 11 September, pushing the USDJPY pair down towards 153.6.
The interest rate differential between the US and Japan remains another significant factor for the USDJPY rate. Even with US inflation holding at 3.4%, further gains in the pair will depend less on the CPI itself and more on how hawkish the Fed's signals are regarding the future rate trajectory. If the US regulator maintains its willingness to keep rates high for longer, US Treasury yields will remain elevated, supporting the dollar against the yen.
Technical outlook
On the daily chart, the USDJPY pair continues to trade below the previously established 155.15 support level, while a new support level has not yet formed. The nearest resistance has shifted to 156.75. On the H4 chart, the support level is located at 152.85, while resistance stands at 154.40. Despite the ongoing sideways movement, there is still potential for an upward correction. If the price recovers, the first target could be 156.25.
An alternative scenario suggests a further decline in the USDJPY pair. A decisive breakout below the 152.85 support level could add to pressure on the pair, with the next target for sellers at 151.55.
USDJPY overview
- Asset: USDJPY
- Timeframe: H4 (Intraday)
- Trend: bearish
- Key resistance levels: 154.75 and 156.75
- Key support levels: 153.10 and 152.95
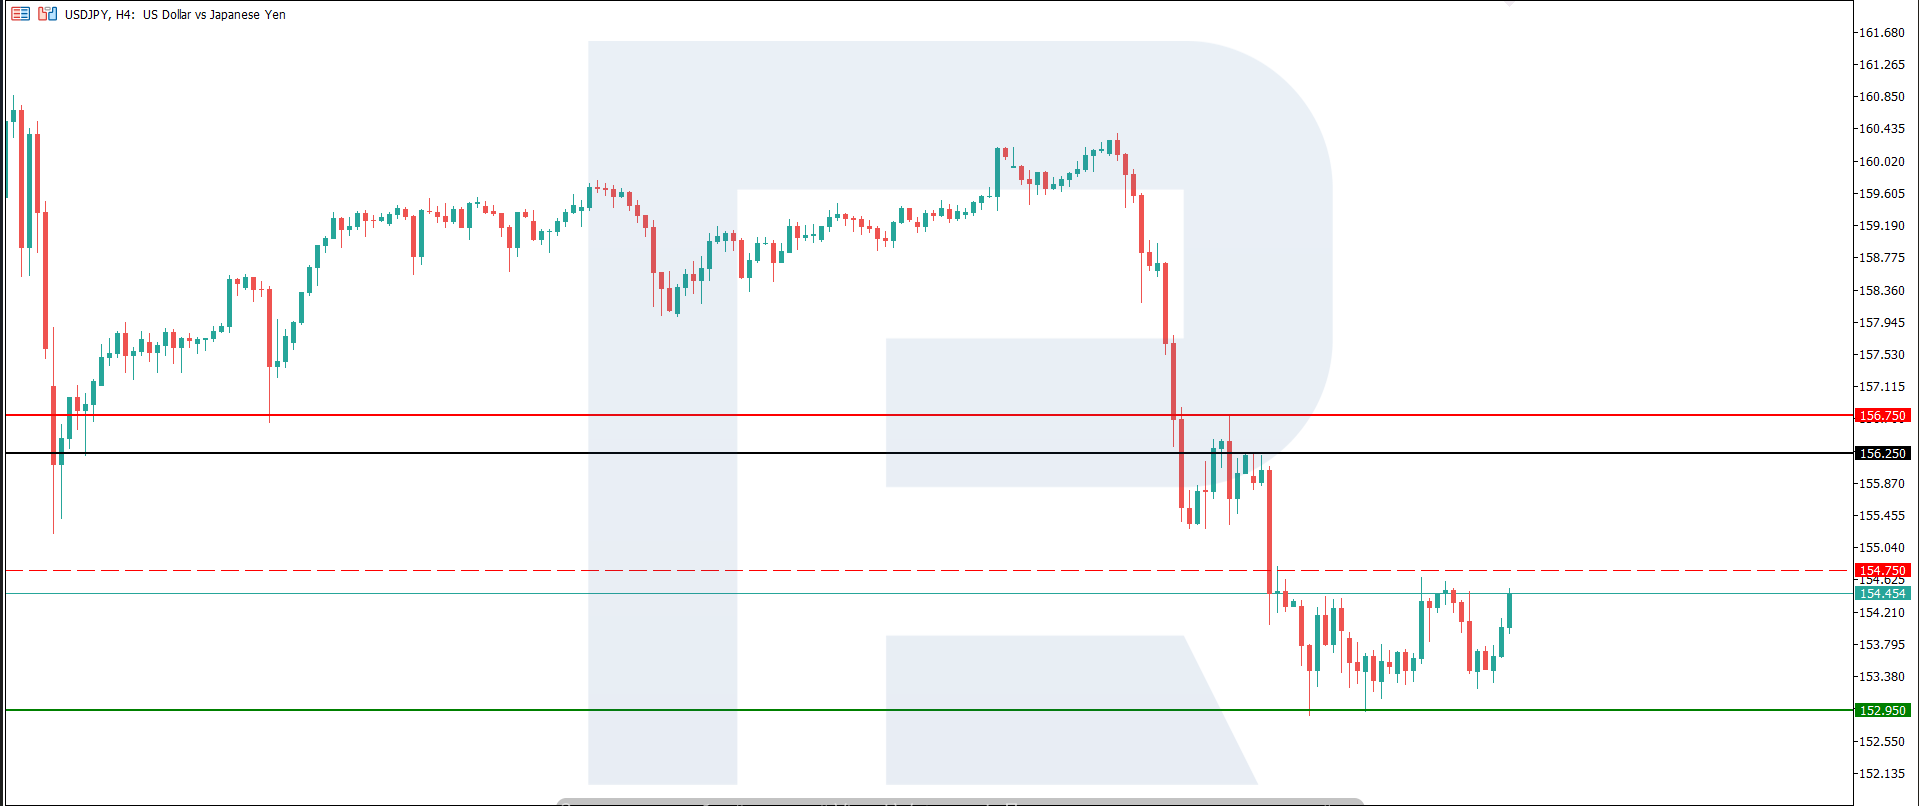
USDJPY trading scenario for today
Main scenario (Buy Stop)
Consolidation above the 154.40 resistance level would confirm the start of a correction and create conditions for further USDJPY growth.
- Current price: 154.45
- Entry level: 154.85
- Stop loss: 154.35
- Take profit: 156.25
- Risk-to-reward ratio: above 1:2.8
The trade idea is valid until 8:00 AM on 15 September 2026 (server time, UTC+3).
Risk factors
The main risks to the USDJPY outlook are linked to changing expectations for Federal Reserve and Bank of Japan interest rates. Stronger US inflation or labour market data could support the Fed's hawkish policy stance, push US bond yields higher, and trigger a rise in the pair above 154.80–155.20. At the same time, unexpectedly hawkish decisions by the Bank of Japan, stronger demand for safe-haven assets, or currency intervention by the Japanese authorities could sharply strengthen the yen, sending the USDJPY pair down.
Summary
The outlook for the USDJPY rate remains moderately negative. The Japanese yen is bolstered by expectations of further monetary policy tightening by the Bank of Japan and the gradual narrowing of the yield gap between Japanese and US bonds. At the same time, the US dollar's resilience and high Treasury yields are limiting the pair's downside potential. The baseline scenario suggests a gradual decline in the USDJPY pair if the Bank of Japan maintains its hawkish rhetoric, although an upward correction is possible in the short term. USDJPY technical analysis suggests a correction towards 156.25.
Editors’ picks
 EURUSD forecast 2026–2027: technical analysis, price levels & predictions
EURUSD has recovered from the July lows and is trading near 1.1545 — back in bullish territory. The pair has reclaimed EMA65 on the daily, formed a bullish EMA crossover on H4, and the US-eurozone GDP gap has narrowed sharply (US 1.5% vs eurozone 1.0%). Goldman Sachs and Deutsche Bank both now target 1.2500 by year-end. A confirmed close above 1.1700 opens the path to 1.1805. We break down the key levels, three trading scenarios, and what the unprecedented 9-3 FOMC dissent vote means for EURUSD.
 Gold (XAUUSD) forecast 2026: technical analysis, price levels & predictions
Gold has reversed its downtrend and is trading near 4,360 USD, back above both EMA65 and EMA200. ETF flows turned positive in July with 3 billion USD of net inflows, and central banks bought 288.9 tonnes in Q2 — up 62% year-on-year. A breakout above 4,500 USD opens the path to 4,855 USD and the 5,597 USD all-time high. We break down the key levels, three trading scenarios with entry triggers, and what J.P. Morgan, Deutsche Bank and Goldman Sachs are forecasting for gold in 2026.
Forecasts presented in this section only reflect the author’s private opinion and should not be considered as guidance for trading. RoboForex bears no responsibility for trading results based on trading recommendations described in these analytical reviews.