Daily technical analysis and forecast for 18 June 2026
Here is a detailed daily technical analysis and forecast for EURUSD, USDJPY, GBPUSD, AUDUSD, USDCAD, XAUUSD, Brent and BTCUSD for 18 June 2026.
EURUSD forecast
On the H4 chart of EURUSD, the market completed a growth wave to 1.1618 and then declined to 1.1480. Today, 18 June 2026, we will consider the probability of a correction towards 1.1540. Afterwards, a decline to 1.1385 is expected. This is a local target.
Technically, this scenario is confirmed by the indicated Elliott Wave structure and the Wave Matrix with a pivot centre at 1.1680. It is regarded as the key scenario within the structure of the downward wave for EURUSD. At the moment, the market completed a downward wave to the lower boundary of the Price Envelope at 1.1480. Next, we expect a growth leg towards its central line at 1.1540. Afterwards, a decline towards its lower boundary at 1.1385 is expected.
Technical indicators for today’s EURUSD forecast suggest considering the probability of a growth wave towards 1.1540 and the beginning of a decline in line with the trend towards 1.1385.

USDJPY forecast
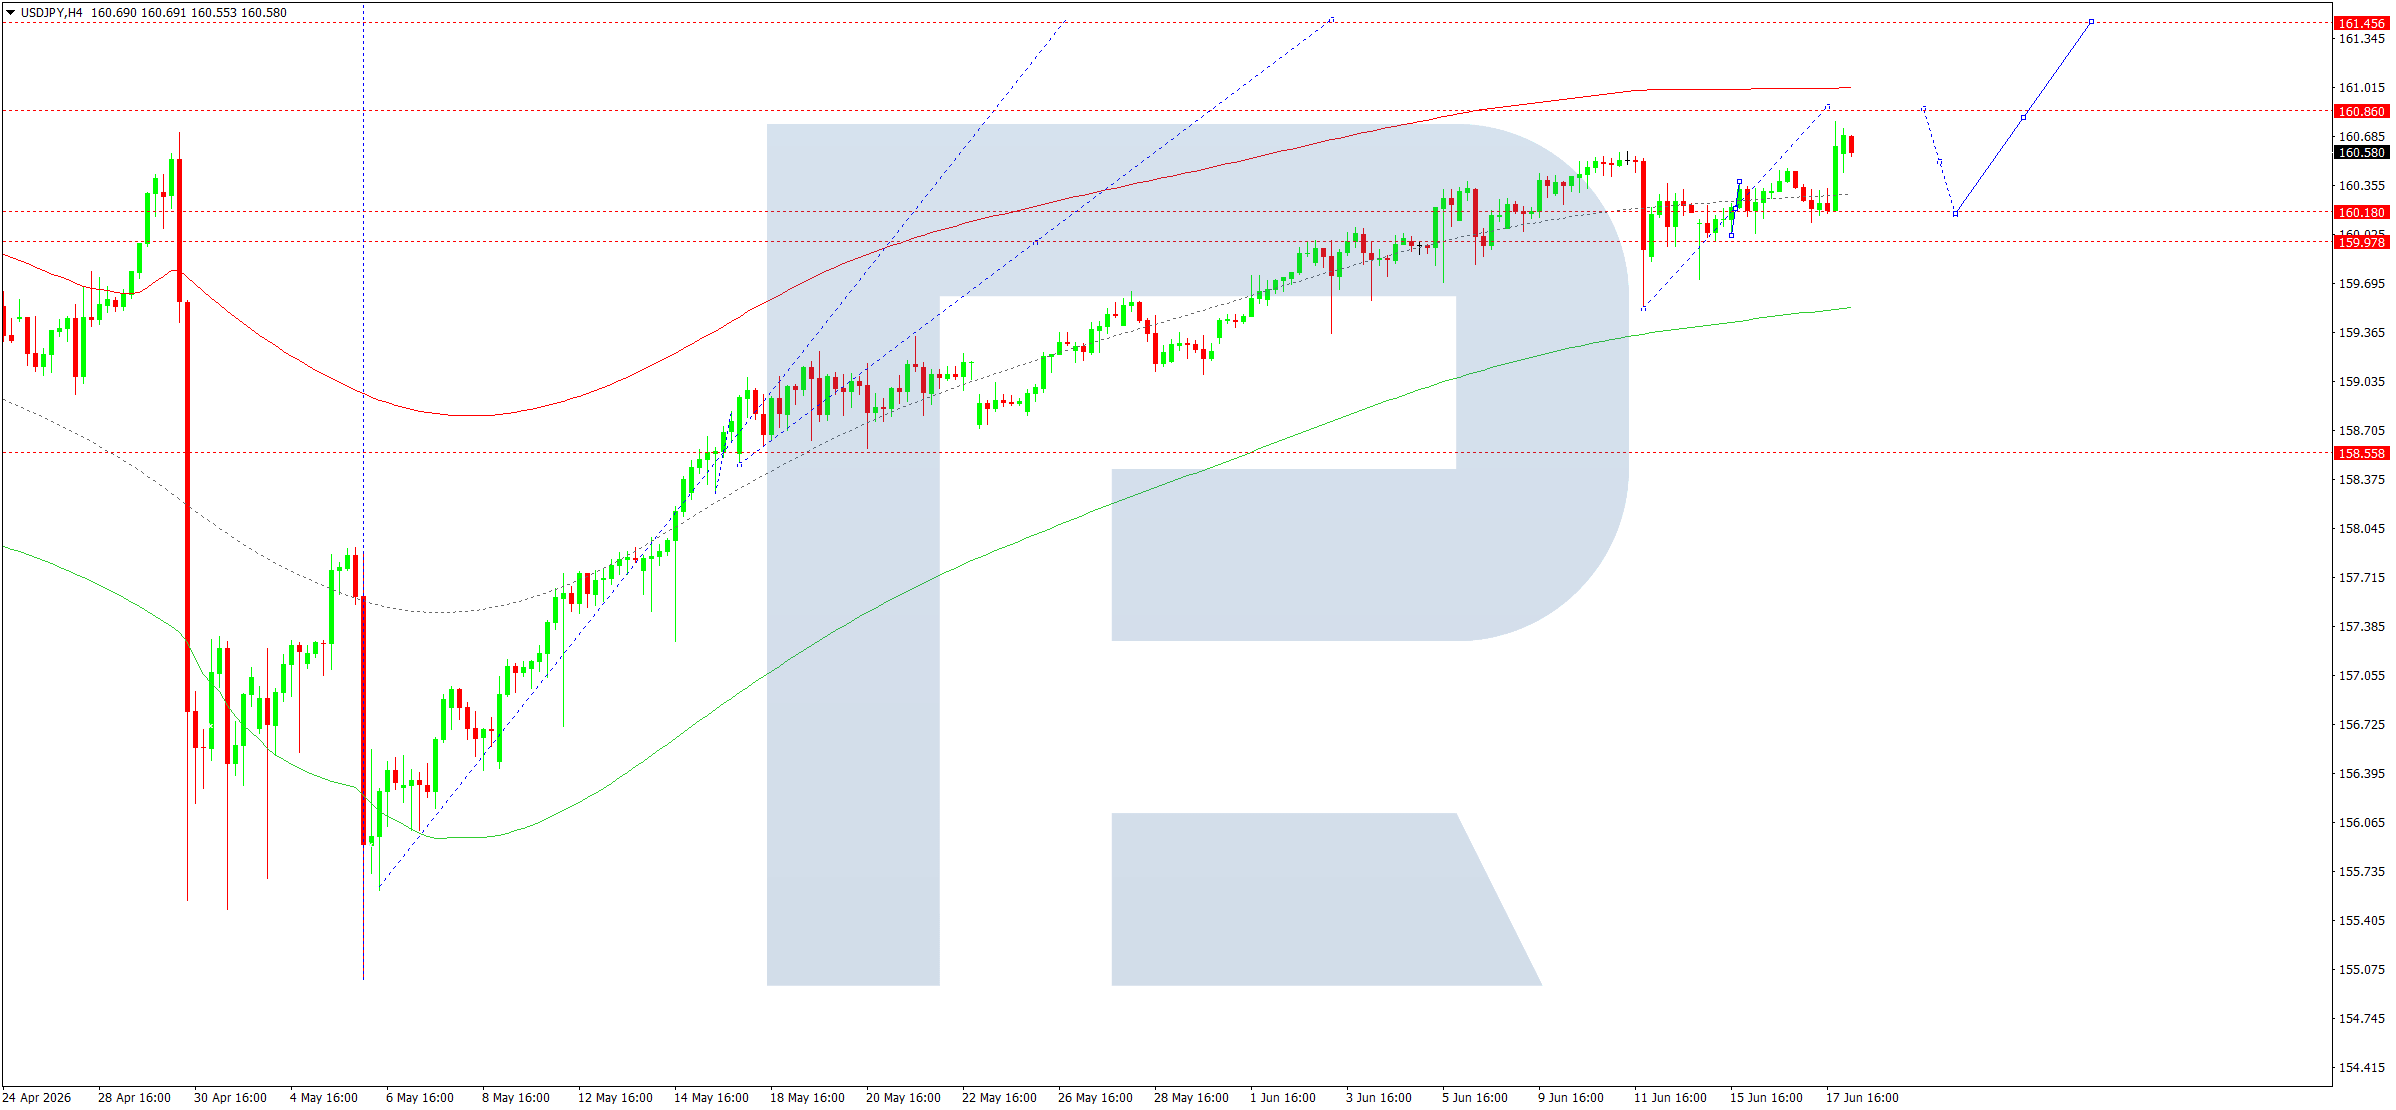
On the H4 chart of USDJPY, the market found support at 160.11 and completed a growth wave to 160.77. Today, 18 June 2026, we expect a correction towards 160.45. Afterwards, we will consider the probability of growth towards 160.88.
Technically, this scenario for USDJPY is confirmed by the indicated Elliott Wave structure and the Wave Matrix of the growth wave with a pivot centre at 159.10. It is regarded as the key scenario within this wave structure. At the moment, the market found support at 160.10 and continues the growth wave towards the upper boundary of the Price Envelope at 160.88. Afterwards, we expect the development of a new consolidation range below this level. If the price breaks below the range, the potential for a decline to its lower boundary at 160.45 will open. If the price breaks upwards, the potential for a wave towards its upper boundary at 161.50 will open.
Technical indicators for today’s USDJPY forecast suggest considering the probability of growth towards 161.50.
GBPUSD forecast
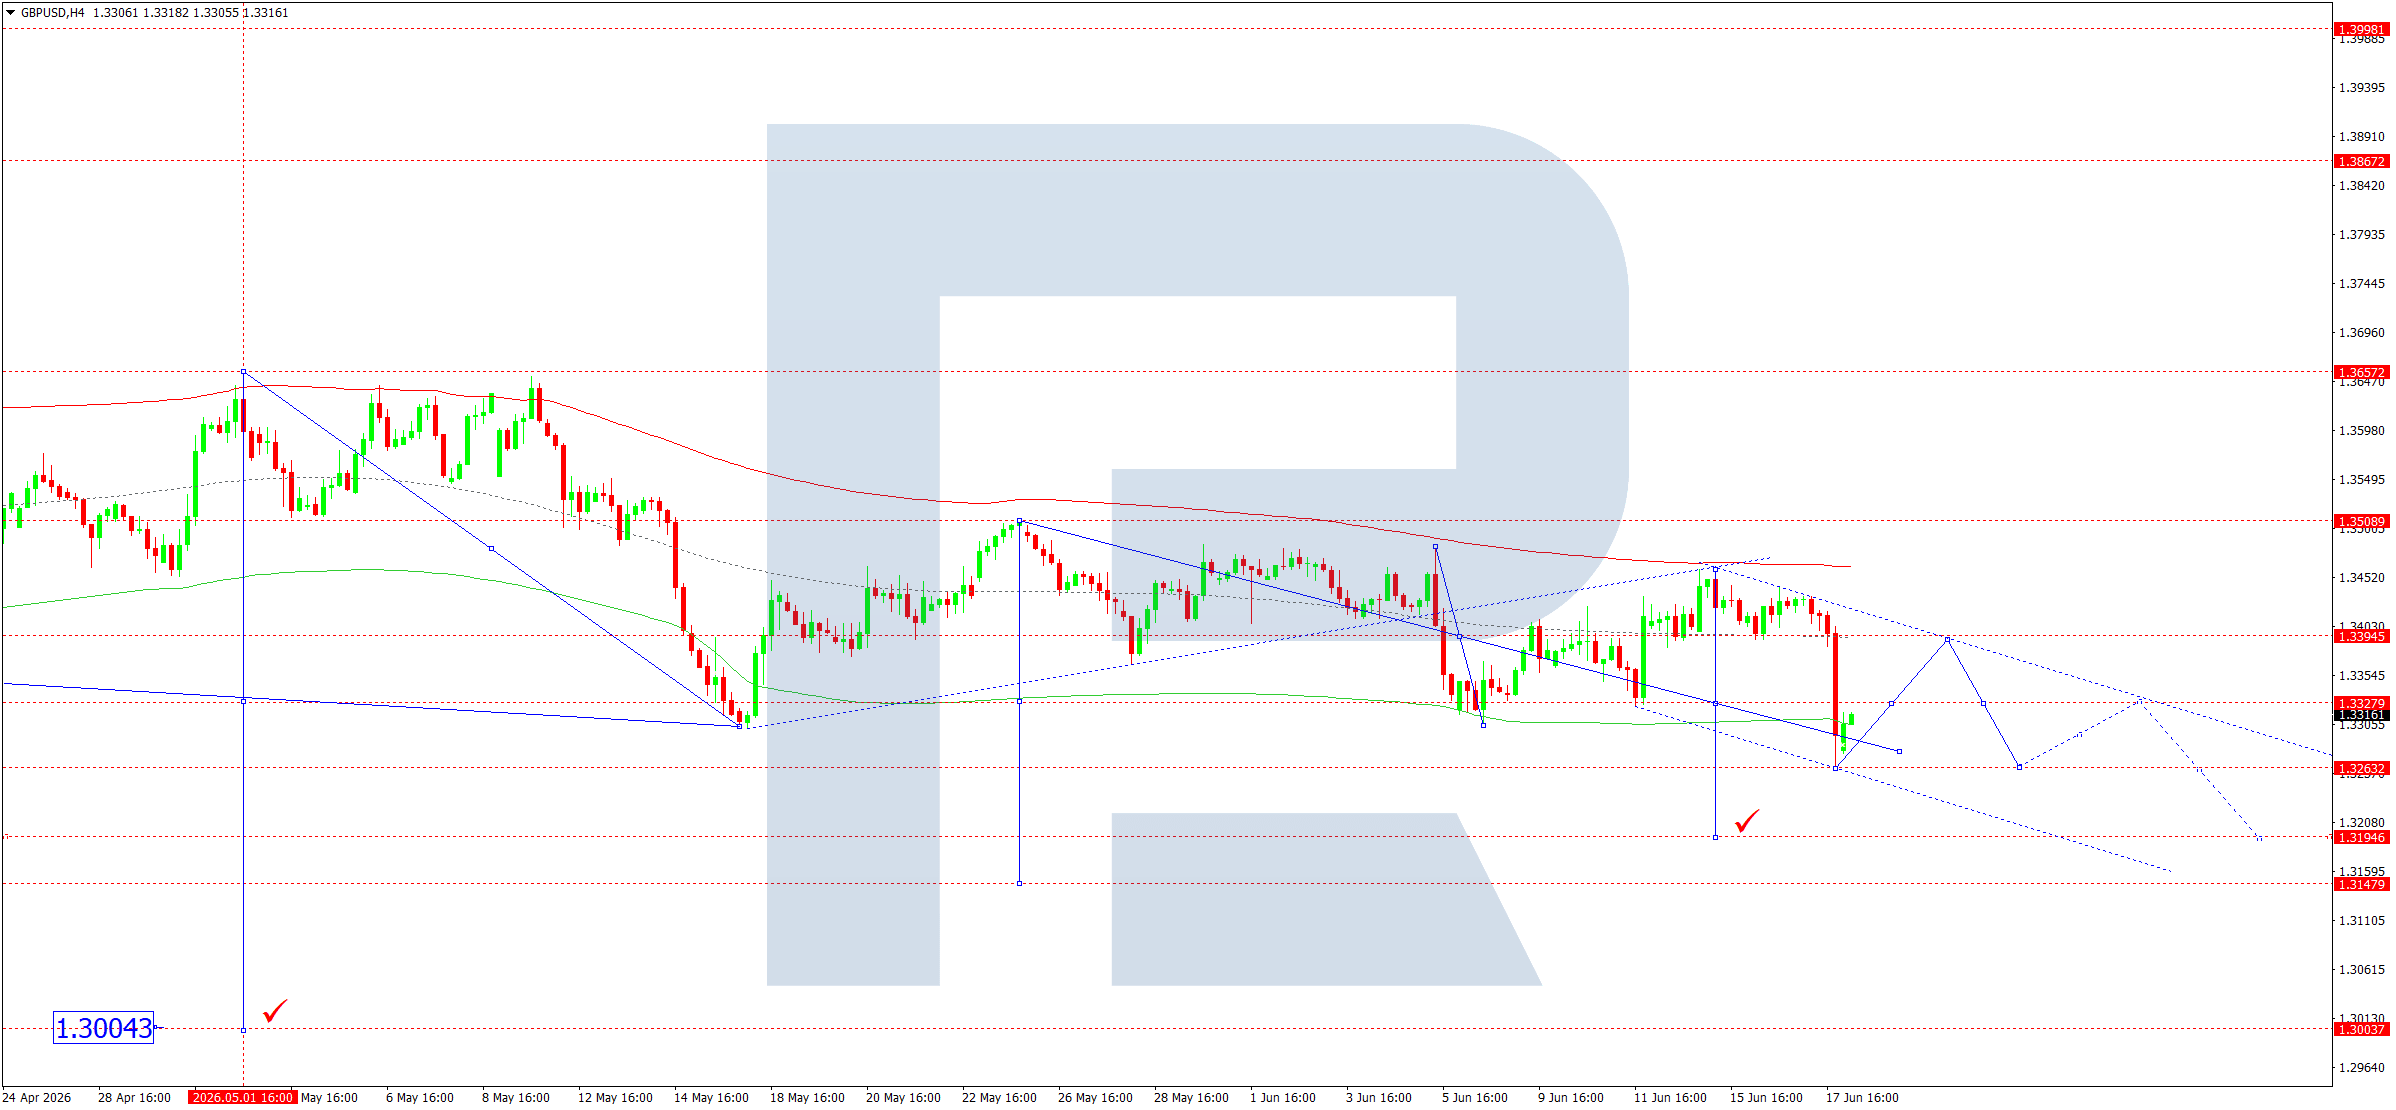
On the H4 chart of GBPUSD, the market completed a growth wave to 1.3444 and then declined to 1.3265. Today, 18 June 2026, the formation of a consolidation range above this level continues. If the price breaks below this level, the potential for continuation of the wave towards 1.3195 will open. If the price breaks upwards, a correction towards 1.3390 cannot be ruled out. Afterwards, a decline in line with the trend towards 1.3195 is expected.
Technically, this scenario for GBPUSD is confirmed by the indicated Elliott Wave structure and the Wave Matrix of the downward wave with a pivot centre at 1.3398. It is regarded as the key scenario within this wave structure. Today, a growth wave towards the central line of the Price Envelope at 1.3395 is forming. Afterwards, a downward leg towards its lower boundary at 1.3195 is expected. This is a local target.
Technical indicators for today’s GBPUSD forecast suggest considering the probability of growth towards 1.3395 and the beginning of a decline to 1.3195.
AUDUSD forecast
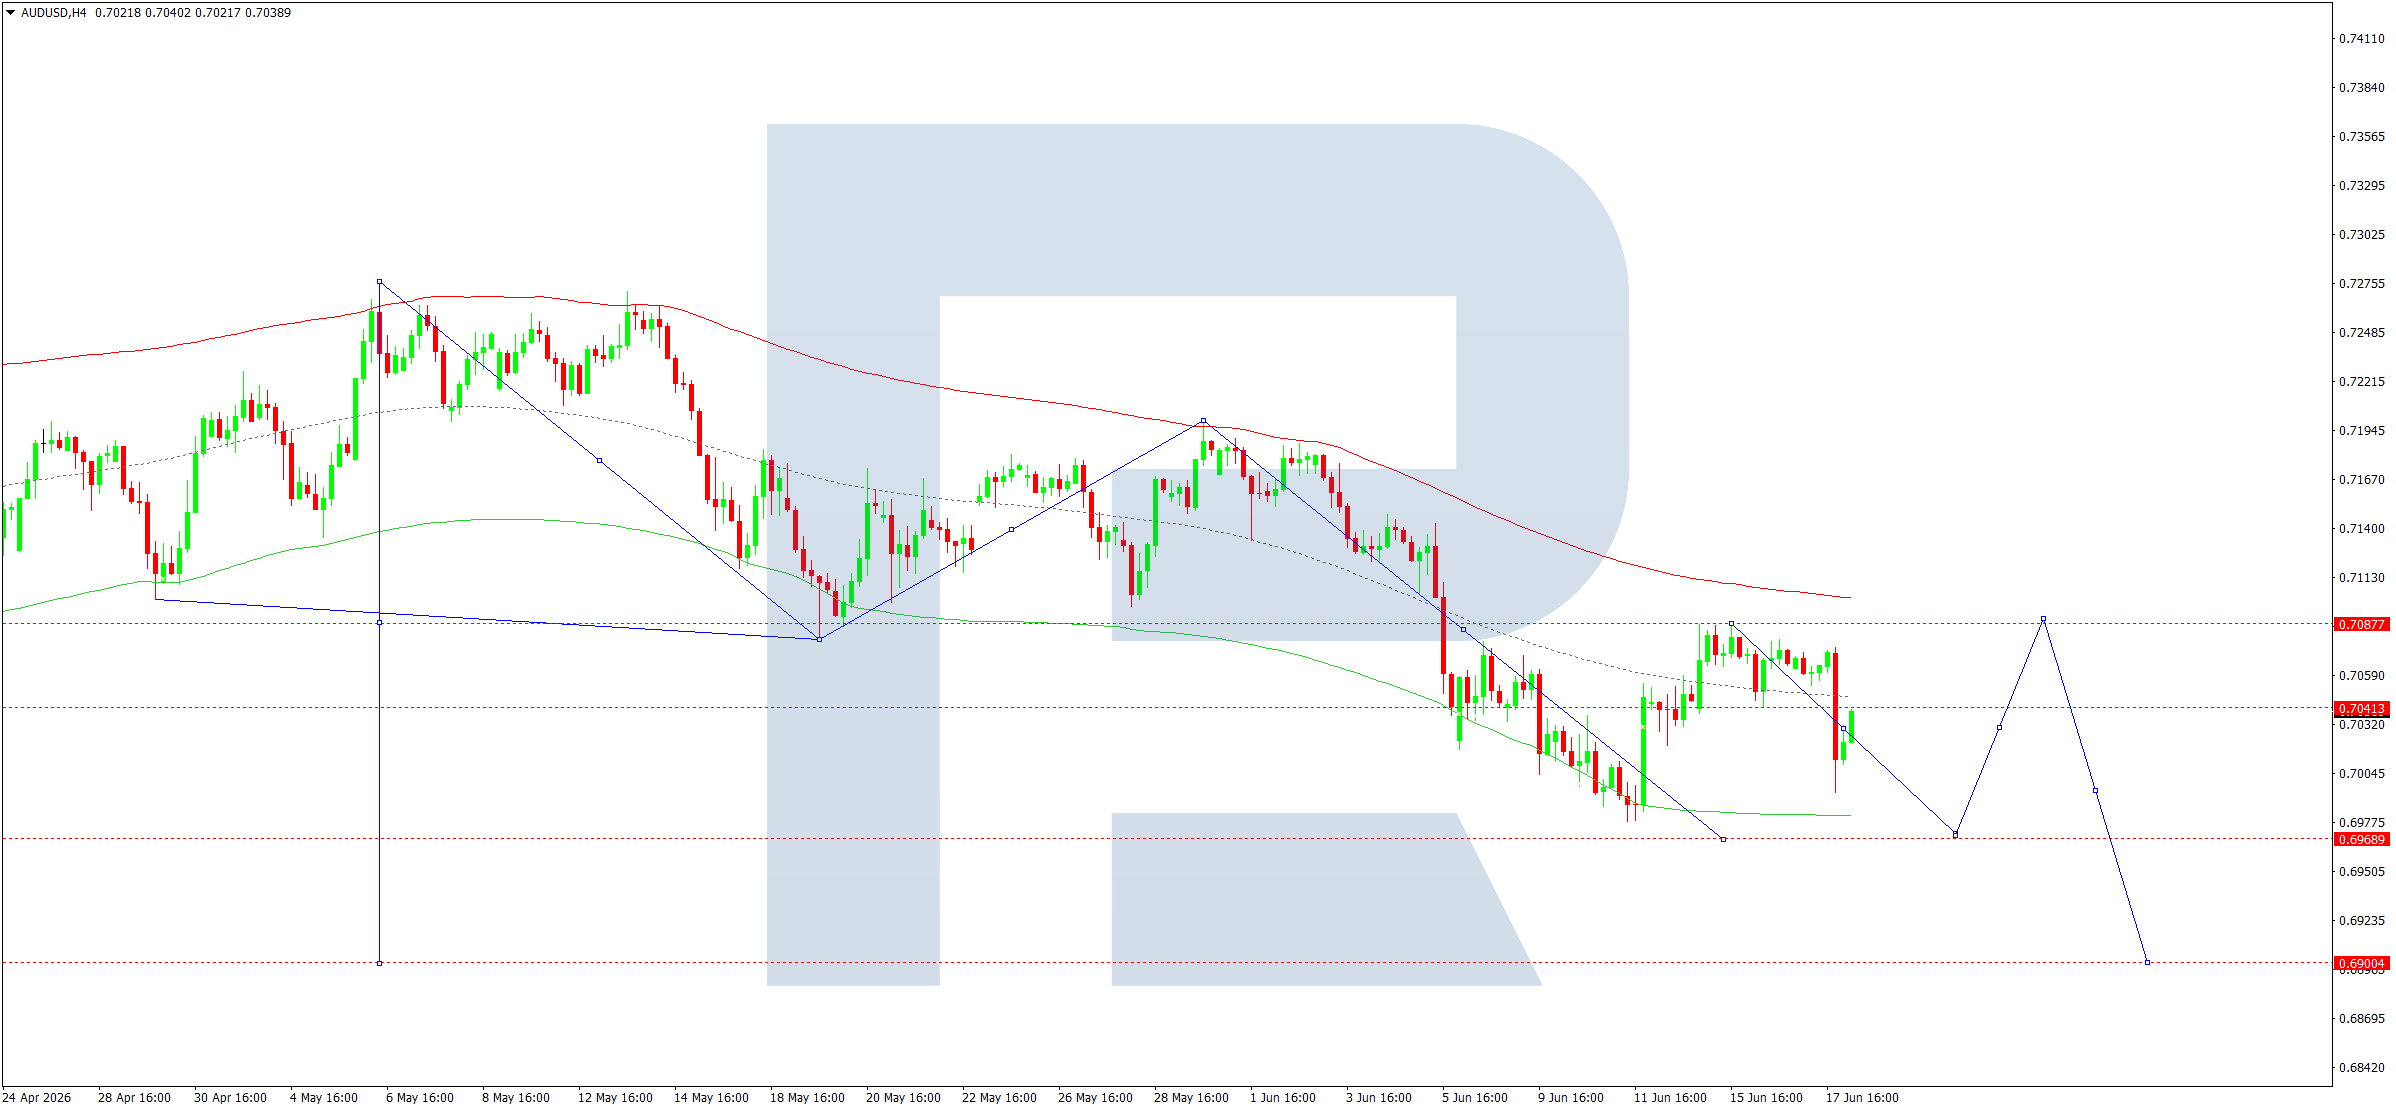
On the H4 chart of AUDUSD, the market completed a growth leg to 0.7040. Today, 18 June 2026, a downward wave structure towards 0.6960 is forming. Afterwards, we expect a growth wave towards 0.7040 and then a decline to 0.6950, with the potential for continuation of the trend towards 0.6900.
Technically, this scenario is confirmed by the indicated Elliott Wave structure and the Wave Matrix of the downward wave for AUDUSD with a pivot centre at 0.7200. It is regarded as the key scenario within this wave structure. At the moment, the market is forming a growth wave towards the central line of the Price Envelope at 0.7040. We then expect the beginning of a decline towards its lower boundary at 0.6900.
Technical indicators for today’s AUDUSD forecast suggest considering the probability of growth towards 0.7040 and the beginning of a decline to 0.6900.
USDCAD forecast
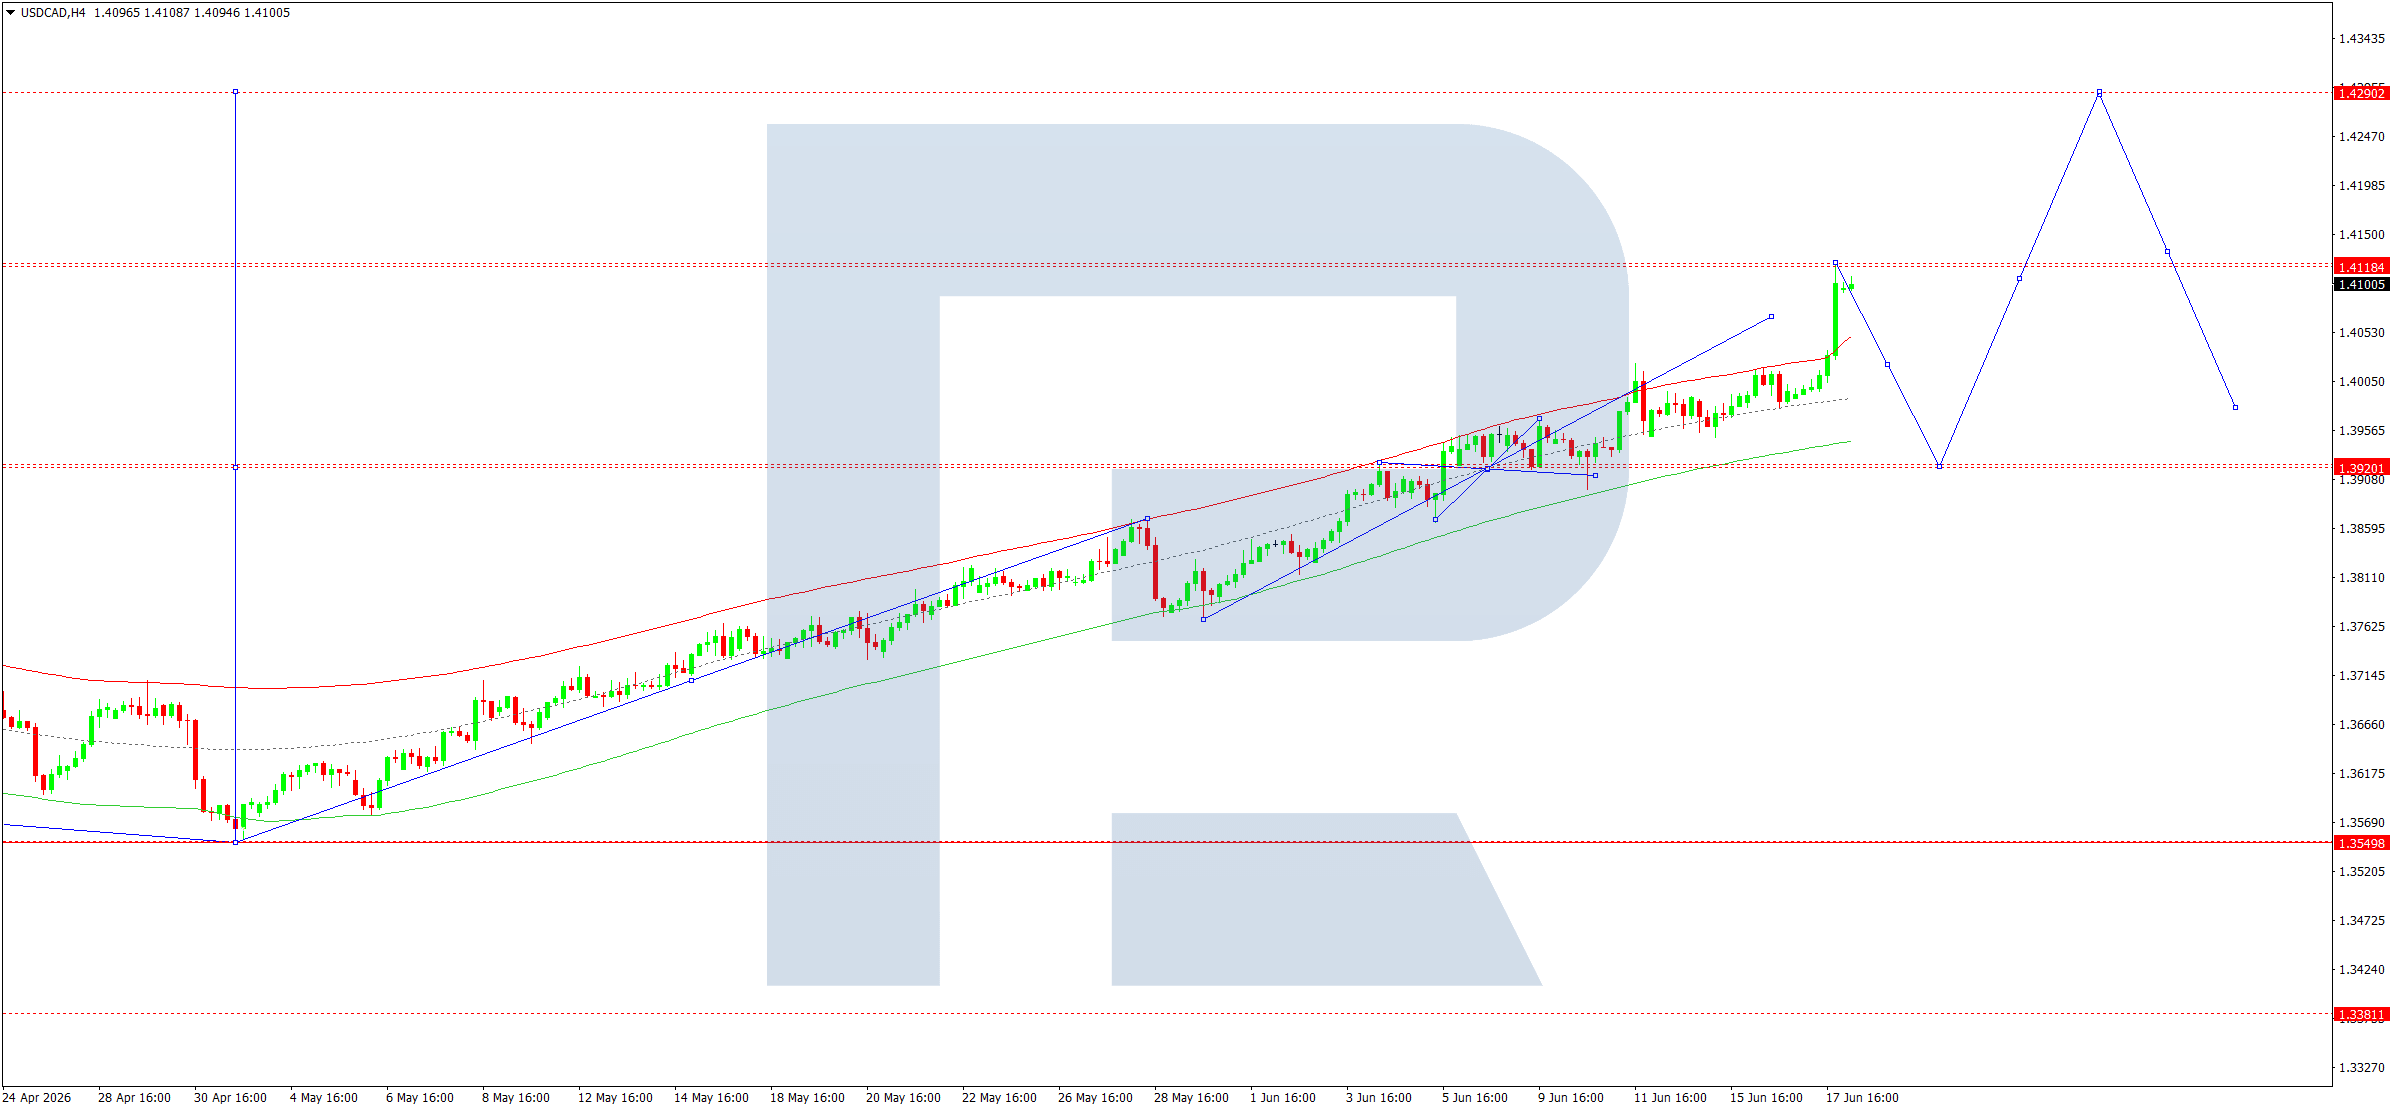
On the H4 chart of USDCAD, the market completed a growth wave to 1.4110. Today, 18 June 2026, we expect a corrective leg towards 1.4040. Afterwards, a growth leg towards 1.4290 cannot be ruled out.
Technically, this scenario is confirmed by the indicated Elliott Wave structure and the Wave Matrix of the growth wave with a pivot centre at 1.3629. It is regarded as the key scenario for USDCAD within the structure of this growth wave. At the moment, the market completed a growth wave structure towards the upper boundary of the Price Envelope at 1.4110. Afterwards, we expect a decline towards its lower boundary at 1.4040.
Technical indicators for today’s USDCAD forecast suggest considering the probability of a correction to 1.4050 and the beginning of growth towards 1.4290.
XAUUSD forecast
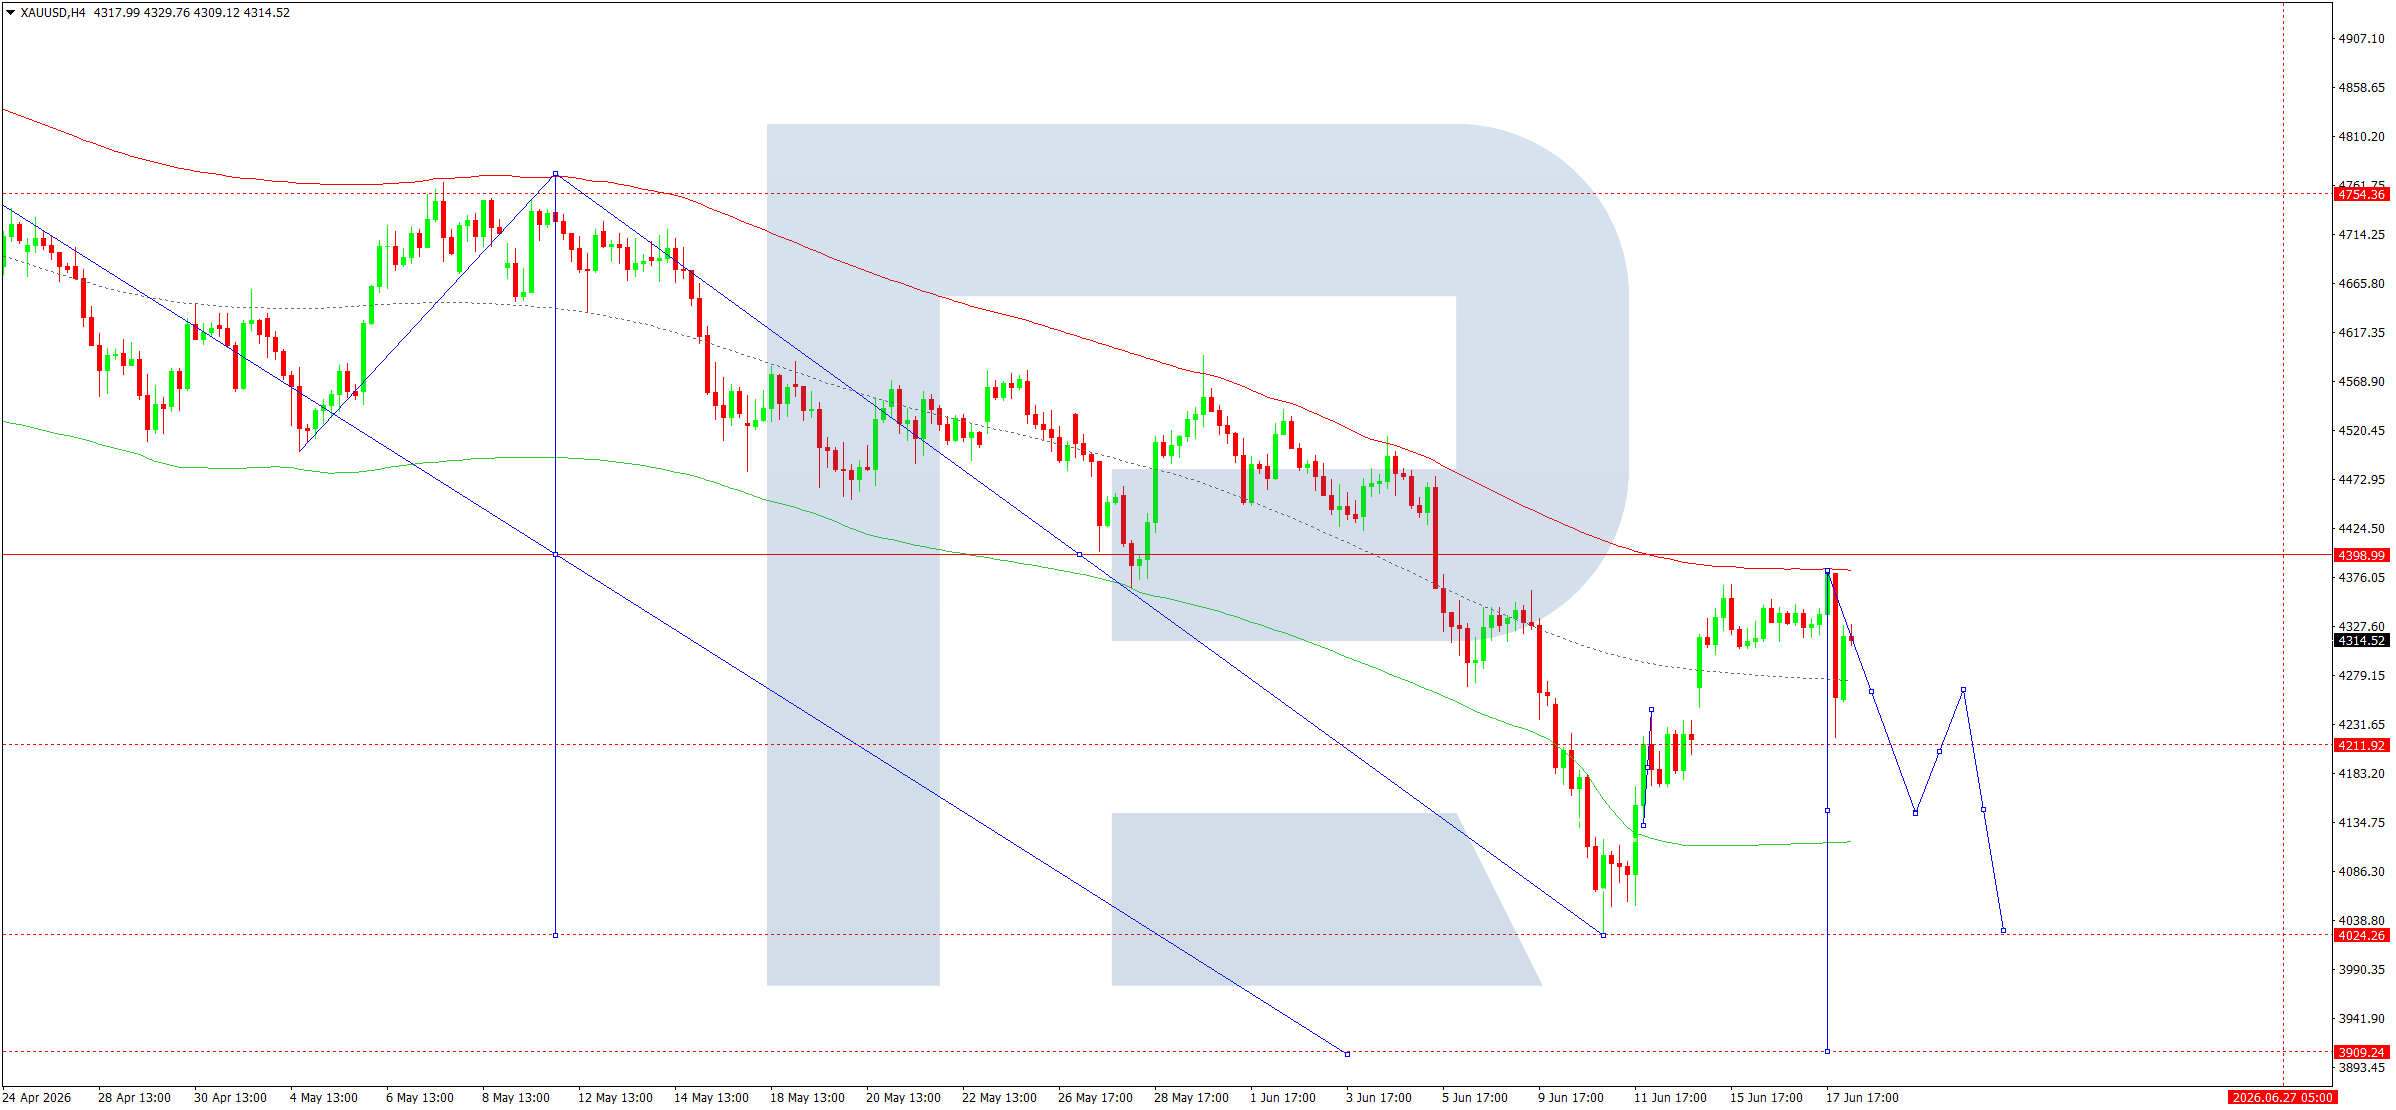
On the H4 chart of XAUUSD, the market completed a growth wave to 4,380 and a downward wave to 4,218. Today, 18 June 2026, we expect a growth structure towards 4,320. Afterwards, we will consider the beginning of a downward wave towards 3,900.
Technically, this scenario is confirmed by the indicated Elliott Wave structure and the Wave Matrix of the downward wave with a pivot centre at 4,550. It is regarded as the key scenario for XAUUSD within this downward wave structure. At the moment, the market completed a growth wave towards the upper boundary of the Price Envelope at 4,380. Afterwards, we expect the formation of a consolidation range below this level. Then a decline towards its lower boundary at 3,900 is expected.
Technical indicators for today’s XAUUSD forecast indicate the probability of the beginning of a decline towards 3,900.
Brent forecast
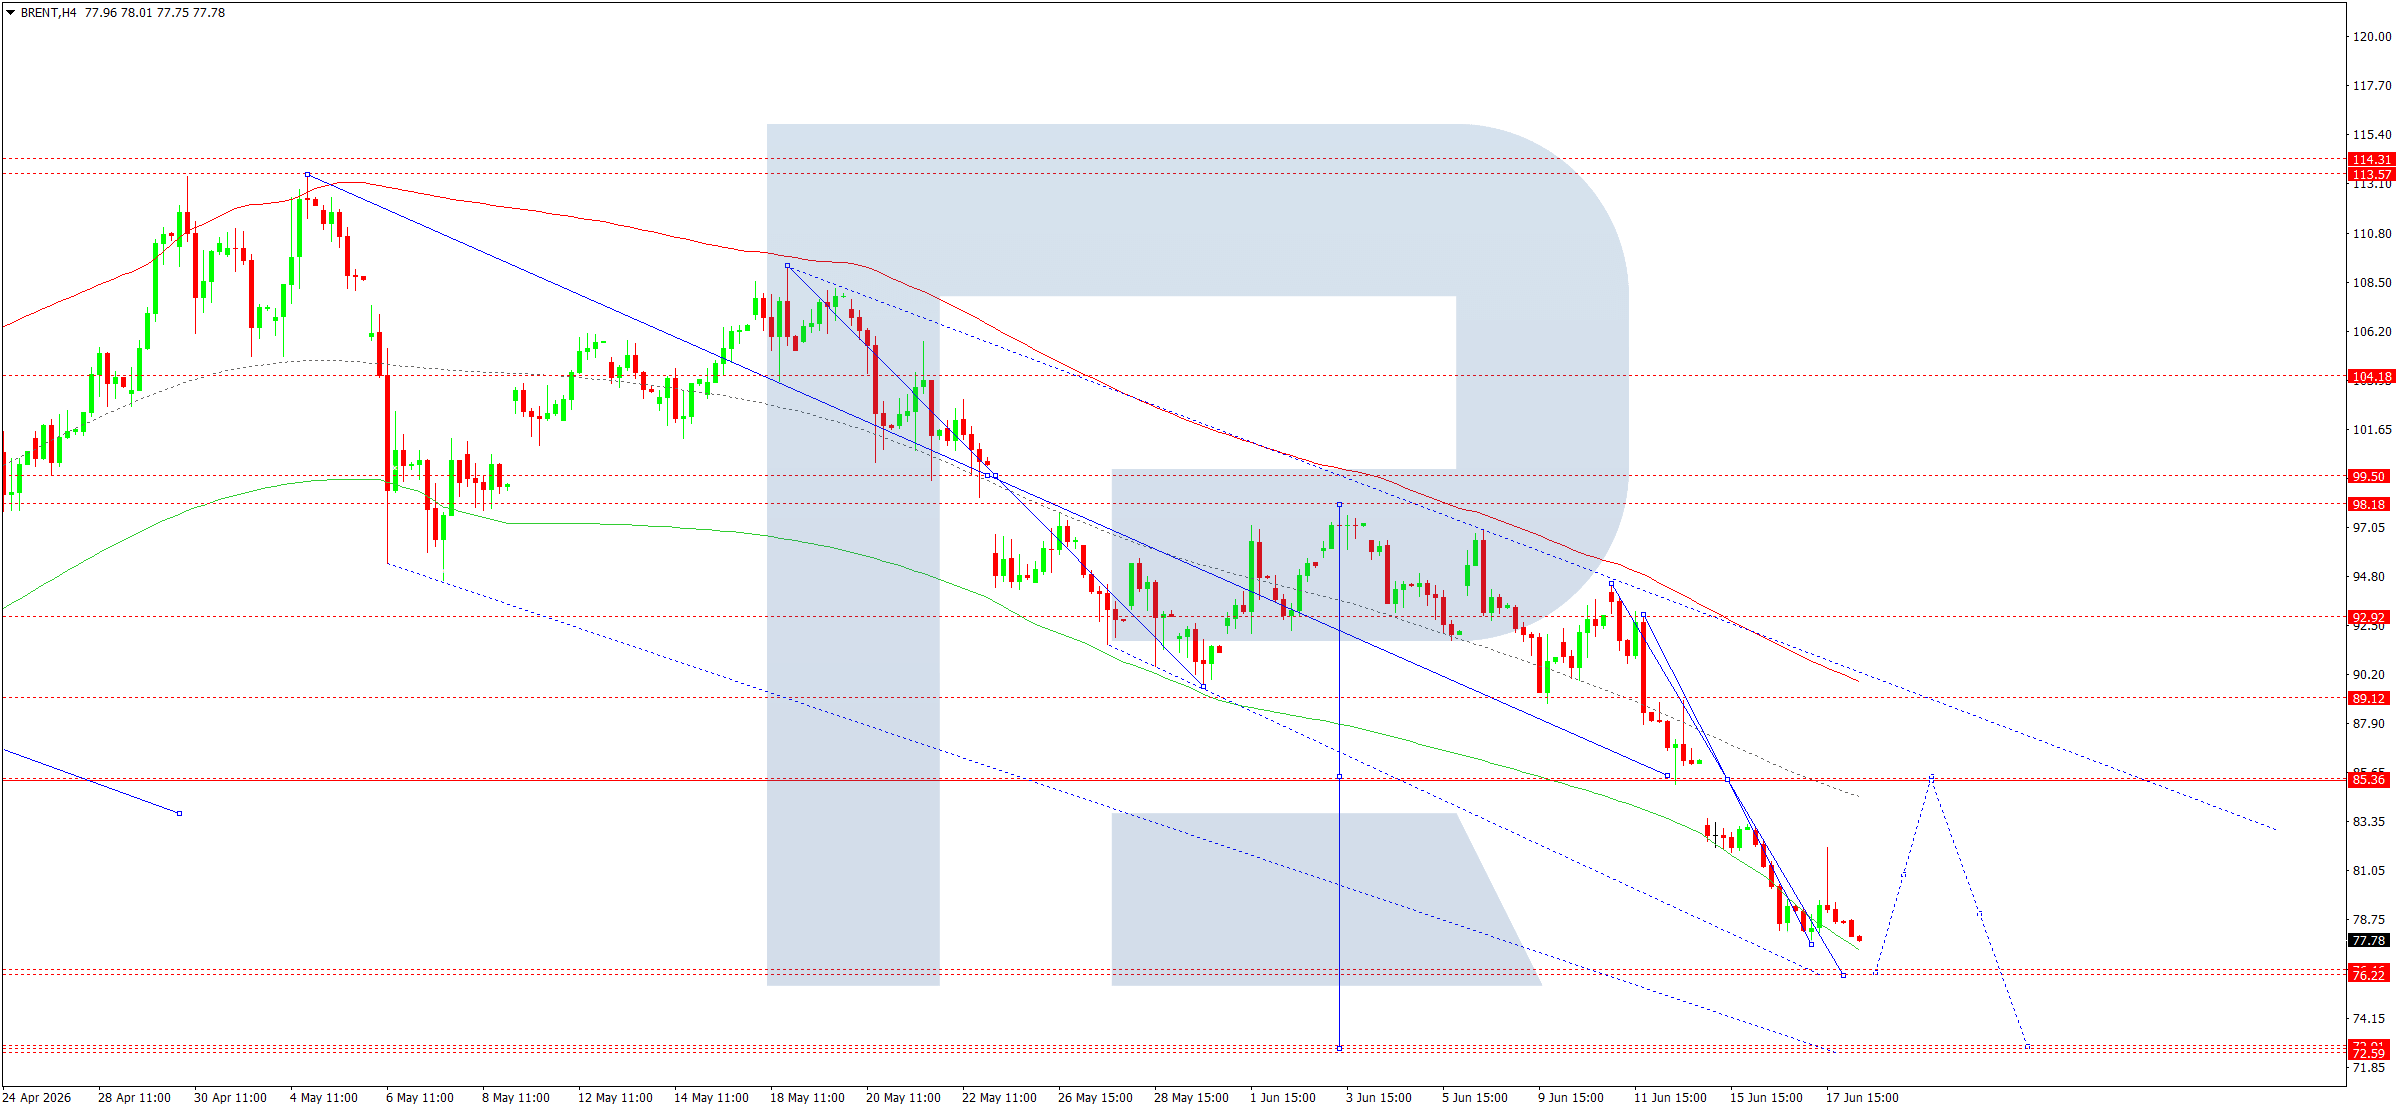
On the H4 chart of Brent crude oil, the market completed a downward wave to 77.60 and then rose to 82.00. Today, 18 June 2026, we will consider the development of a consolidation range below this level. If the price breaks below the range, an extension of the wave towards 76.22 cannot be ruled out. Afterwards, growth towards 85.50 is expected, with the potential for the wave to continue towards 99.00.
Technically, this scenario is confirmed by the indicated Elliott Wave structure and the growth wave matrix with a pivot centre at 98.00. It is regarded as the key scenario for Brent within this wave structure. At the moment, the market is forming a consolidation range above the lower boundary of the Price Envelope at 77.50. An extension of the range downwards to 76.22 cannot be ruled out. Afterwards, growth towards 85.50 is expected.
Technical indicators suggest considering, in today’s Brent forecast, the beginning of growth towards 85.50.
BTCUSD forecast
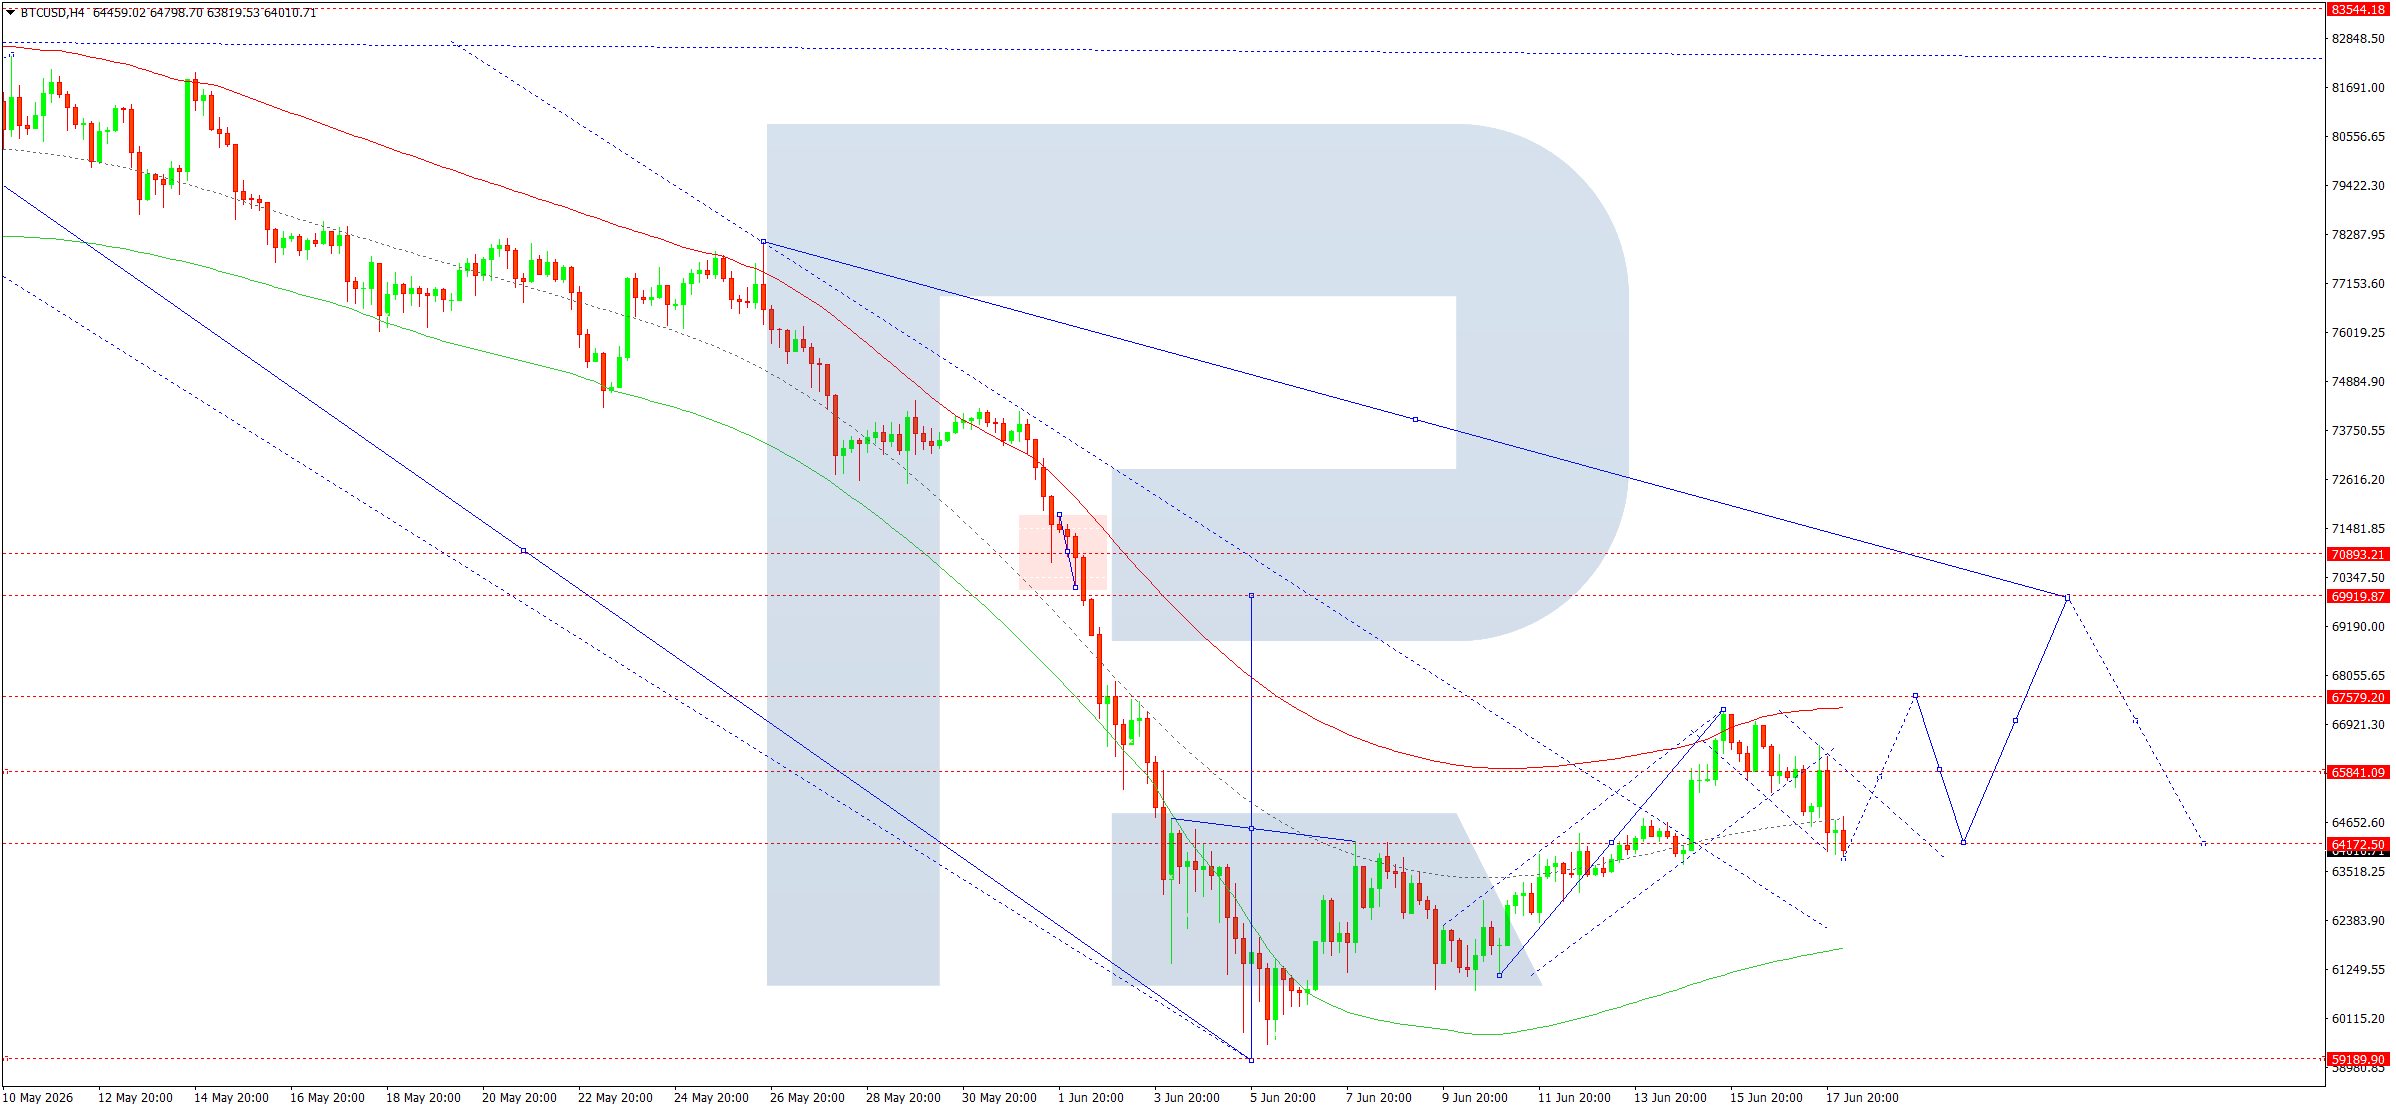
On the H4 chart of BTCUSD, the market completed a downward wave to 63,600 and is forming a consolidation range above it. Today, 18 June 2026, we will consider the beginning of a growth wave towards 67,577. If this level is broken, the potential for a wave towards 69,900 will open. This is a local target.
Technically, this scenario is confirmed by the indicated Elliott Wave structure and the growth wave matrix with a pivot centre at 71,000. It is regarded as the key scenario for BTCUSD within this wave structure. At the moment, the market completed a corrective wave towards the lower boundary of the Price Envelope at 63,600. Afterwards, we expect growth towards its upper boundary at 67,577.
Technical indicators suggest considering, in today’s BTCUSD forecast, continuation of the growth wave towards 67,577.
Editors’ picks
 EURUSD forecast 2026–2027: technical analysis, price levels & predictions
The ECB holds rates at 2.15% while the Fed stays at 3.75% — and that divergence is the central driver of EURUSD in 2026. The pair is range-bound between 1.1400 and 1.1915, with Deutsche Bank targeting 1.2500 and Morgan Stanley calling for 1.3000 by year-end. We analyse the technicals, break down the macro factors, and outline three trading scenarios with specific entry levels.
 Gold (XAUUSD) forecast 2026: predictions based on fundamental and technical analysis
Where is gold headed after pulling back from the all-time high of 5,597 USD? XAUUSD is consolidating near 4,518 USD between key levels 4,220 USD and 4,855 USD, with major banks targeting 5,243–6,200 USD by year-end. Read our comprehensive gold forecast: technical analysis across three timeframes, trading scenarios with specific entry levels, Fed policy and central bank demand outlook, and institutional predictions for 2026 and beyond.
Forecasts presented in this section only reflect the author’s private opinion and should not be considered as guidance for trading. RoboForex bears no responsibility for trading results based on trading recommendations described in these analytical reviews.