Daily technical analysis and forecast for 23 June 2026
Here is a detailed daily technical analysis and forecast for EURUSD, USDJPY, GBPUSD, AUDUSD, USDCAD, XAUUSD, Brent and BTCUSD for 23 June 2026.
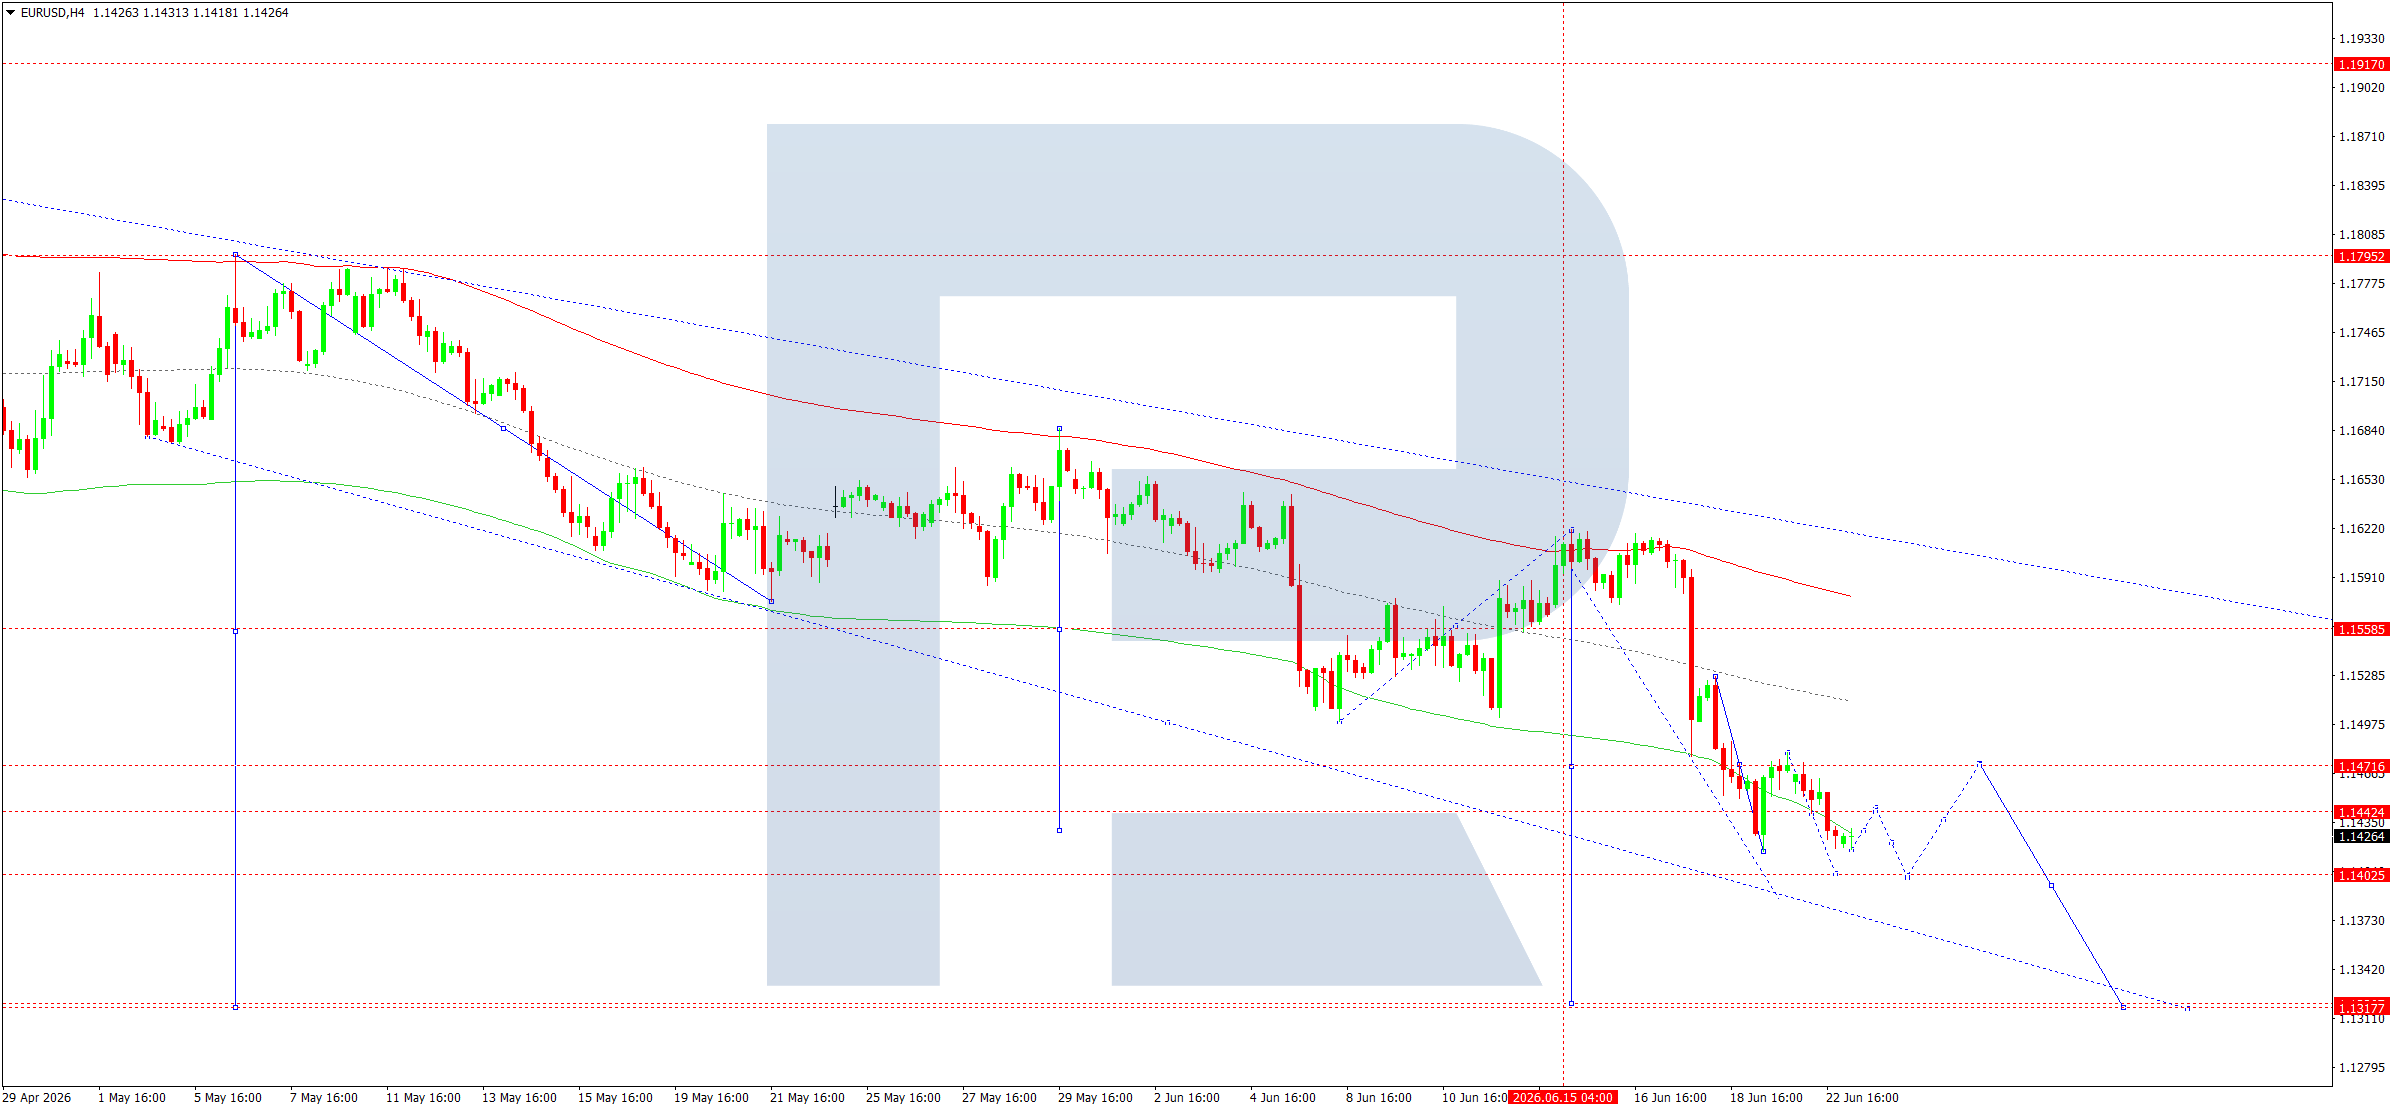
EURUSD forecast
On the EURUSD H4 chart, the market continues to develop a consolidation range around 1.1444. Today, 23 June 2026, the range has extended downwards to 1.1418. Next, an upward move towards 1.1444 (a retest from below) is possible. Afterwards, a decline towards 1.1402 is expected.
Technically, this scenario is confirmed by the indicated Elliott wave structure and the wave matrix with a pivot point at 1.1680, a key level in the EURUSD downward wave structure. At the moment, the market has completed a downward wave towards the lower boundary of the Price Envelope at 1.1418. An upward move towards its central line at 1.1444 is expected. Afterwards, the price could decline towards its lower boundary at 1.1402, possibly edging lower towards 1.1318.
Technical indicators for today’s EURUSD forecast suggest a decline in line with the trend towards 1.1402.
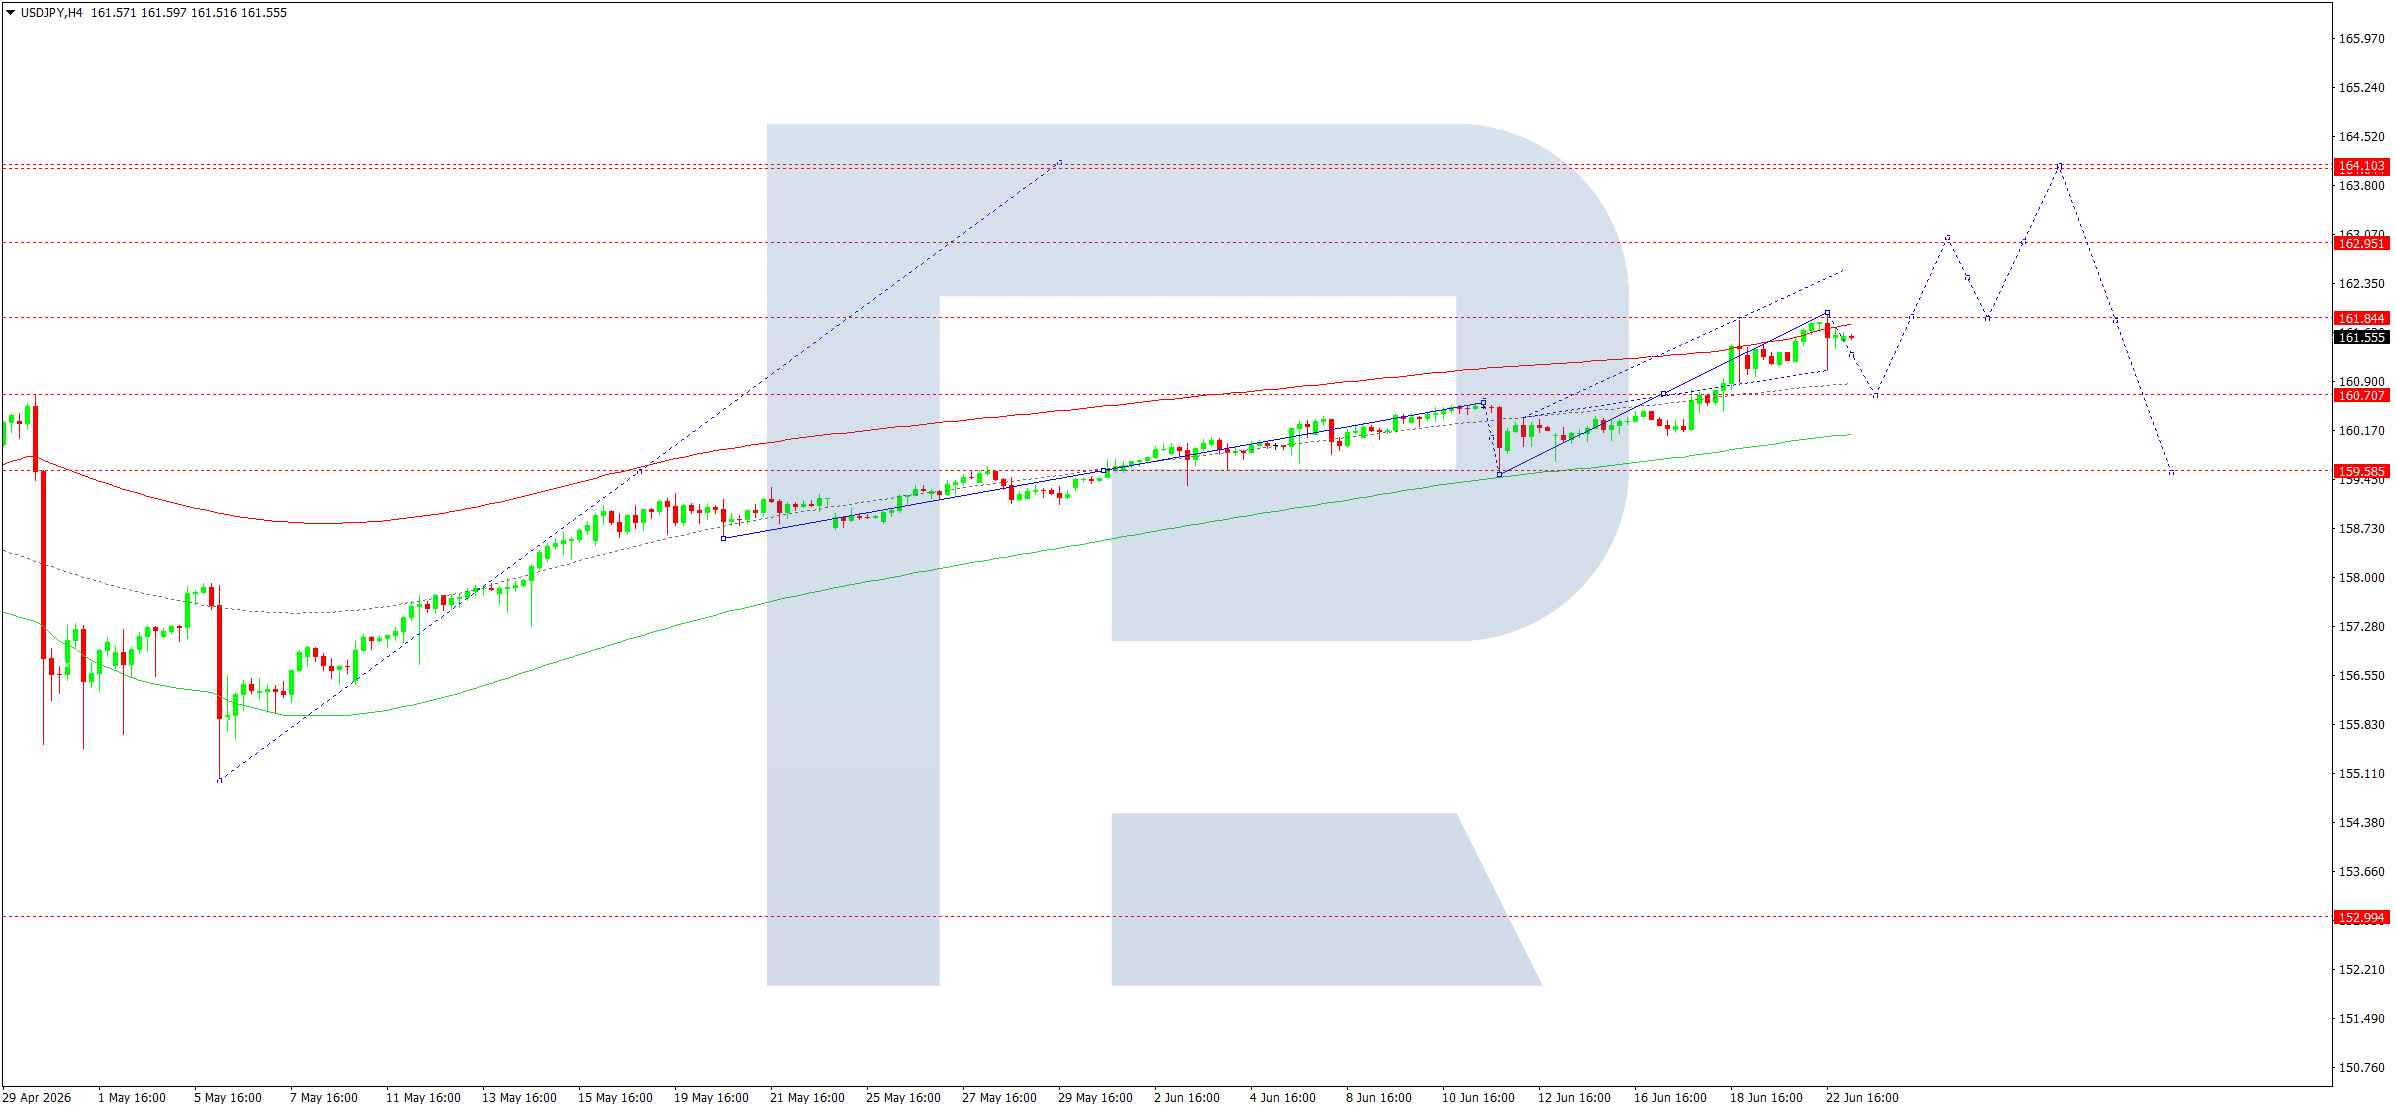
USDJPY forecast
On the USDJPY H4 chart, the market found support at 161.07 and completed an upward wave towards 161.63. Today, 23 June 2026, the price is expected to break above this level and continue its upward trajectory towards 161.88. A breakout above this level would open the potential for growth towards 162.90.
Technically, this scenario for USDJPY is confirmed by the indicated Elliott wave structure and the upward wave matrix with a pivot point at 159.10, a key level in this wave structure. At the moment, the market found support at 161.07 and continues the upward wave towards the upper boundary of the Price Envelope at 162.90. Afterwards, a new consolidation range is expected to develop below this level. A breakout below the range would open the potential for a decline towards its lower boundary at 161.00. Alternatively, an upward breakout would open the way towards its upper boundary at 164.10.
Technical indicators for today’s USDJPY forecast suggest growth towards 162.90.
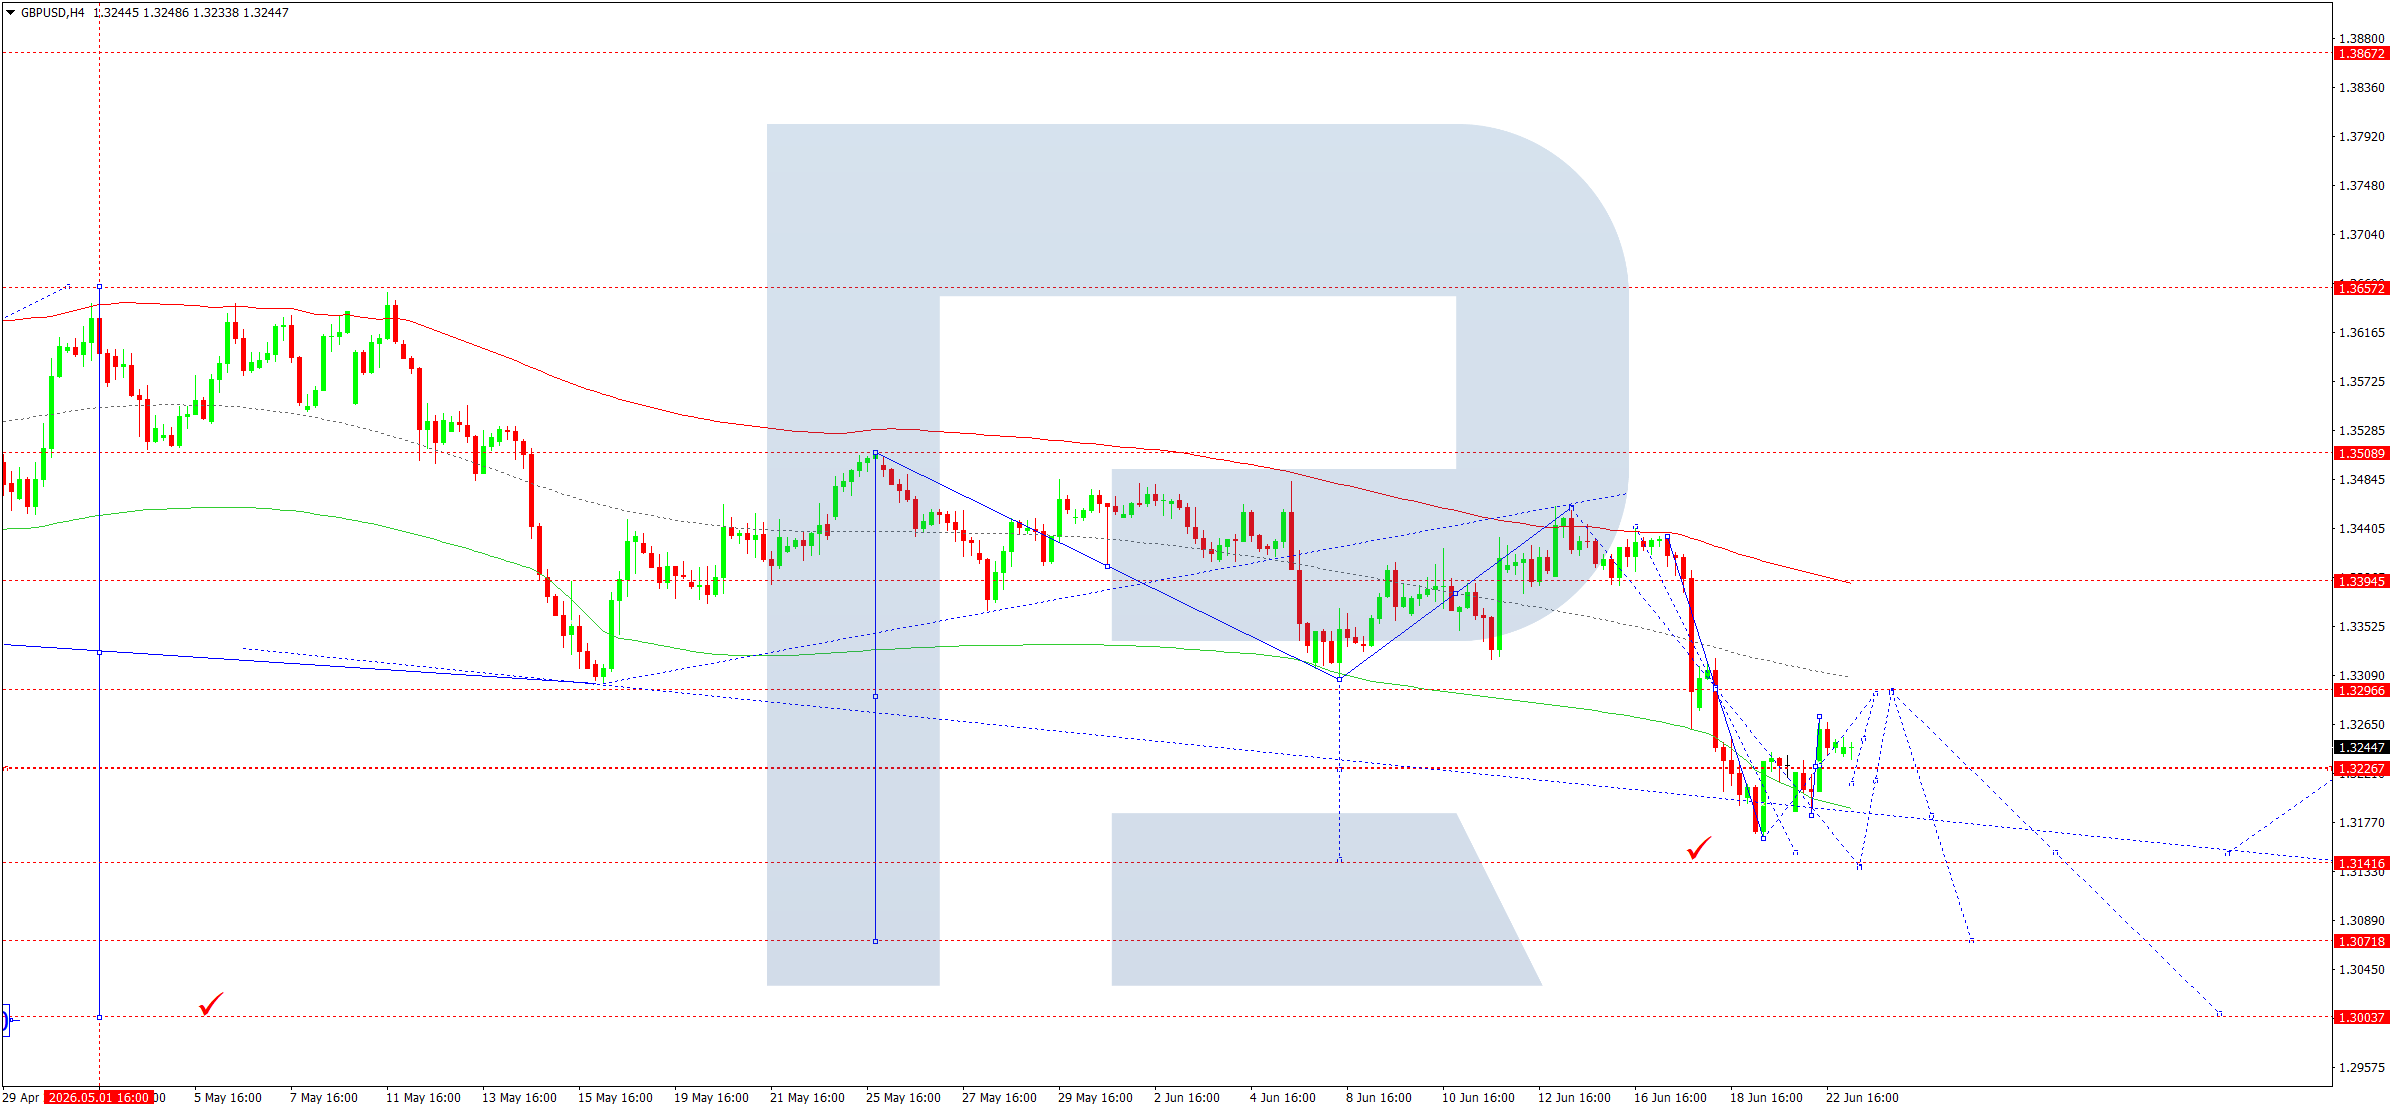
GBPUSD forecast
On the GBPUSD H4 chart, the market is forming a consolidation range around 1.3226, which could expand upwards to 1.3295 today, 23 June 2026. Afterwards, a decline towards 1.3145 is expected, with the potential for the trend to continue towards 1.3070.
Technically, this scenario for GBPUSD is confirmed by the indicated Elliott wave structure and the downward wave matrix with a pivot point at 1.3398, a key level in this wave structure. Today, we expect an upward wave towards the central line of the Price Envelope at 1.3295. Afterwards, a downward move towards its lower boundary at 1.3141 is expected. This is a local target.
Technical indicators for today’s GBPUSD forecast suggest a decline towards 1.3141.
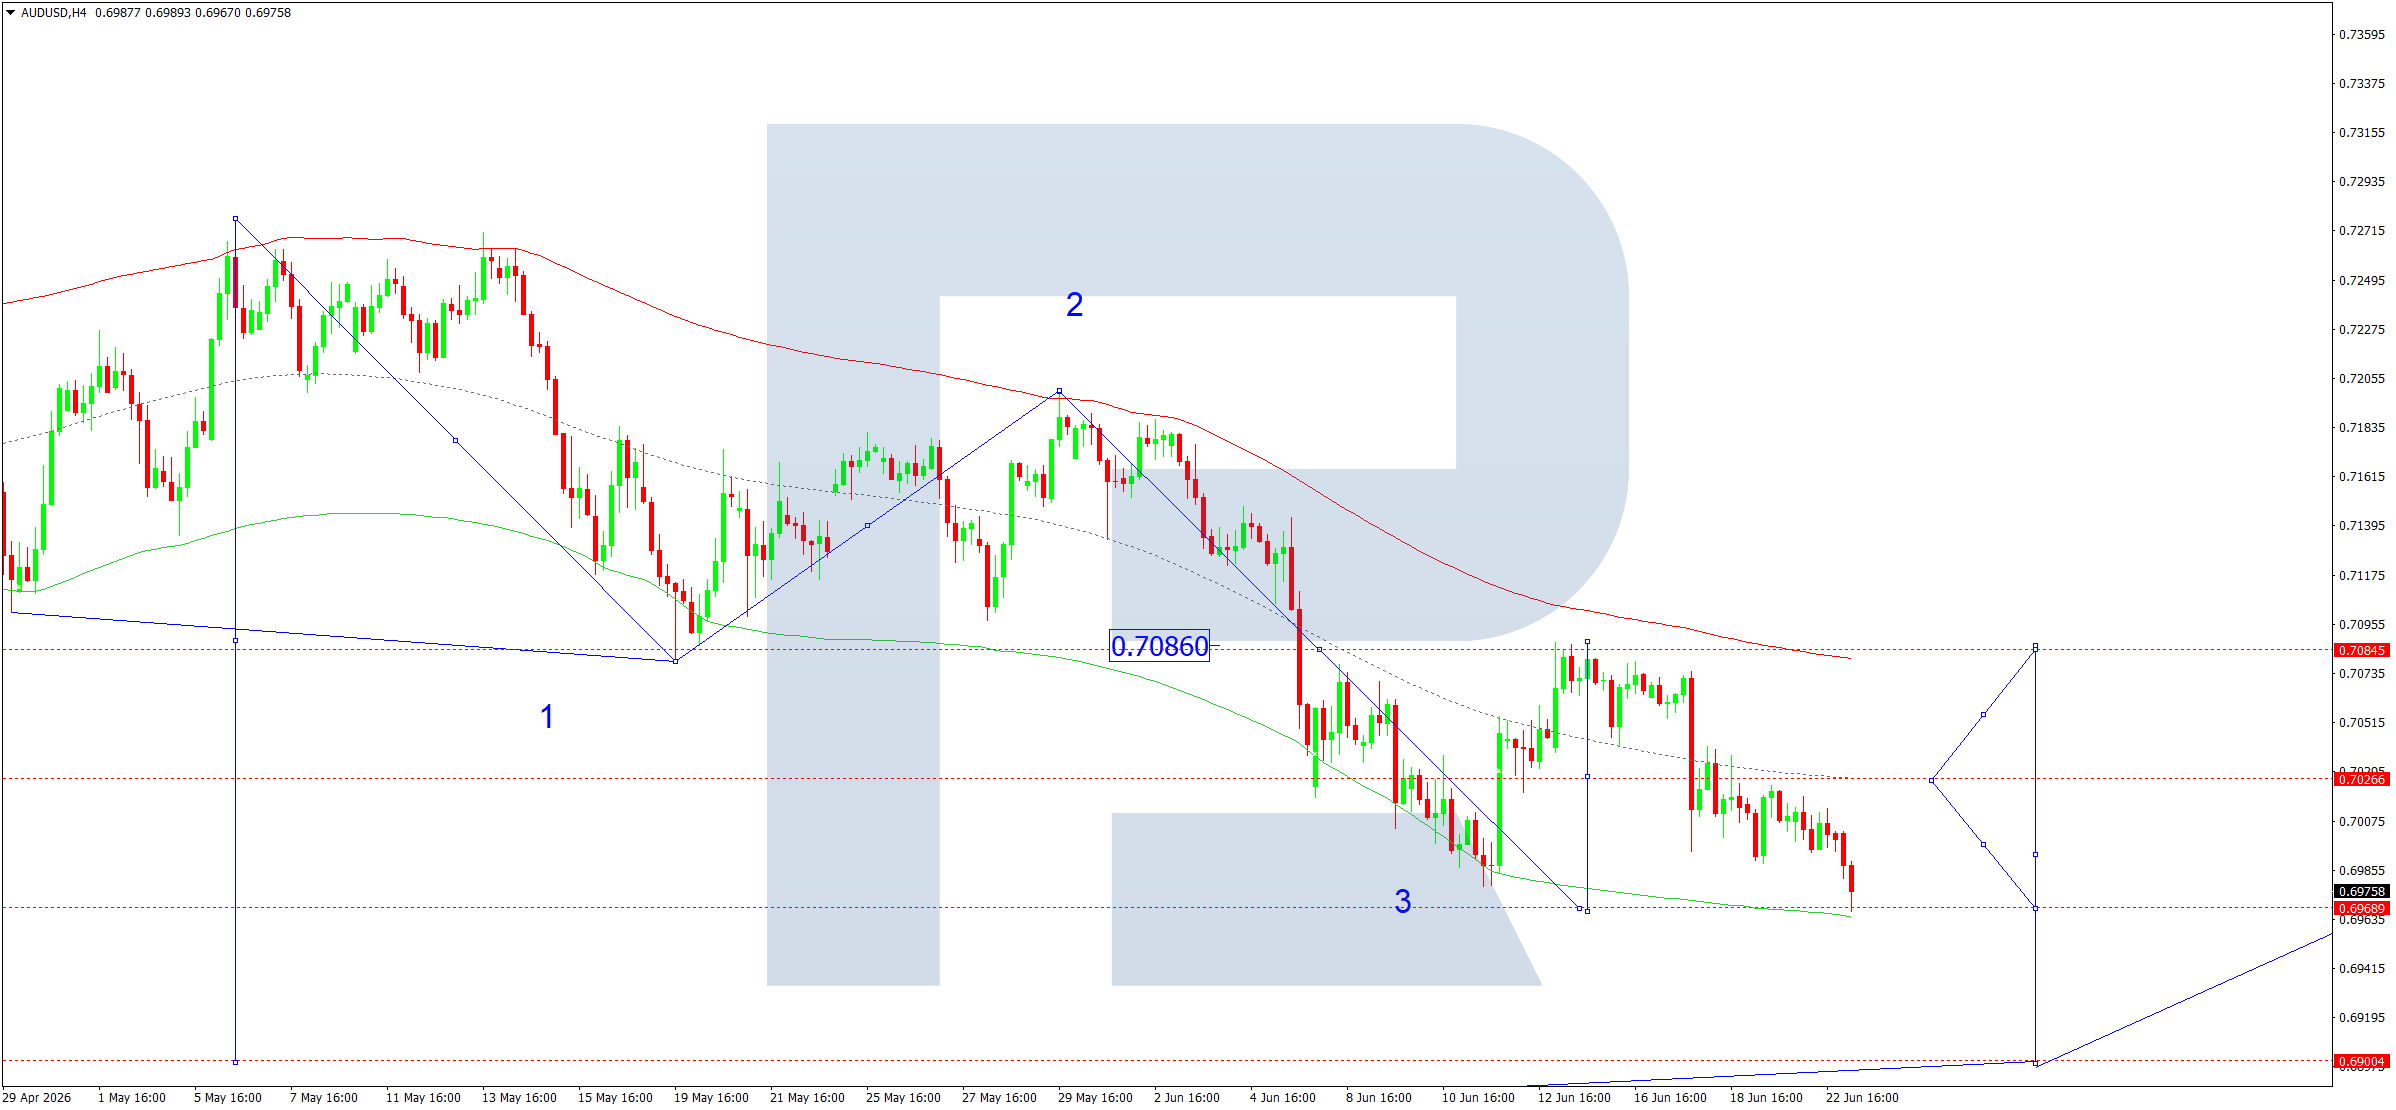
AUDUSD forecast
On the AUDUSD H4 chart, the market completed a downward wave towards 0.6969. Today, 23 June 2026, a consolidation range is expected to develop above this level. An upward breakout would open the door for a correction towards 0.7027. If the price breaks downwards, the downward wave is expected to continue towards 0.6900.
Technically, this scenario is confirmed by the indicated Elliott wave structure and the downward wave matrix for AUDUSD with a pivot point at 0.7200, a key level in this wave structure. At the moment, the market has completed a downward wave towards the lower boundary of the Price Envelope at 0.6969. Growth towards its central line at 0.7027 is expected.
Technical indicators for today’s AUDUSD forecast suggest the pair could start to rise towards 0.7027.
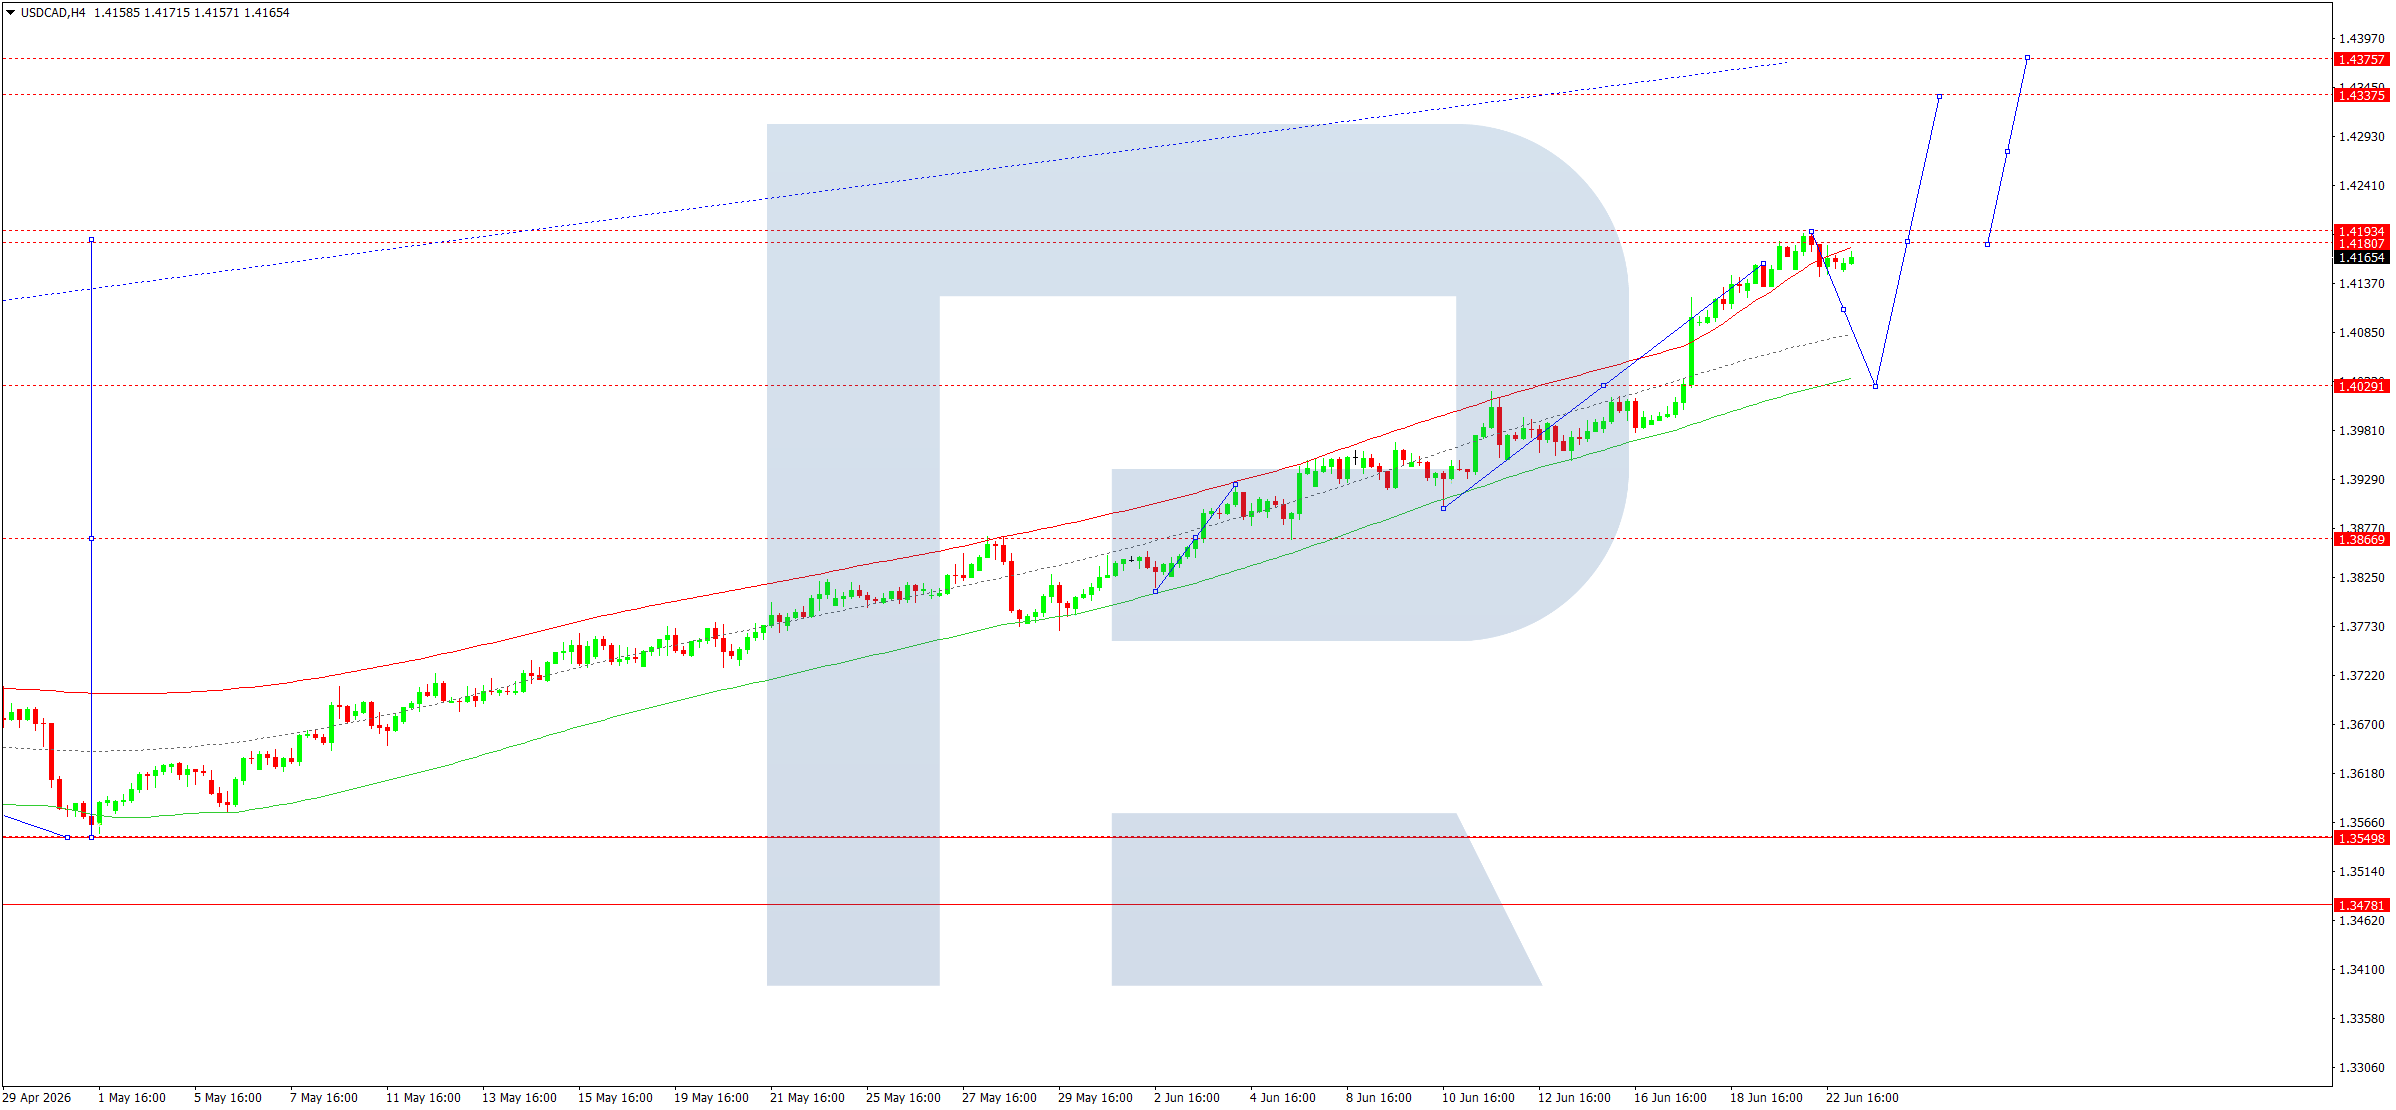
USDCAD forecast
On the USDCAD H4 chart, the market completed an upward wave towards 1.4192 and a correction to 1.4142. Today, 23 June 2026, an upward move towards 1.4222 is expected, with the potential for the trend to continue towards 1.4377.
Technically, this scenario is confirmed by the indicated Elliott wave structure and the upward wave matrix with a pivot point at 1.3629, a key level for USDCAD in this upward wave structure. At the moment, the market completed an upward wave towards the upper boundary of the Price Envelope at 1.4192. Subsequently, the price could move lower towards its central line at 1.4142 before rising towards its upper boundary at 1.4377.
Technical indicators for today’s USDCAD forecast suggest growth towards 1.4377.
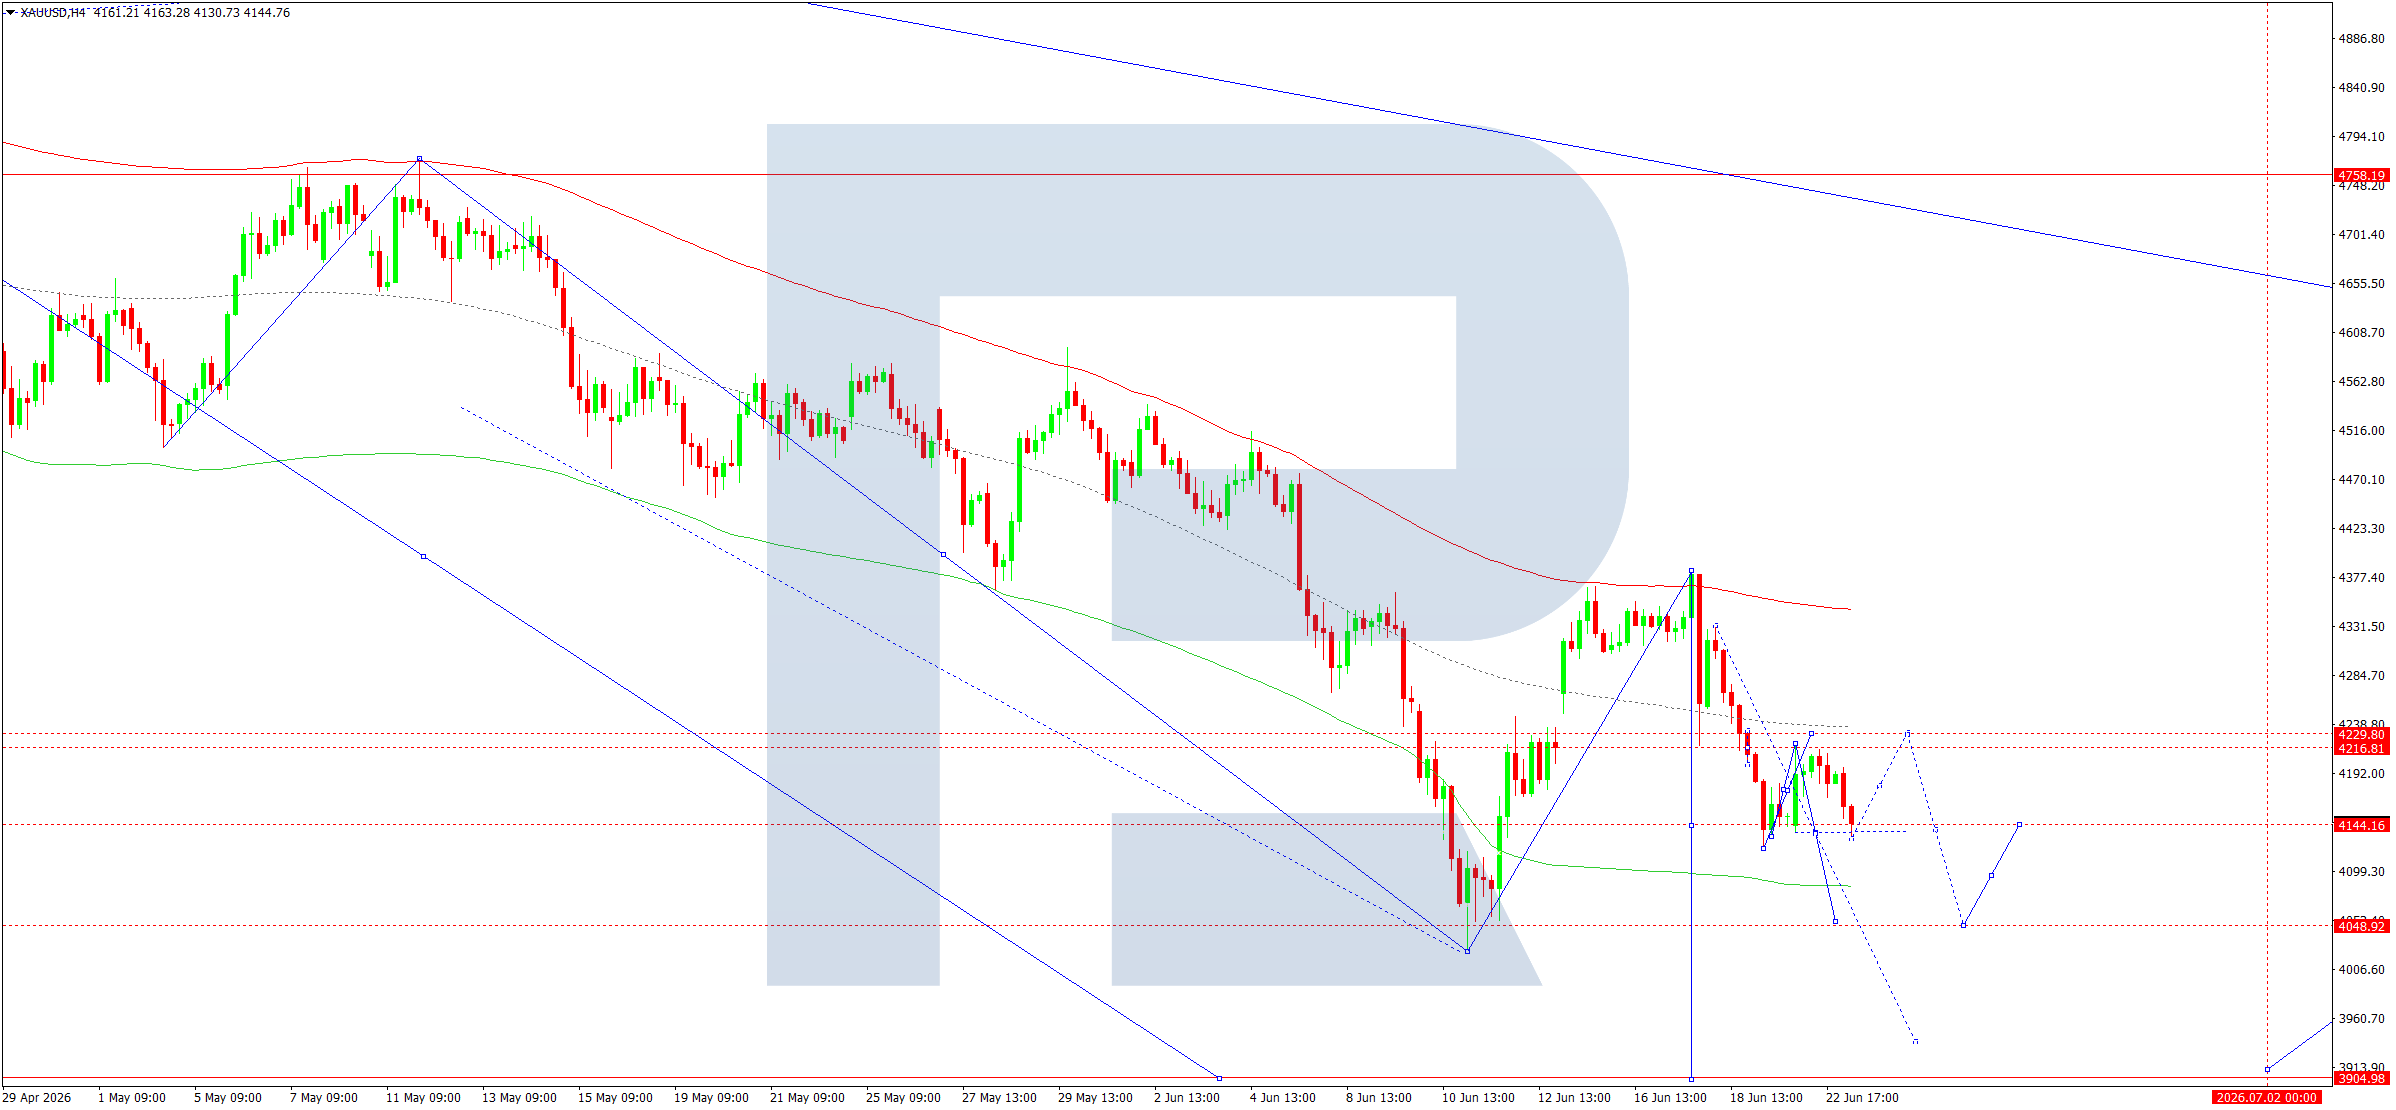
XAUUSD forecast
On the XAUUSD H4 chart, the market completed an upward wave towards 4,222 and a downward wave towards 4,120. Today, 23 June 2026, the downward wave is expected to continue towards 4,040, a local target.
Technically, this scenario is confirmed by the indicated Elliott wave structure and the downward wave matrix with a pivot point at 4,550, a key level for XAUUSD in this downward wave structure. At the moment, the market completed an upward wave towards the central line of the Price Envelope at 4,120. Afterwards, a decline towards its lower boundary at 4,040 is expected.
Technical indicators for today’s XAUUSD forecast suggest a drop towards 4,040.
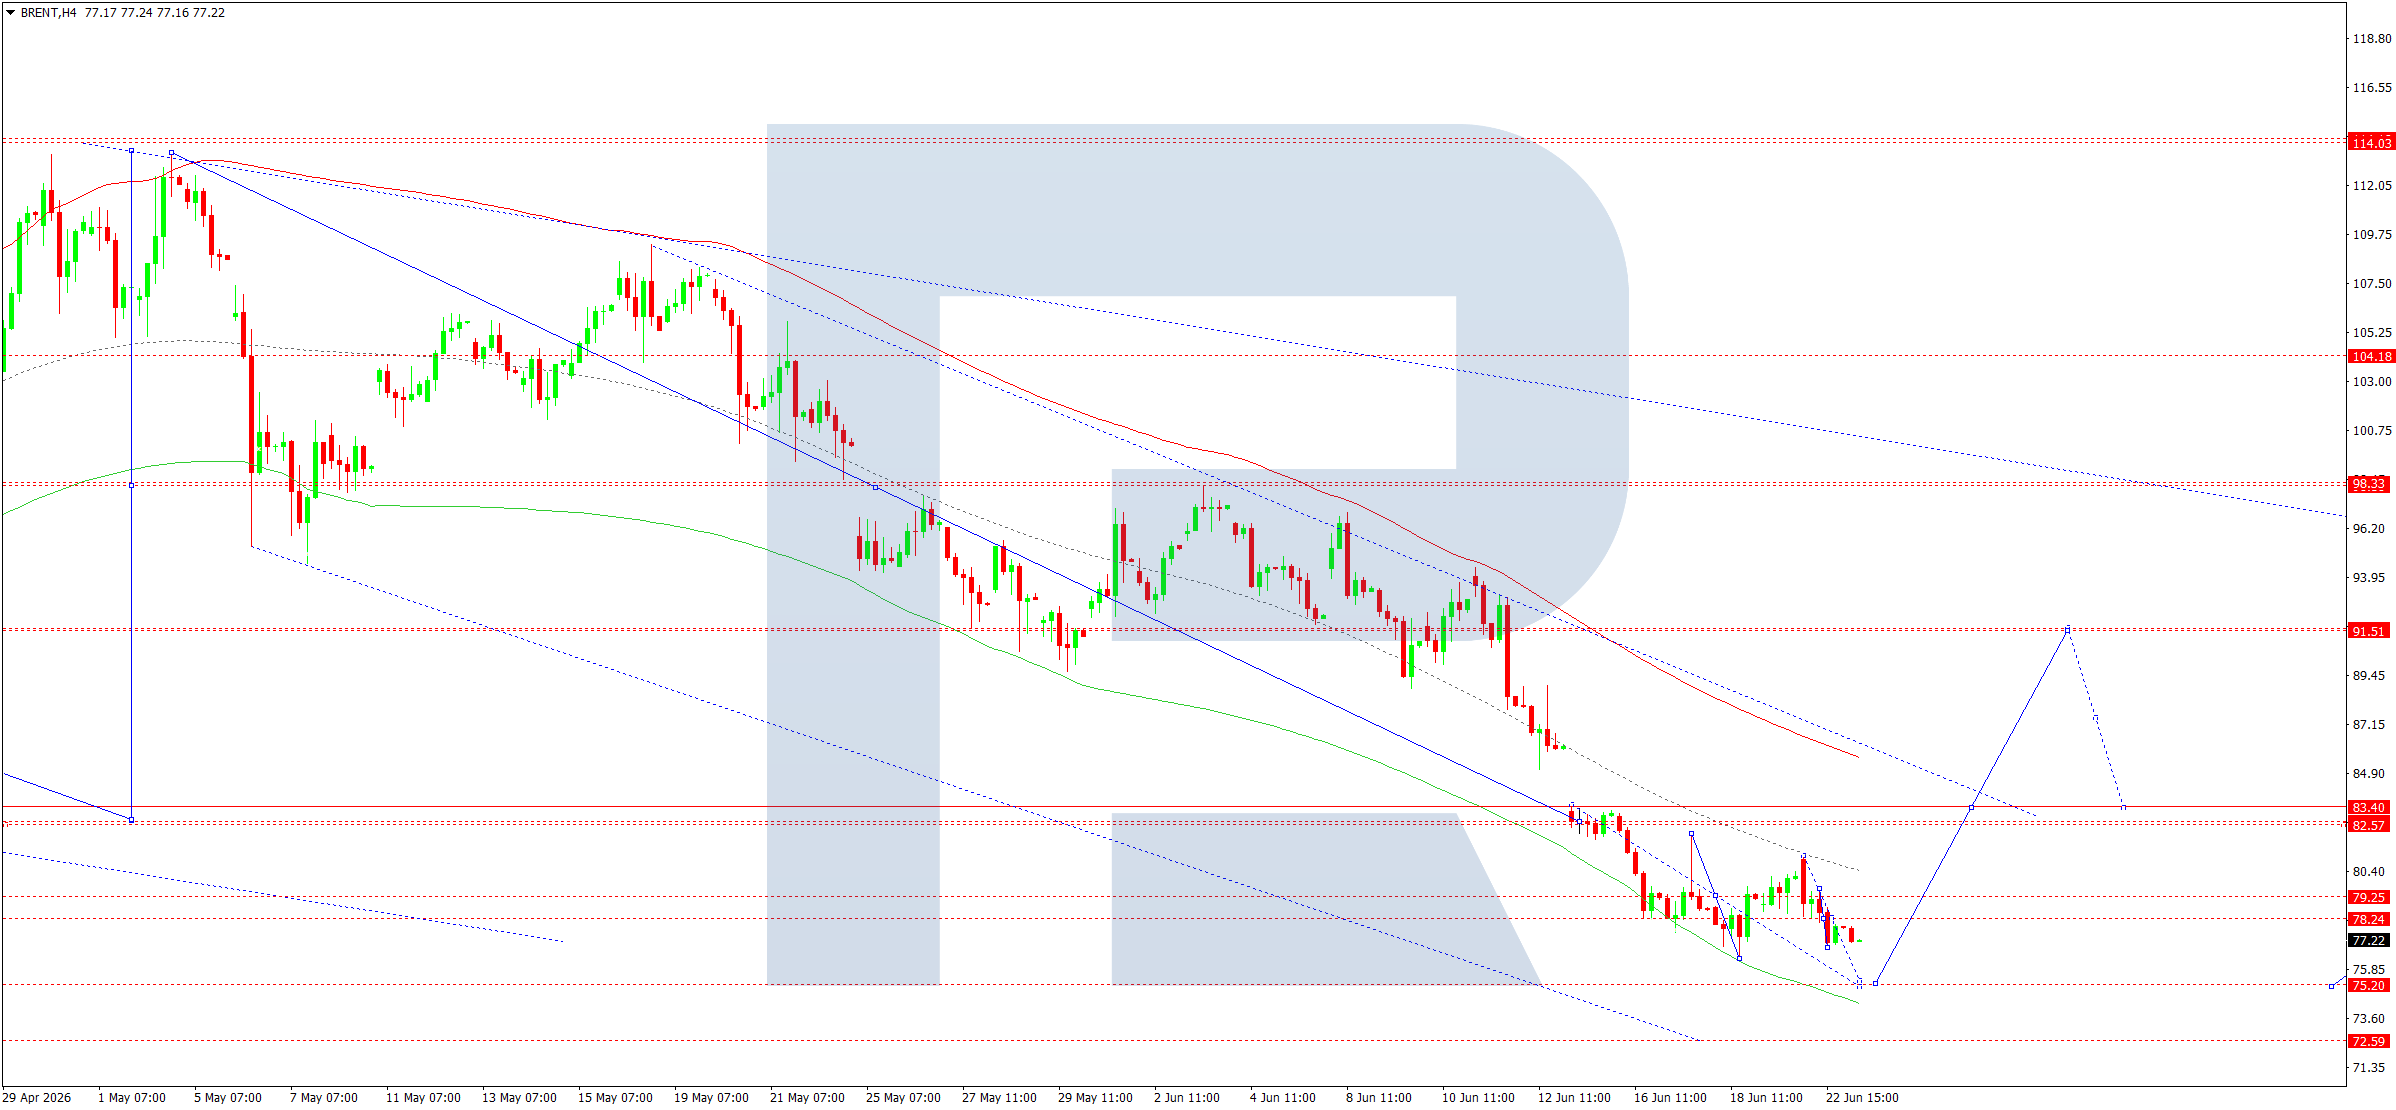
Brent forecast
On the Brent H4 chart, the market completed a downward wave towards 78.28. Today, 23 June 2026, a consolidation range could develop around this level. If prices break below the range, the wave could expand towards 75.20. Afterwards, growth towards 83.40 is expected, with the potential for the wave to continue towards 91.50.
Technically, this scenario is confirmed by the indicated Elliott wave structure and the upward wave matrix with a pivot point at 98.00, a key level for Brent in this wave structure. At the moment, the market is forming a consolidation range around the lower boundary of the Price Envelope at 78.28, which could expand downwards to 75.20. Afterwards, growth to 83.40 is expected.
Technical indicators for today’s Brent forecast suggest prices could start to climb towards 83.40.
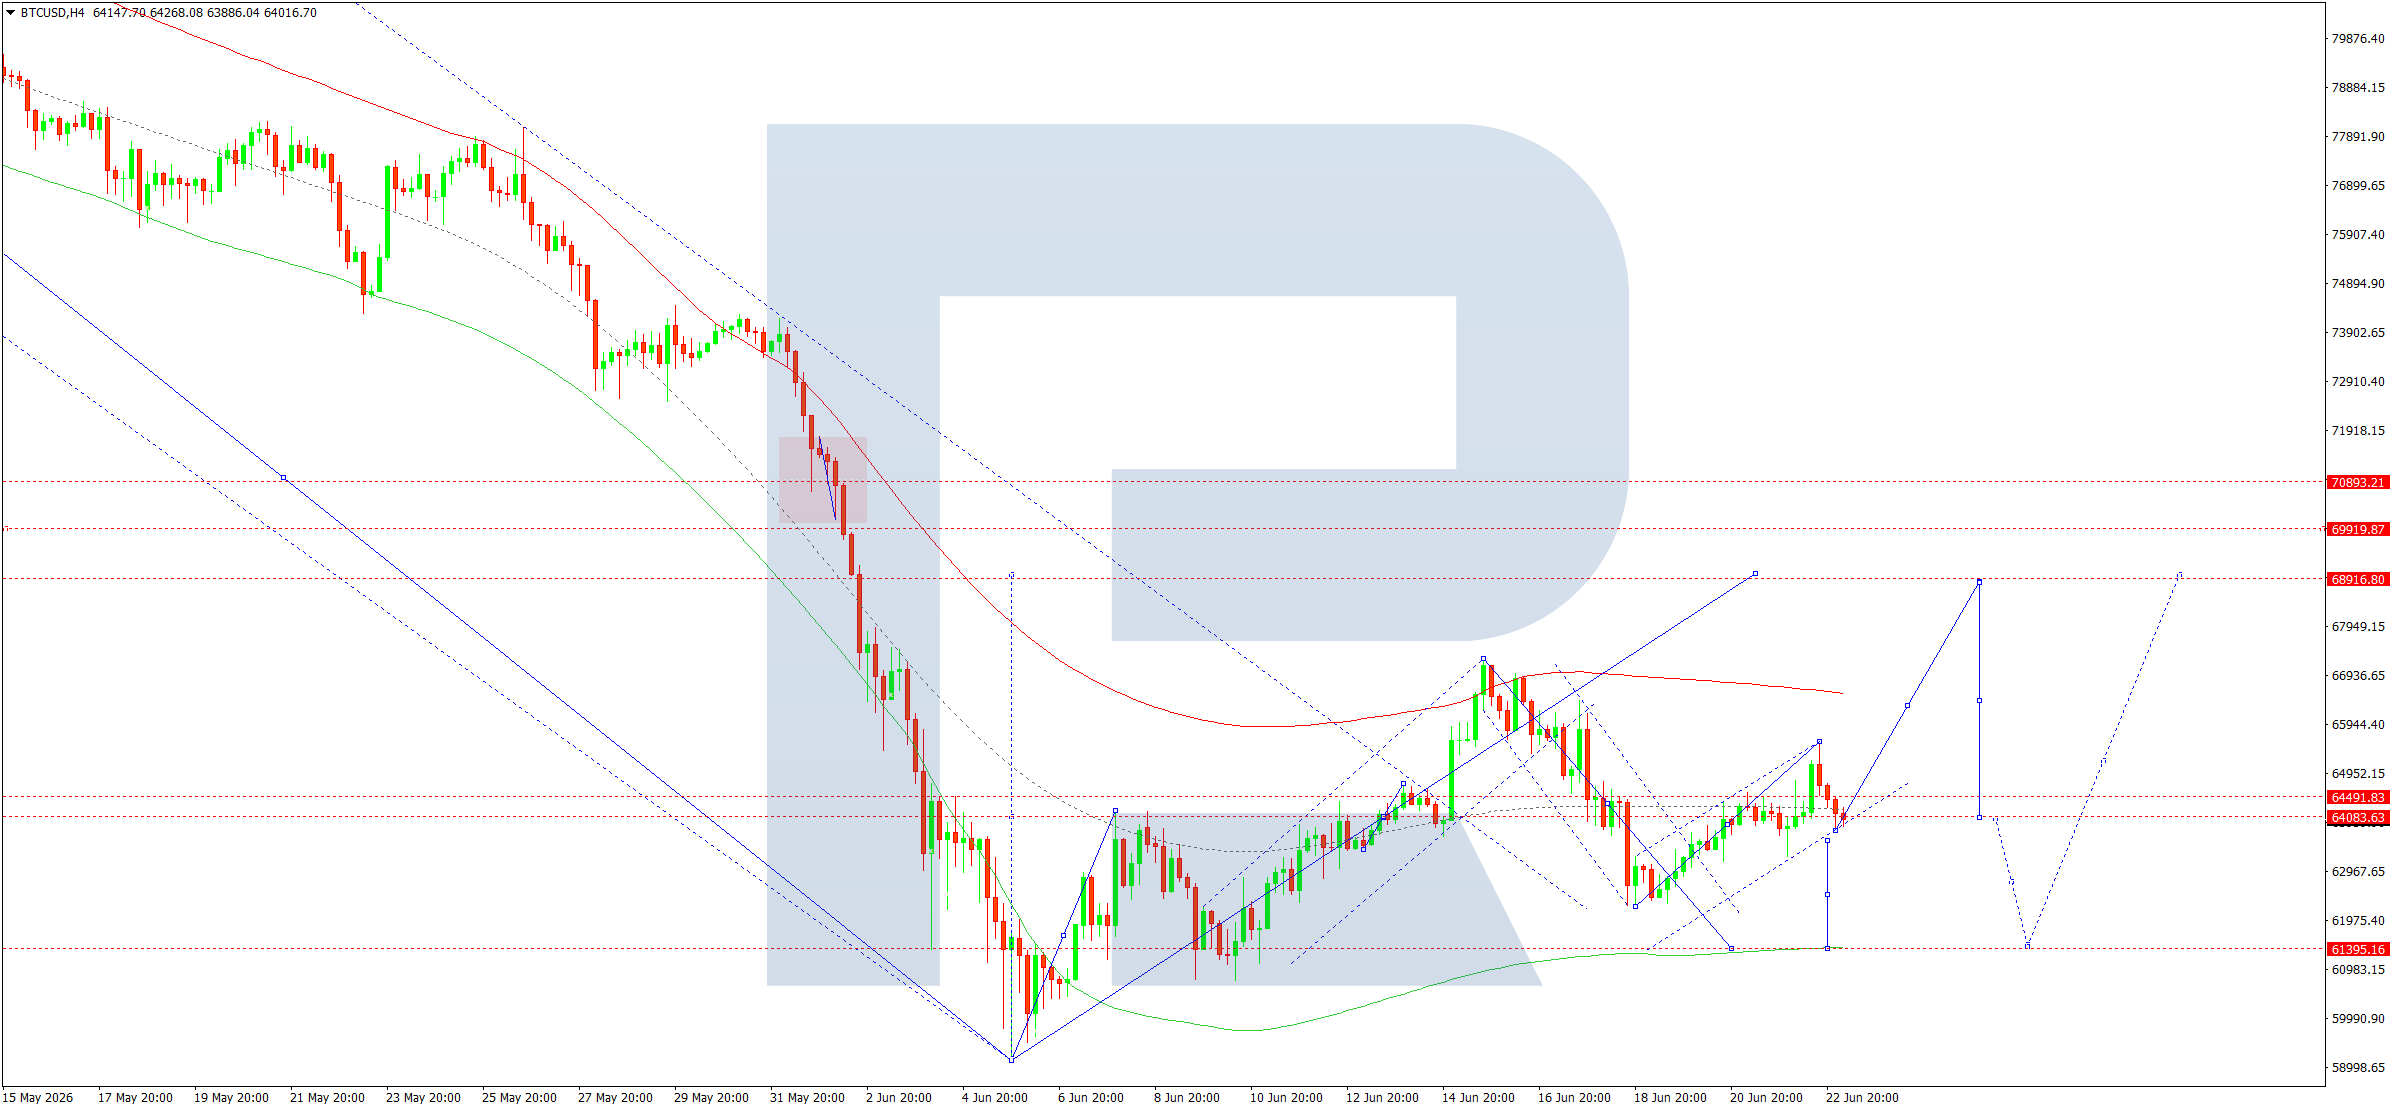
BTCUSD forecast
On the BTCUSD H4 chart, the market has completed a downward wave towards 63,000 and is forming a consolidation range around this level. Today, 23 June 2026, a downward wave towards 61,400 is likely. Afterwards, growth towards 64,244 is expected. A breakout above this level would open the potential for a wave towards 68,900, the primary target.
Technically, this scenario is confirmed by the indicated Elliott wave structure and the upward wave matrix with a pivot point at 71,000, a key level for BTCUSD in this wave structure. At the moment, the market is forming a corrective wave structure towards the lower boundary of the Price Envelope at 61,400. Afterwards, the price is expected to advance towards its upper boundary at 68,900.
Technical indicators for today’s BTCUSD forecast suggest the downward wave could continue towards 61,400, followed by growth towards 68,900.
Editors’ picks
 EURUSD forecast 2026–2027: technical analysis, price levels & predictions
The ECB holds rates at 2.15% while the Fed stays at 3.75% — and that divergence is the central driver of EURUSD in 2026. The pair is range-bound between 1.1400 and 1.1915, with Deutsche Bank targeting 1.2500 and Morgan Stanley calling for 1.3000 by year-end. We analyse the technicals, break down the macro factors, and outline three trading scenarios with specific entry levels.
 Gold (XAUUSD) forecast 2026: predictions based on fundamental and technical analysis
Where is gold headed after pulling back from the all-time high of 5,597 USD? XAUUSD is consolidating near 4,518 USD between key levels 4,220 USD and 4,855 USD, with major banks targeting 5,243–6,200 USD by year-end. Read our comprehensive gold forecast: technical analysis across three timeframes, trading scenarios with specific entry levels, Fed policy and central bank demand outlook, and institutional predictions for 2026 and beyond.
Forecasts presented in this section only reflect the author’s private opinion and should not be considered as guidance for trading. RoboForex bears no responsibility for trading results based on trading recommendations described in these analytical reviews.