
Daily technical analysis and forecast for 18 September 2026
Daily technical analysis and forecast for EURUSD, USDJPY, GBPUSD, AUDUSD, USDCAD, XAUUSD, US 500, and BTCUSD for 18 September 2026.
Each scenario on this page reflects the market structure on the H4 chart as of 10:00 UTC+3 on 18 September 2026. The assessment considers the current H4 chart structure, key support and resistance levels, the direction of the medium-term movement, and the prevailing fundamental backdrop.
EURUSD forecast
As of 18 September 2026, the main driver for EURUSD remains the divergence in monetary-policy expectations between the US and the eurozone. The Federal Reserve raised the target rate range by 25 basis points to 3.75–4.00% on 16 September, while most committee members indicated that another increase remains possible before the end of the year. A resilient labour market is providing additional support for the dollar: weekly jobless claims fell to 196,000, while unemployment remained at 4.1% in August.
At the same time, lower oil prices following the recent surge have slightly reduced the inflation premium in US bond yields, so the dollar's appreciation remains uneven. The European Central Bank previously raised its policy rate to 2.50% in response to accelerating inflation, although the Governing Council remains cautious about overreacting to the energy shock. Eurozone inflation for August was revised to 3.2%, but ECB officials have noted the absence of clear second-round effects through wages. For the euro, this creates a mixed backdrop: the ECB's hawkish stance is limiting the downside, but higher yields on dollar assets and the resilience of the US economy continue to support EURUSD sellers.
Expensive energy remains a significant external risk: oil is still trading above 100 USD per barrel, although prices are declining for a third consecutive day on 18 September. Therefore, EURUSD's reaction to new data may remain two-sided, but until signs of weakness emerge in the US labour market, the interest-rate differential continues to favour the dollar.
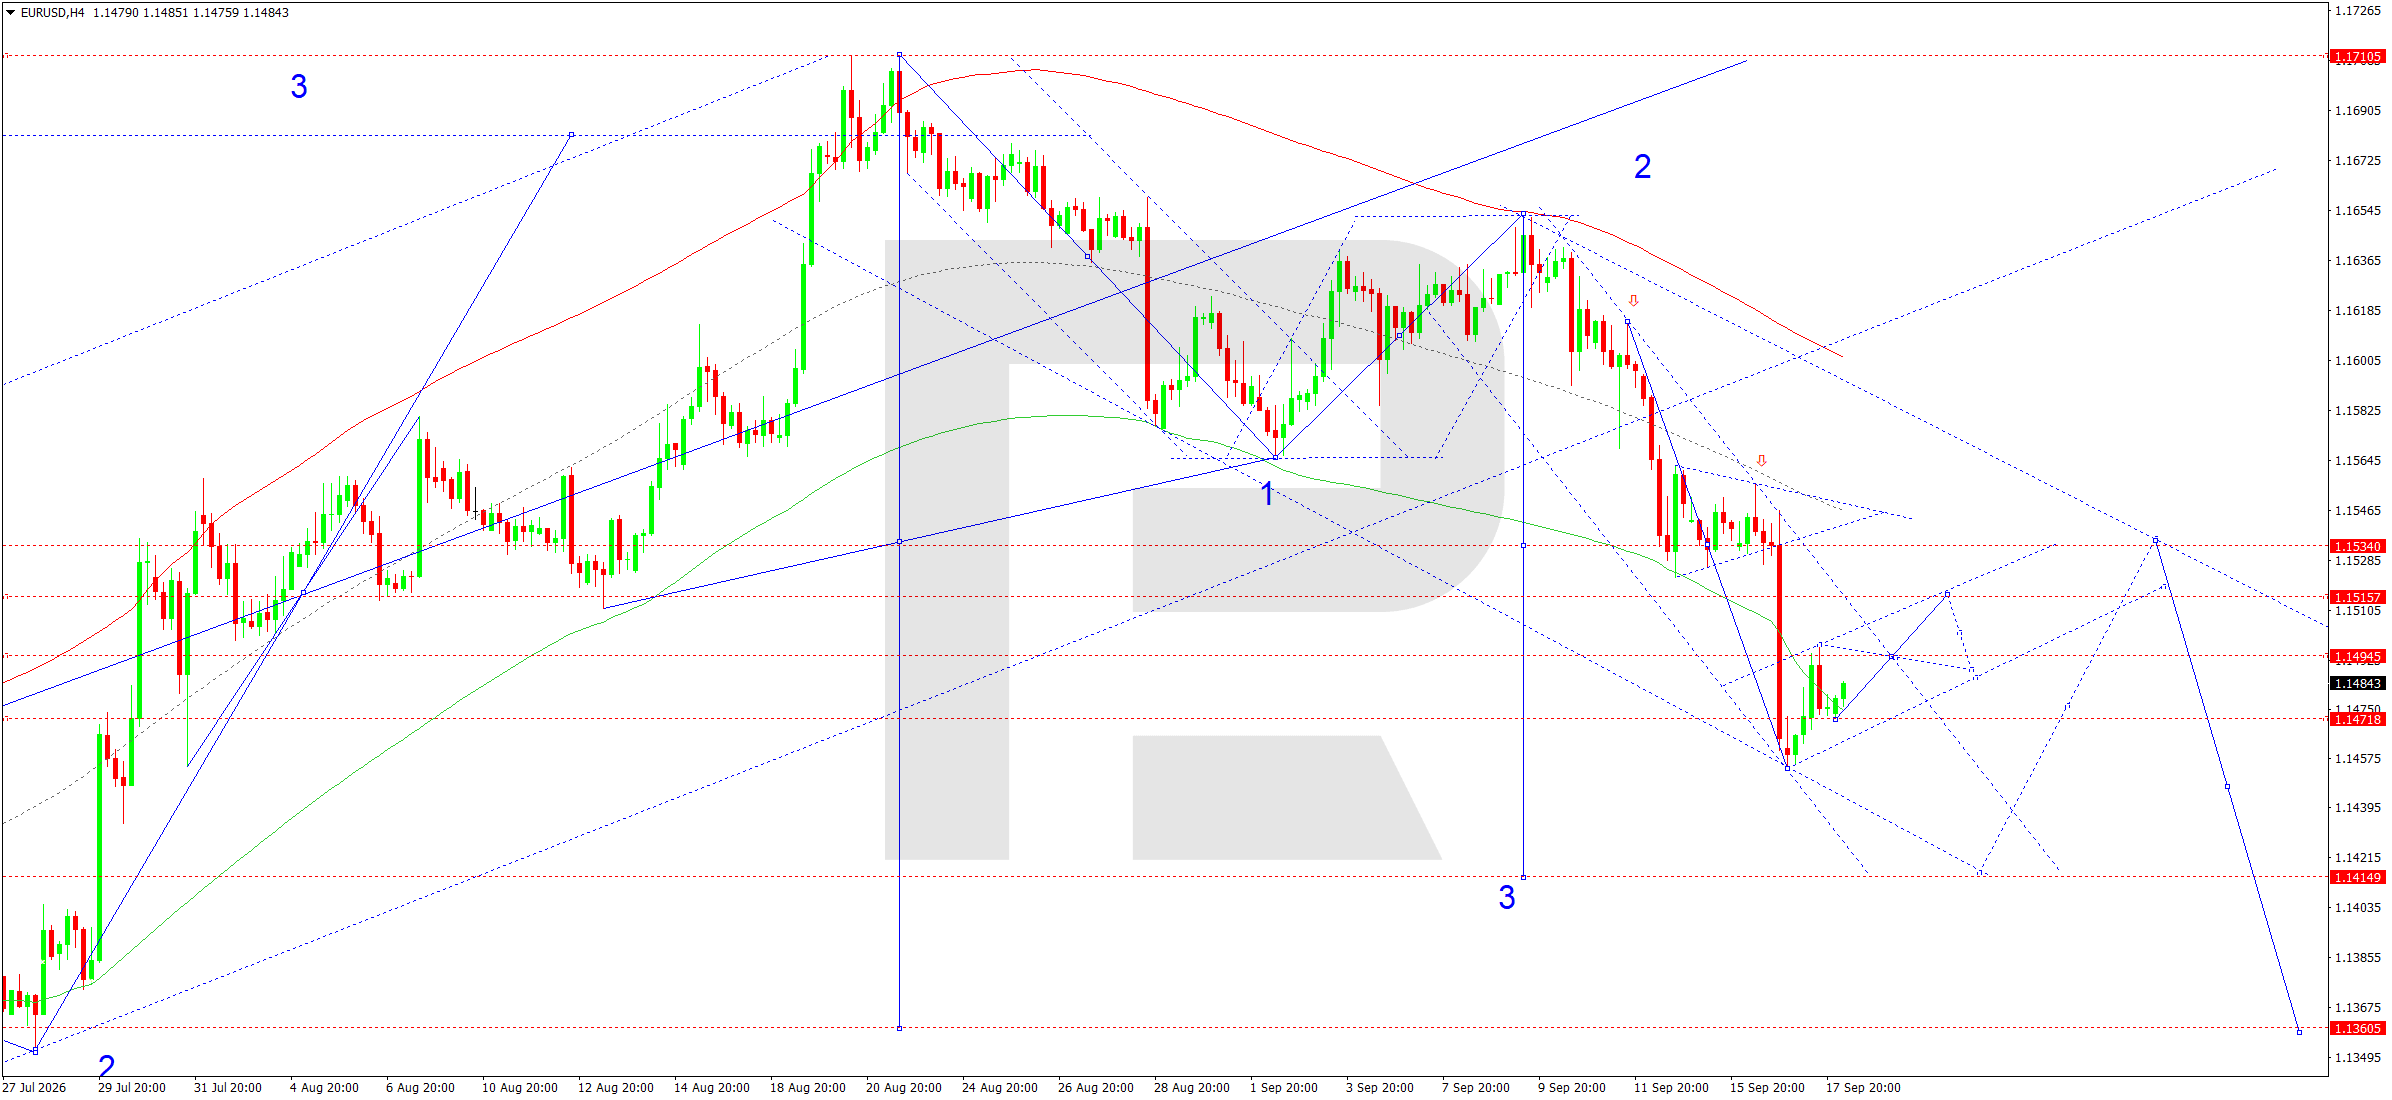
On the H4 chart, the bearish structure remains in place after the reversal from the September high. The market completed an impulse towards 1.1496 and a correction into the 1.1471 area, after which a narrow consolidation is forming. The nearest resistance is at 1.1495, followed by 1.1515 and the centre of the wave matrix at 1.1534.
While the price remains below 1.1534, the main scenario is a continuation of the third downward wave. Locally, a correction towards the central line of the Price Envelope at 1.1515–1.1530 is possible, where renewed supply is expected. A firm breakout below 1.1470 would confirm a resumption of the impulse with a target at 1.1415. This level coincides with the projected target of the third wave and the lower boundary area of the extended channel. Consolidation above 1.1535 would temporarily postpone the decline and open the way towards 1.1565, although under the current structure this remains the alternative scenario.
Another technical argument in favour of sellers is the price trading below the main H4 moving averages and within the descending channel formed from the 1.1710 high. The recovery over the past few hours looks corrective because the sequence of lower highs has not yet been broken. To confirm a new upward impulse, the market would need not only to reclaim 1.1535 but also to consolidate above 1.1565. Until then, any rise is better viewed as a retest of broken support levels from below before another move towards 1.1415.
EURUSD forecast scenario
Trading scenario: SELL
- Price at the time of writing: 1.1480
- Entry price: 1.1475
- Stop loss: 1.1515
- Take profit: 1.1415
- Risk-to-reward ratio: 1:1.5
The trade idea is valid until 8:00 AM on 19 September 2026 (server time, UTC+3).
USDJPY forecast
As of 18 September 2026, USDJPY is being influenced by two hawkish monetary-policy signals at once. The Federal Reserve raised the target rate range by 25 basis points to 3.75–4.00% this week and made clear that fighting inflation remains a priority. The resilient US labour market is also supporting the dollar, with initial jobless claims falling to 196,000. At the same time, the Bank of Japan raised its key rate today from 1.00% to 1.25%, its highest level in several decades. The decision reflects its intention to continue normalising policy amid elevated inflation and expensive imported energy.
For the yen, this is fundamentally positive because the yield differential between the US and Japan is gradually narrowing. Lower oil prices may provide additional support for the Japanese currency, as Japan remains a major fuel importer. However, the dollar retains its safe-haven appeal amid geopolitical tensions and is supported by high US Treasury yields. As a result, the fundamental balance is shifting towards a downward correction in USDJPY, although high volatility following the two central-bank decisions could trigger sharp moves in both directions. The bond market's reaction is also important: the 10-year Treasury yield fell back towards 4.93% after the Fed decision, somewhat reducing rate-related support for the dollar. Conversely, another spike in oil prices or yields could temporarily revive demand for the dollar and delay yen appreciation.
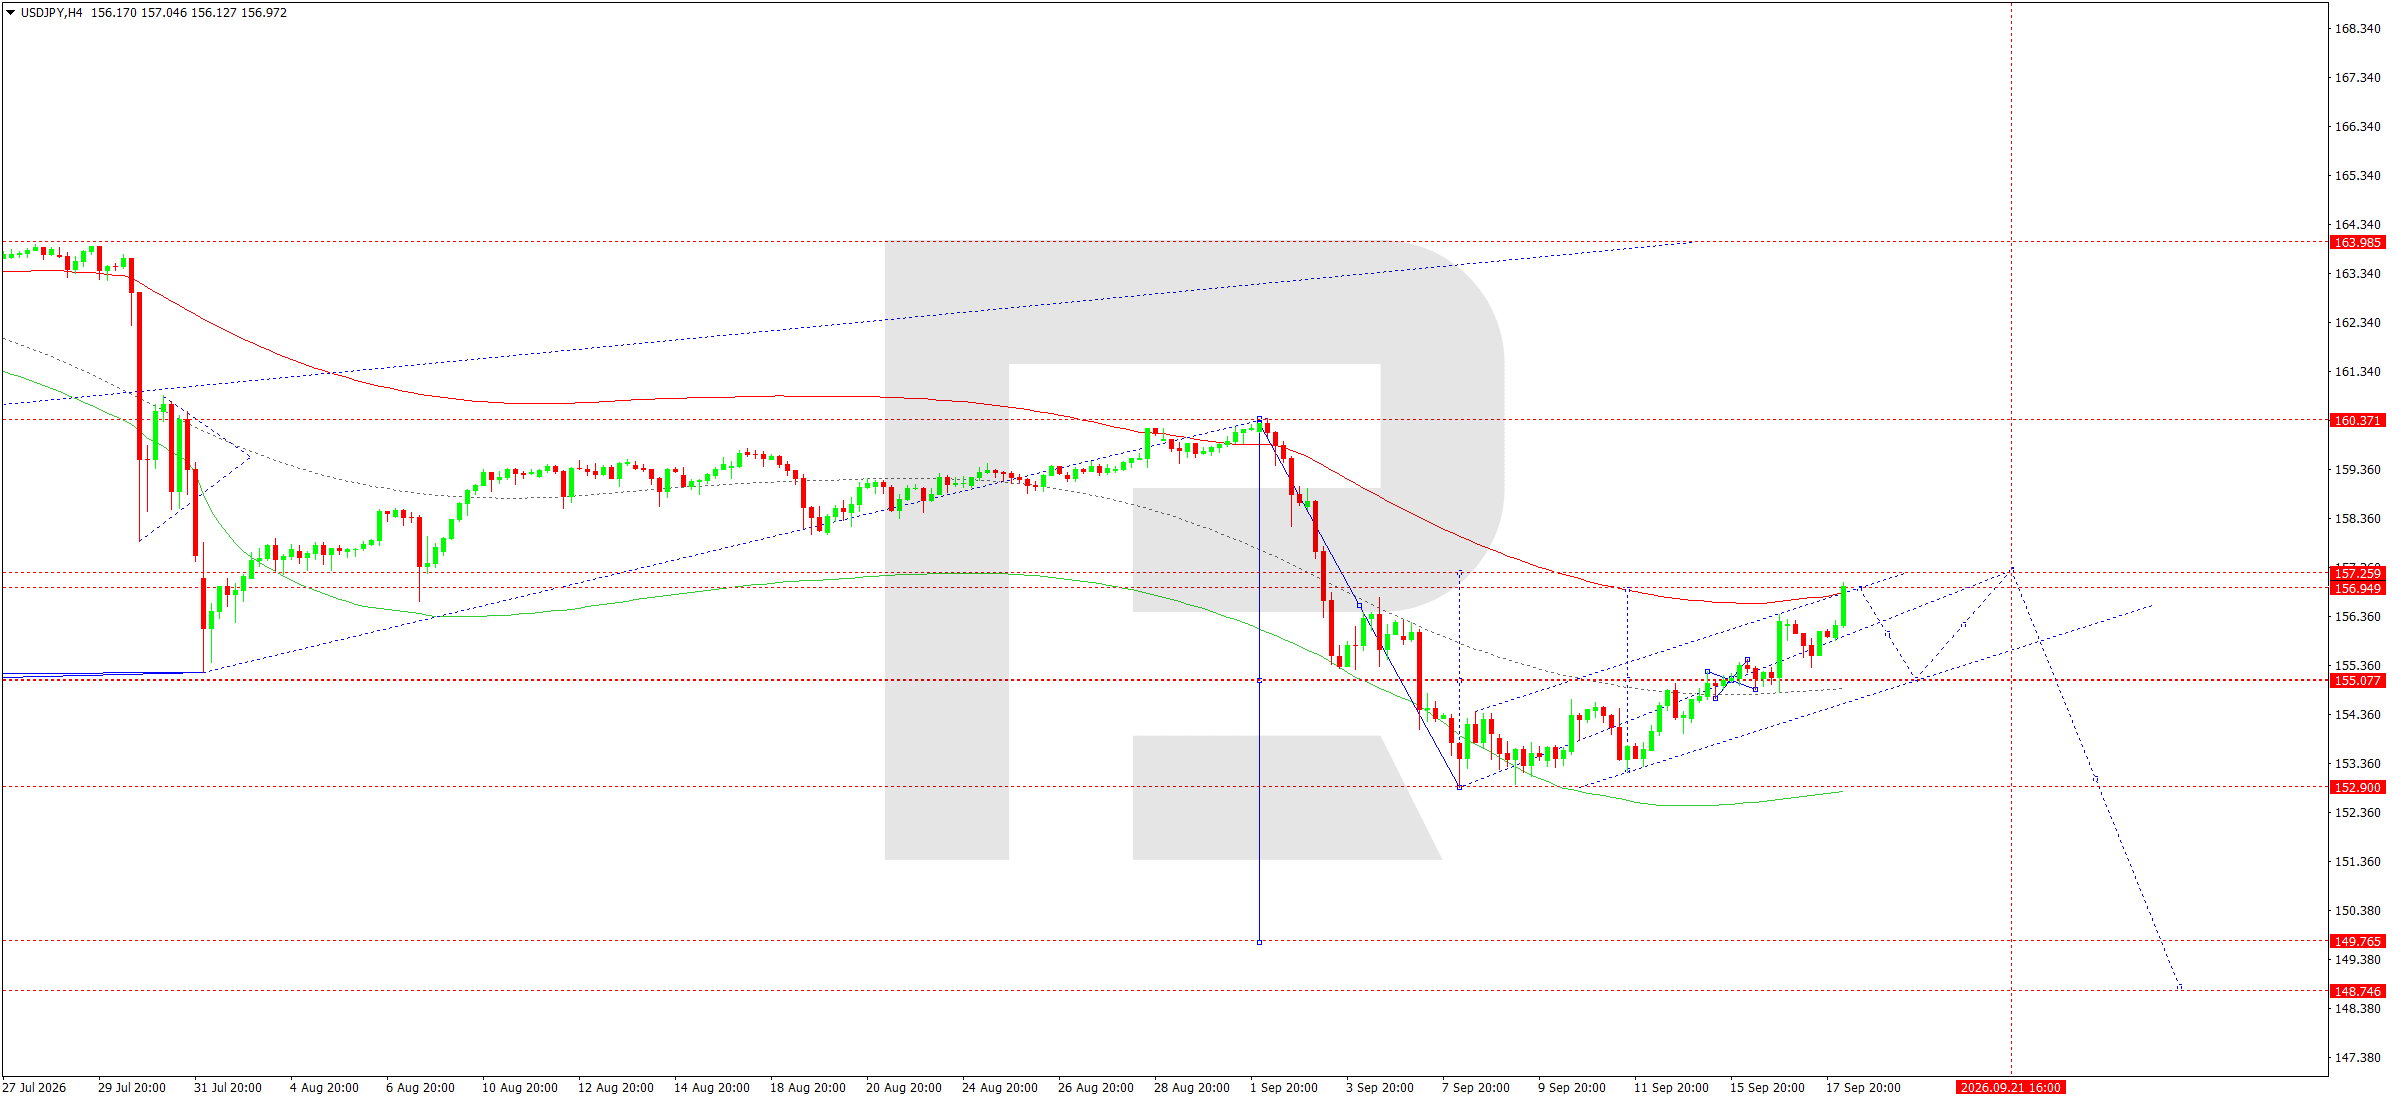
On the H4 chart, the market completed a recovery from support at 152.90 and formed an ascending channel, reaching the 157.25–157.30 area. This zone acts as both the upper boundary of the Price Envelope and important resistance for the current corrective wave. A pivot point is likely to form around 157.30. While the price remains below this level, the preferred scenario is a decline first towards 155.00–155.10, where the central line of the Envelope runs and the centre of the wave matrix is located near 155.05.
A breakout below 155.00 would increase selling pressure and open the way towards 152.90. In the broader structure, the decline from 160.37 is not yet complete, so after a possible retest of 155.00 from below, there remains scope for a move towards 149.70 and then 148.75. To invalidate this scenario, the market would need to consolidate firmly above 157.30, extending the wave towards 160.37. Until such a signal appears, the current rise looks like a correction within a broader bearish structure, while the 157.25–157.30 area is viewed as a supply zone. Recent candle dynamics also show the upward impulse slowing directly at the upper boundary of the channel. In this case, a move towards 155.00 could now develop quickly. If the market instead holds above 156.50 and retests 157.30, the possibility of a false breakout above resistance before a reversal should be considered. The main H4 structure would remain unchanged.
USDJPY forecast scenario
Trading scenario: SELL
- Price at the time of writing: 156.95
- Entry price: 156.90
- Stop loss: 157.35
- Take profit: 155.00
- Risk-to-reward ratio: 1:4.2
The trade idea is valid until 8:00 AM on 19 September 2026 (server time, UTC+3).
GBPUSD forecast
As of 18 September 2026, the fundamental backdrop for GBPUSD is shaped by a combination of tight US monetary policy and persistent inflation risks in the UK. The Federal Reserve raised the target rate range by 25 basis points to 3.75–4.00% on 16 September, while most committee members indicated that another increase remains possible before the end of the year. Stability in the US labour market, where initial jobless claims fell to 196,000, is supporting the dollar and allowing the Fed to remain focused on inflation.
The Bank of England kept the policy rate unchanged at 3.75% on 17 September by a 6–3 vote, with the minority favouring an increase to 4.00%. UK inflation accelerated to 3.1% in August, although core inflation remained at 2.6% and services inflation at 3.4%. Today's retail-sales data were better than expected, with sales rising by 0.5% in August. This confirms the resilience of domestic demand but at the same time increases the risk of persistent price pressure. For the pound, this backdrop is mixed: the BoE is sounding cautiously hawkish, but the dollar's yield advantage and the recent strengthening of expectations for further Fed rate increases continue to limit the recovery in GBPUSD.
Lower oil prices at the end of the week are partly easing concerns about another inflation spike, but Brent remains above 100 USD per barrel, so the energy theme remains important for the UK economy. High gilt yields and expectations surrounding the autumn budget are additional constraints on the pound. In the short term, GBPUSD remains sensitive primarily to dollar dynamics and reassessment of the BoE rate path.
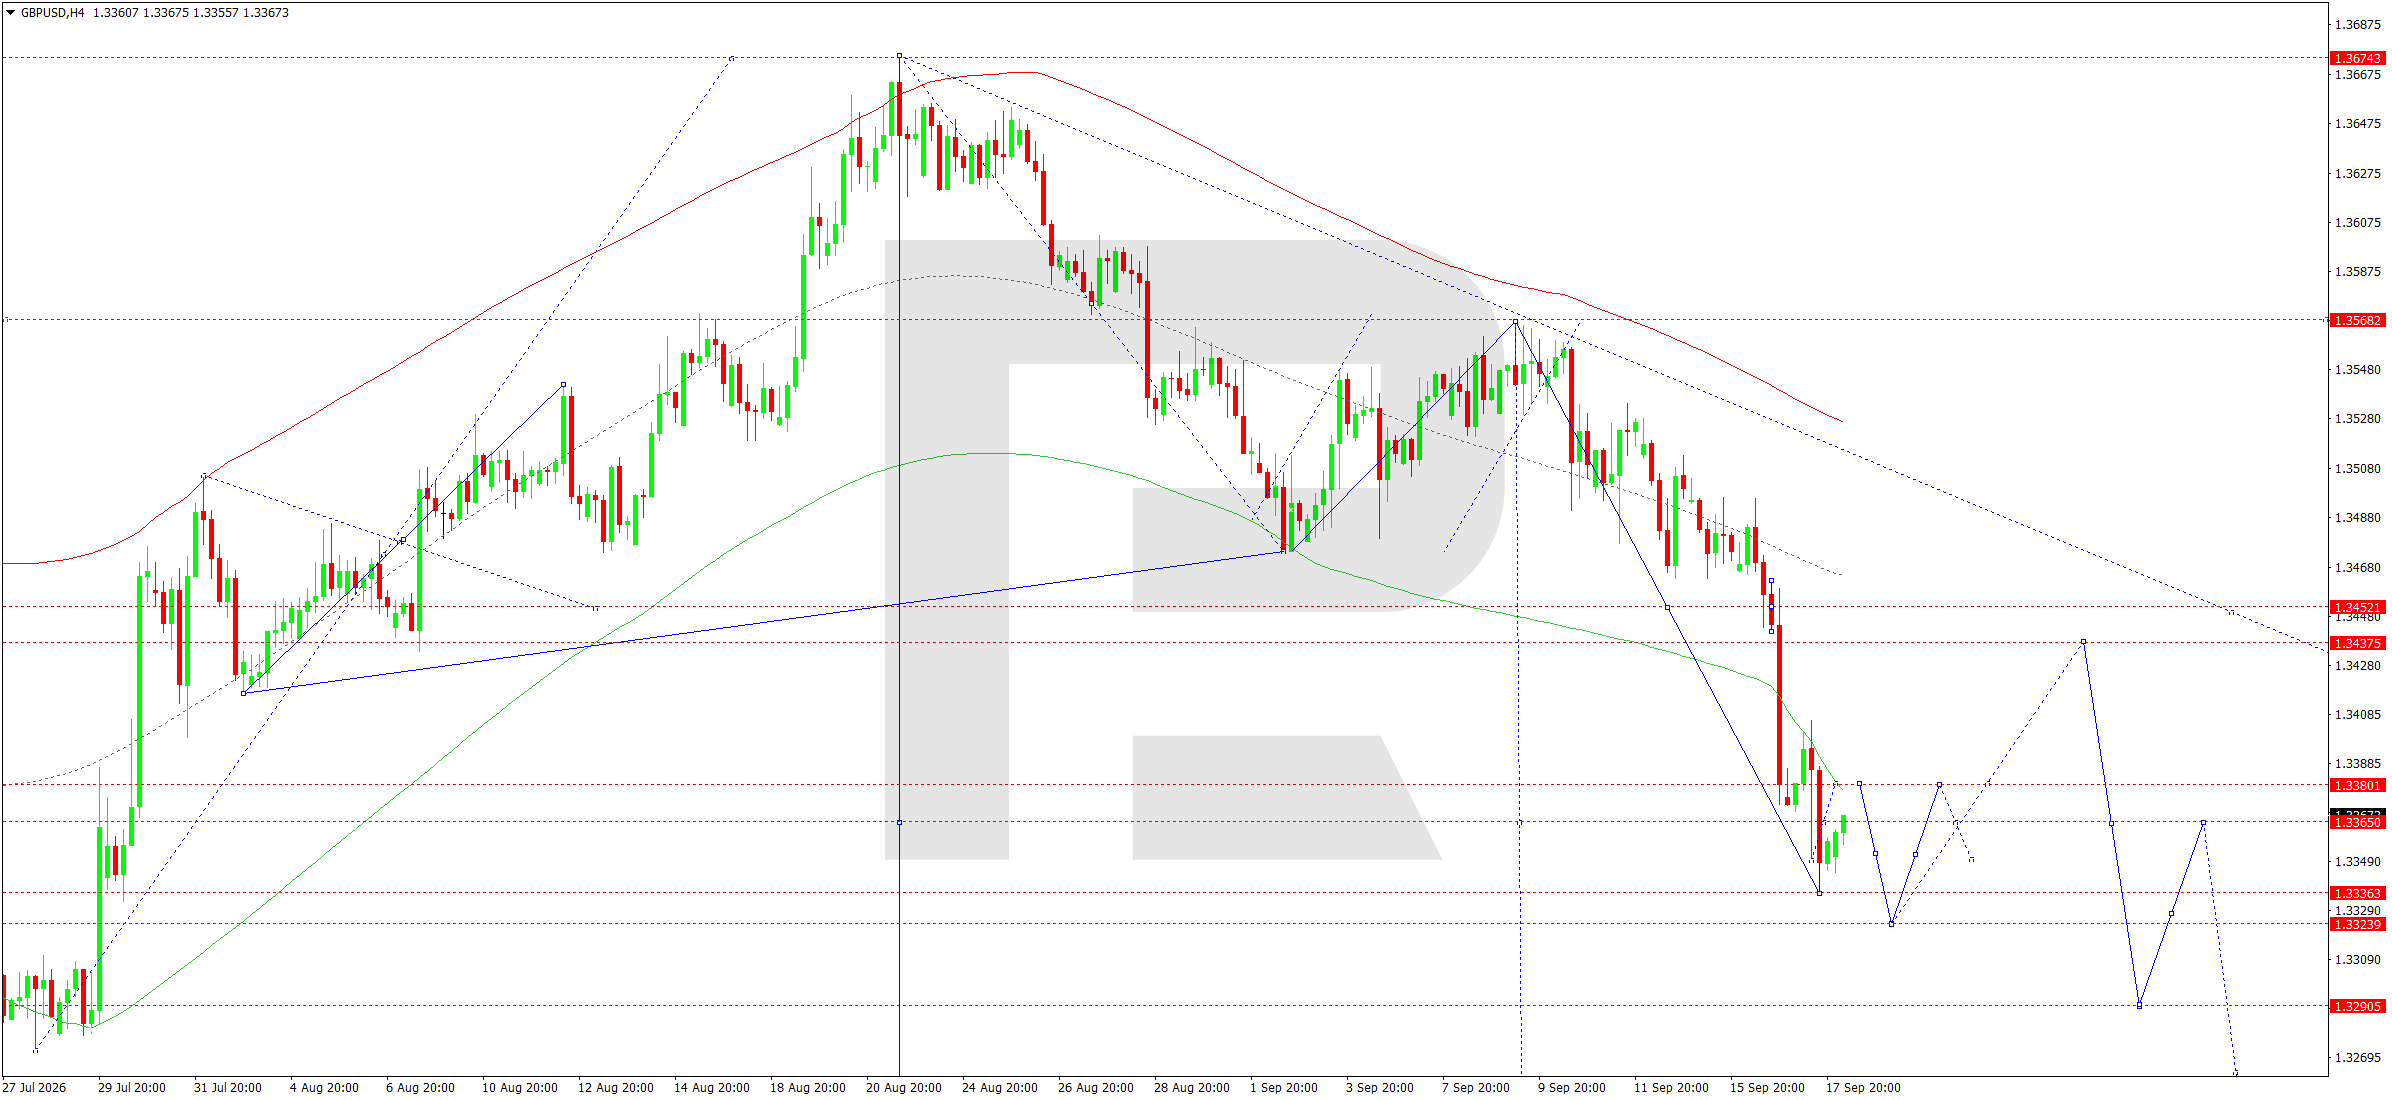
On the H4 chart, a pronounced downtrend remains in place after the reversal from 1.3568. The price is forming a sequence of lower highs and lower lows, while the breakout below 1.3452 accelerated the decline towards 1.3370. The market is now forming a compact consolidation around 1.3360. A local rebound towards 1.3380–1.3385 is possible, but this zone is viewed as the nearest resistance.
If buyers manage to consolidate above 1.3385, the correction could extend towards 1.3435–1.3450, where the centre of the wave matrix and an important retest area from below are located. The main scenario remains a continuation of the decline once the correction is complete. A breakout below 1.3323 would confirm the development of the next impulse, with targets at 1.3290 and 1.3160. The latter level is viewed as the local target of the extended wave. The Price Envelope structure also remains bearish: the price is near the lower boundary, while the central line is around 1.3450.
Therefore, a rise towards this line would remain corrective unless the market returns above 1.3452 and breaks the sequence of lower highs. A descending channel also remains in place on the chart, with its upper boundary gradually shifting towards the 1.3435–1.3450 area. This reinforces the importance of the stated resistance. Until then, sharp fluctuations within a narrow range remain possible, but the H4 structure continues to point lower.
GBPUSD forecast scenario
Trading scenario: SELL
- Price at the time of writing: 1.3360
- Entry price: 1.3355
- Stop loss: 1.3385
- Take profit: 1.3290
- Risk-to-reward ratio: 1:2.2
The trade idea is valid until 8:00 AM on 19 September 2026 (server time, UTC+3).
AUDUSD forecast
As of 18 September 2026, AUDUSD remains sensitive to simultaneous monetary tightening in the US and Australia. The Federal Reserve raised the target rate range by 25 basis points to 3.75–4.00% this week and maintained a hawkish signal regarding the continued fight against inflation. Resilient US labour-market data are supporting the dollar and limiting demand for high-beta currencies.
The Reserve Bank of Australia is also maintaining a hawkish stance: after three increases in 2026, the cash rate has reached 4.35%, while RBA Governor Michele Bullock said today that some inflation risks are beginning to materialise. She identified expensive energy and the global investment boom linked to artificial intelligence as the main sources of pressure. For the Australian dollar, this provides support through expectations of further rate increases. At the same time, the AUD remains dependent on global risk appetite, commodity prices and Asian market dynamics. Lower oil prices at the end of the week have slightly improved the inflation backdrop, but oil itself remains above 100 USD per barrel. As a result, the fundamental picture is mixed: a hawkish RBA supports the AUD, while high US interest rates and investor caution continue to put pressure on AUDUSD.
As long as global markets retain their appetite for risk following the recovery in US equities, the Australian currency is receiving some support. However, persistently high Treasury yields and renewed expectations of further Fed tightening limit the potential for sustained AUDUSD growth without fresh strong domestic data.
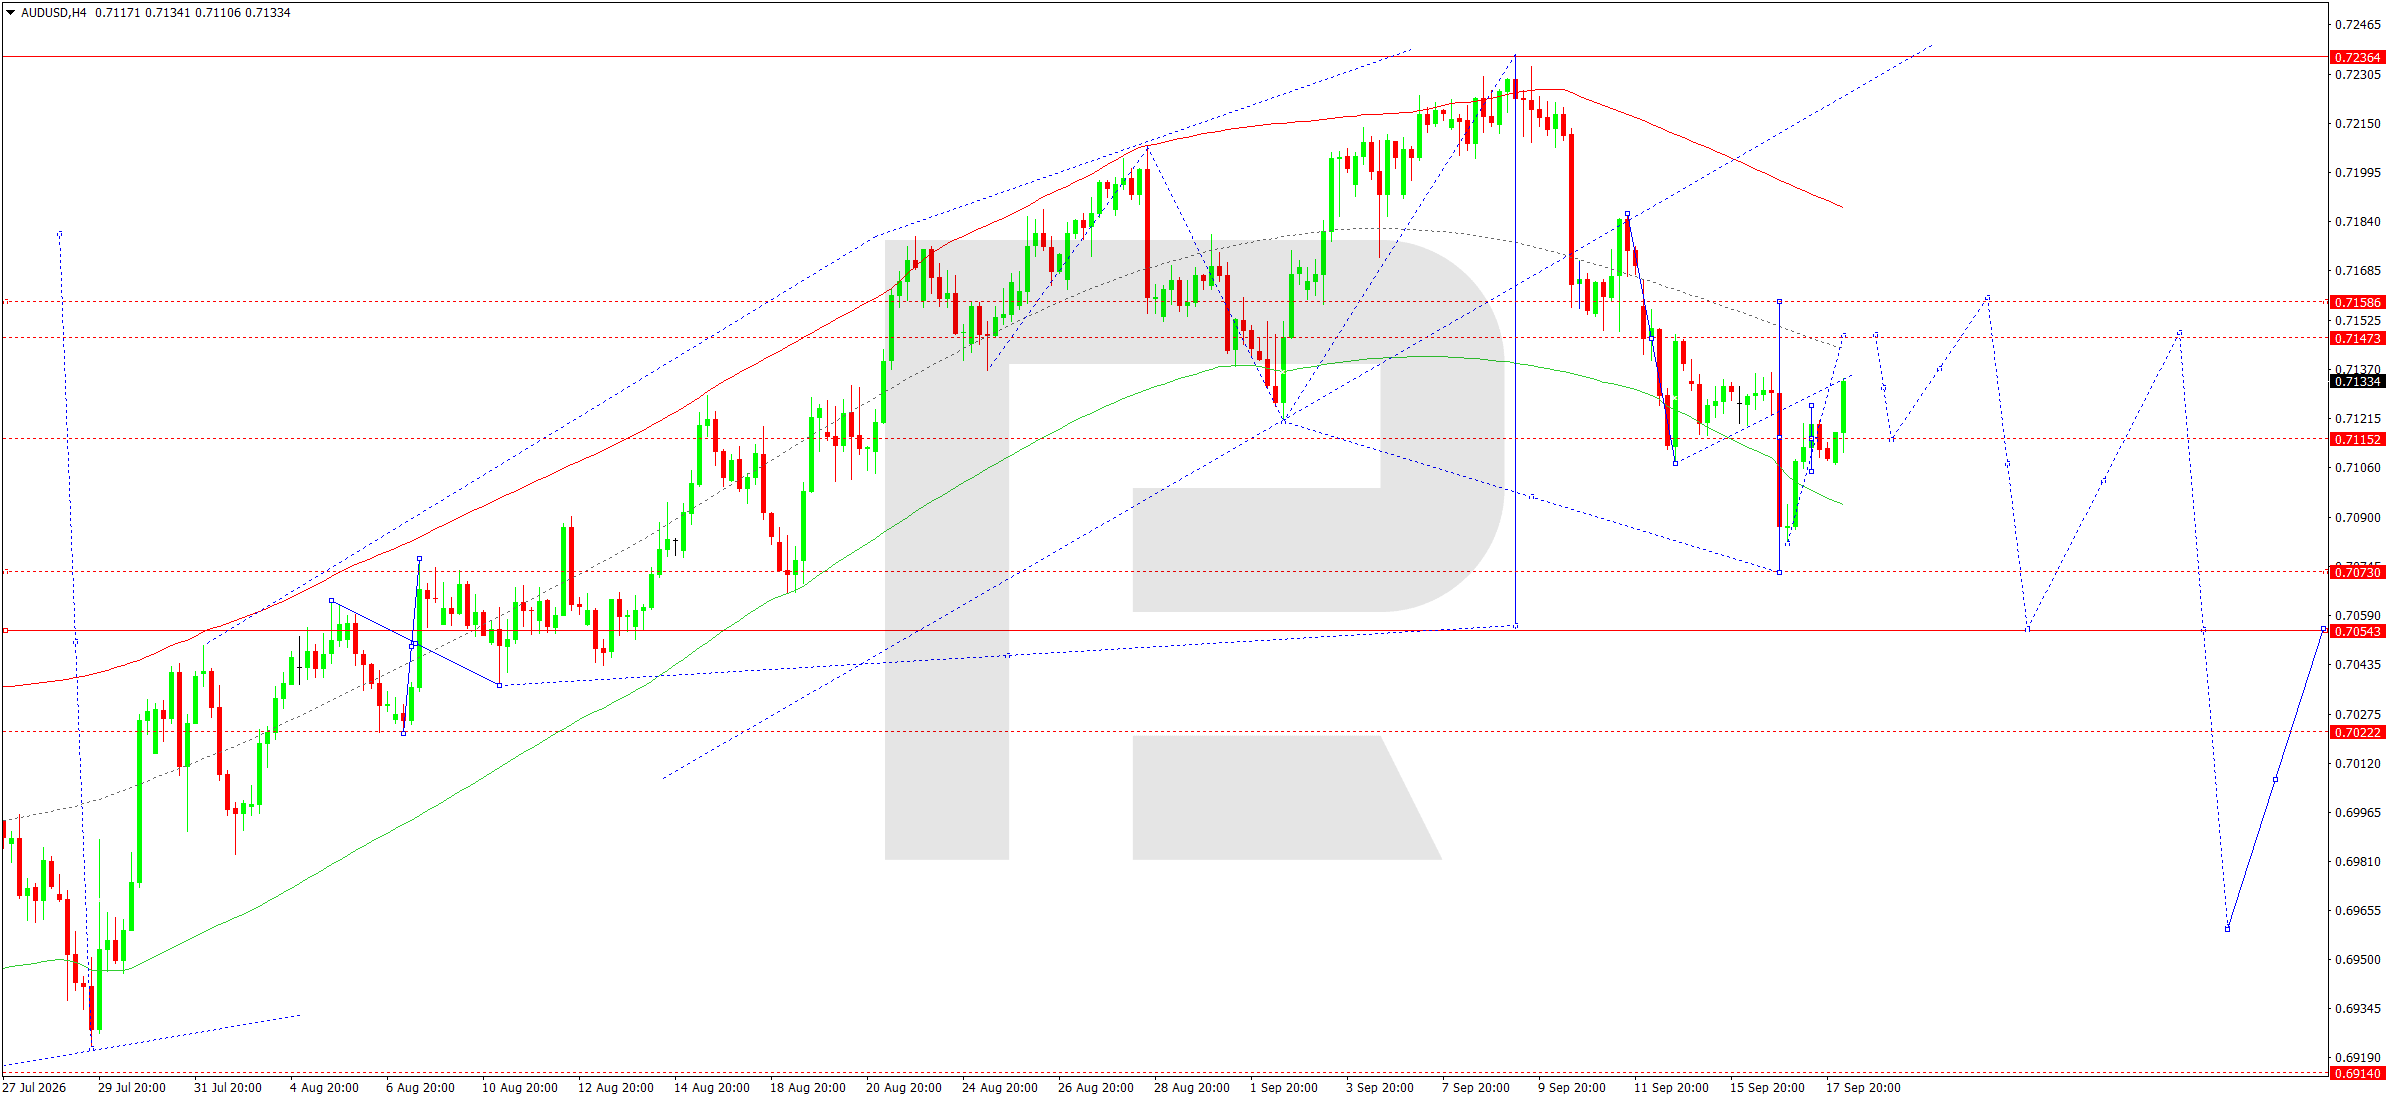
On the H4 chart, a bearish corrective structure is developing after the 0.7236 high. The market declined towards 0.7073, where it formed local support, and then recovered above 0.7115. An upward correction is now developing with the nearest targets at 0.7147 and 0.7160. The 0.7147 area also acts as the centre of the current wave matrix and an important resistance level, so a test of this zone from below could complete the recovery. If the price remains below 0.7160, the main scenario is a renewed decline towards 0.7105. A breakout below 0.7105 would open the way towards 0.7073 and then 0.7055, which is viewed as the first target of the next impulse.
The upper boundary of the Price Envelope is above the current levels, while the lower boundary is shifting towards 0.7055. Consolidation above 0.7160 would invalidate the immediate bearish signal and allow for a continuation of the correction towards 0.7184. Until that happens, the rise from 0.7073 remains a technical recovery within a broader bearish structure. The short-term formation on the chart resembles a corrective zigzag following the sharp decline from 0.7184. The nearest 0.7147–0.7160 area coincides with the previous selling zone, making the price reaction there especially important. In this case, renewed pressure could quickly push the market back towards 0.7073. Only consolidation above 0.7184 would break the sequence of lower highs and materially weaken the current bearish scenario.
AUDUSD forecast scenario
Trading scenario: SELL
- Price at the time of writing: 0.7123
- Entry price: 0.7118
- Stop loss: 0.7160
- Take profit: 0.7055
- Risk-to-reward ratio: 1:1.5
The trade idea is valid until 8:00 AM on 19 September 2026 (server time, UTC+3).
USDCAD forecast
As of 18 September 2026, USDCAD is trading under the influence of hawkish US monetary policy, persistent Canadian inflation and high oil-price volatility. The Federal Reserve raised the target rate range by 25 basis points to 3.75–4.00% on 16 September, keeping open the possibility of further tightening before the end of the year. The US labour market remains resilient: initial jobless claims fell to 196,000, supporting the dollar.
The Bank of Canada kept its key rate unchanged at 2.25% in early September but warned that further increases could be required if inflationary pressure persists. Canadian inflation was 3.0% year-on-year in August, while the CPI-median and CPI-trim core measures remain near 2%. Oil remains the most important external factor for the Canadian dollar. Brent and WTI are declining for a third consecutive day today as concerns about supply disruptions from Saudi Arabia have eased, although prices remain above 100 USD per barrel. Lower oil prices are limiting support for the CAD, while the Fed's high policy rate continues to favour the US dollar.
The fundamental backdrop therefore remains moderately positive for USDCAD. This means the CAD may react quickly to new Middle East headlines. At the same time, high borrowing costs in both Canada and the US are increasing the market's sensitivity to inflation and employment data. Until new signals emerge from Canada, the interest-rate differential remains a supporting factor for the US currency.
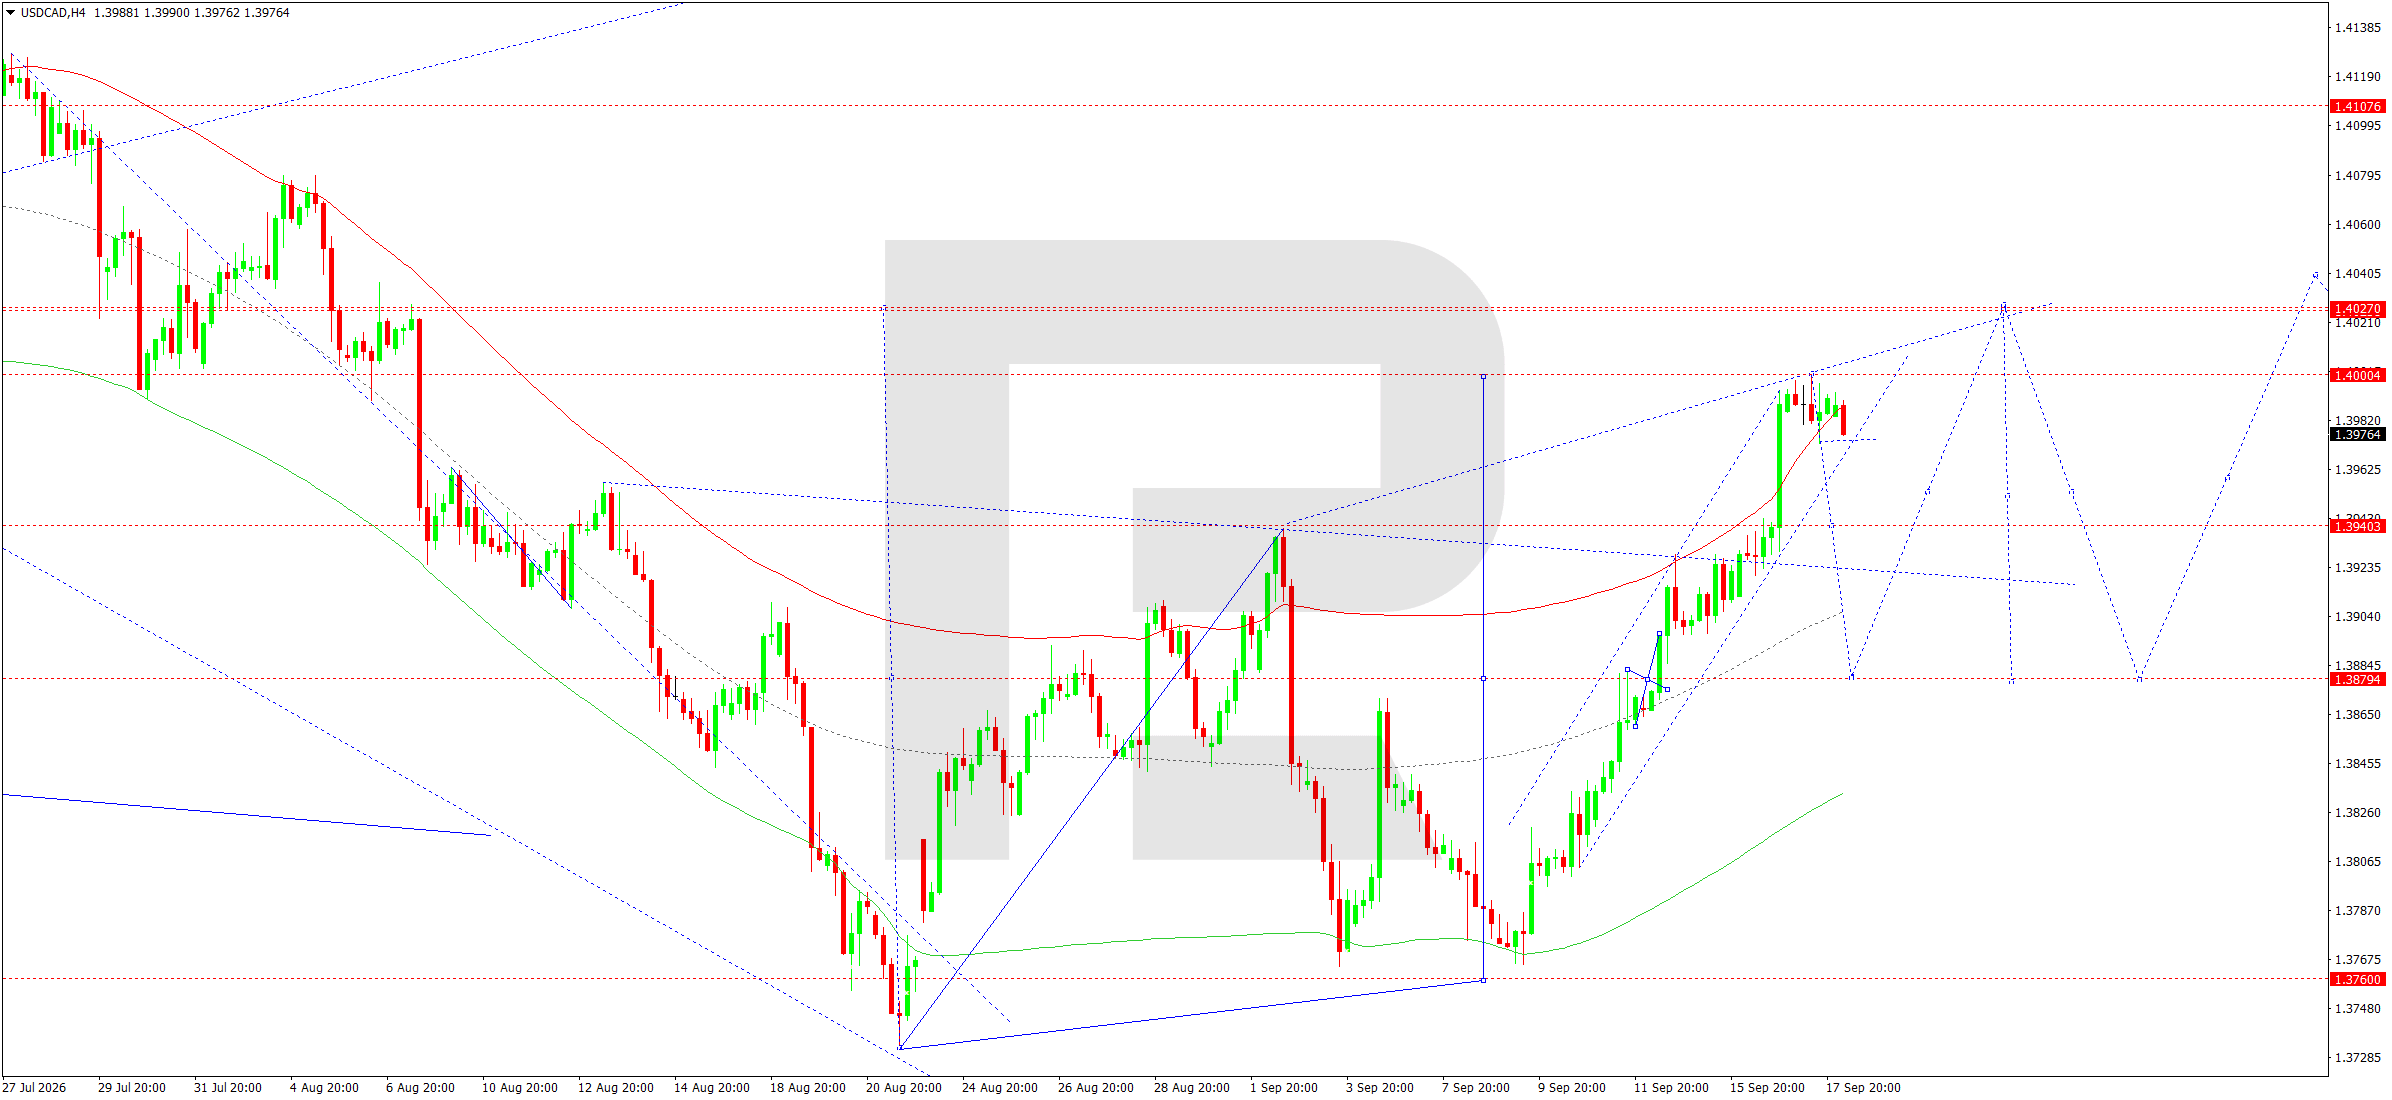
On the H4 chart, the market completed a strong upward wave from 1.3760 and reached the psychological resistance level at 1.4000. A compact consolidation is forming in this area, consistent with the completion of the current upward impulse. In the short term, a brief move above 1.4000 and an extension towards 1.4020 are possible, but sustained consolidation above this zone has not yet formed. The centre of the current wave matrix is around 1.3879, which also acts as the main target of the expected correction.
A move below 1.3973 would be the first sign of weakening buyer momentum and would open the way towards 1.3940 and then 1.3879. The upper boundary of the Price Envelope runs around 1.4000–1.4020, so the current area is viewed as a potential reversal zone. If the price consolidates above 1.4020, growth could continue towards 1.4108 and the downside scenario would have to be postponed. Until that happens, the preference remains for a correction after the completed upward impulse. The technical structure points to an increased probability of a return towards the central part of the previous range.
To confirm a reversal, sellers would preferably need to consolidate below 1.3940, after which the technical path towards 1.3879 would become clearer. If the market instead remains above 1.3973 and makes a fresh high above 1.4020, the impulse will retain its strength. In the main scenario, the move towards 1.3879 is viewed as a correction rather than the start of a new medium-term downtrend.
USDCAD forecast scenario
Trading scenario: SELL
- Price at the time of writing: 1.3993
- Entry price: 1.3988
- Stop loss: 1.4021
- Take profit: 1.3879
- Risk-to-reward ratio: 1:3.3
The trade idea is valid until 8:00 AM on 19 September 2026 (server time, UTC+3).
XAUUSD forecast
As of 18 September 2026, gold remains influenced by opposing factors: tight US monetary policy, elevated geopolitical risks and continued demand for safe-haven assets. The Federal Reserve raised the target rate range by 25 basis points to 3.75–4.00% on 16 September and signalled the possibility of further tightening. Higher interest rates and yields usually put pressure on gold by increasing the opportunity cost of holding a non-yielding asset.
However, after the meeting, the 10-year Treasury yield fell back towards 4.93%, while oil prices are declining for a third consecutive day, somewhat easing inflation concerns. At the same time, geopolitical tensions in the Middle East continue to support demand for defensive assets. Gold is also receiving support from steady central-bank purchases and rising holdings in gold ETFs. During the Asian session, the metal gained around 0.3%, holding above 4,350 USD. As a result, the fundamental backdrop for gold remains neutral to positive in the short term, although a hawkish Fed is limiting the potential for sustained gains and increasing the likelihood of a broad trading range.
The path of real yields remains an important factor: if the decline in the oil premium leads to a further pullback in yields, pressure on the metal could ease. Gold is therefore balancing between safe-haven demand and the negative effect of a higher cost of money, making technical levels especially important in determining the next impulse.
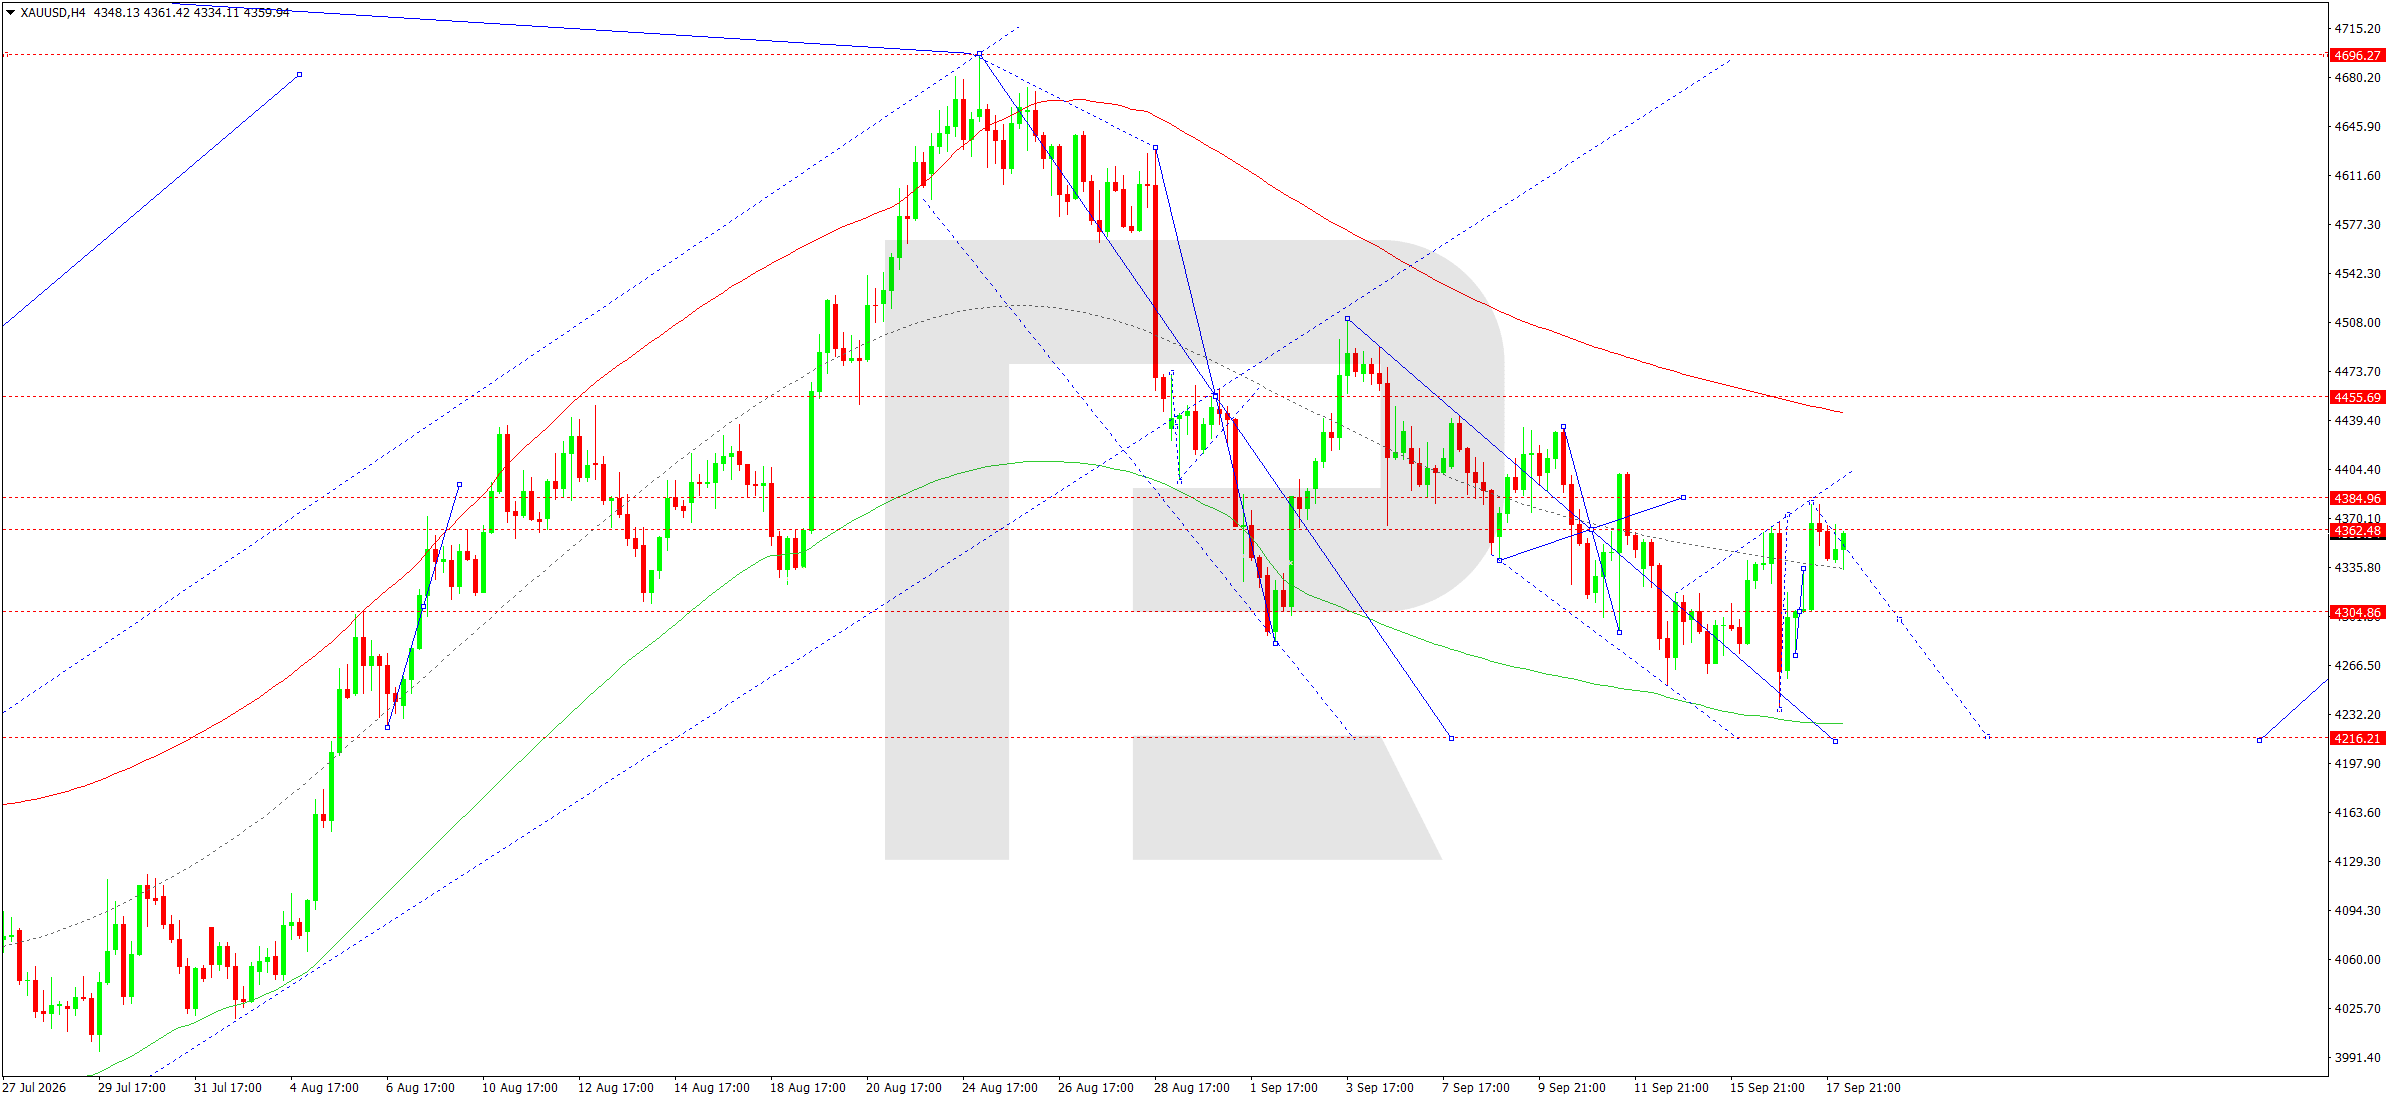
On the H4 chart, XAUUSD continues to form a broad range after declining from 4,696. The market previously tested the lower area of the Price Envelope around 4,235–4,216 and then developed a corrective rise. Given the stated price of 4,392, resistance at 4,384 has already been tested and partially cleared, so the nearest target for an extension of the correction is 4,434, followed by 4,456.
The expanding triangle structure allows for another upward spike before the main downward wave resumes. The centre of the wave matrix is around 4,364 and remains the key pivot point. A return below 4,384 followed by a breakout below 4,364 would signal the end of the correction. In this case, the first target would be 4,333, while a firm breakout below this level would open the way towards 4,305 and then 4,216. While the price remains above 4,364, the risk of a continued rise towards 4,434 persists. However, the overall sequence of highs since late August remains bearish, so the advance is viewed primarily as a corrective wave within the broader bearish structure. This is where the strongest seller reaction is currently most likely. If the market forms a reversal pattern in this area, the decline towards 4,333 could begin without a prolonged consolidation. A breakout below 4,333 would strengthen the third downward wave. Only sustained consolidation above 4,456 would point to a deeper correction with the potential for a return towards 4,508 and would invalidate the immediate selling scenario.
XAUUSD forecast scenario
Trading scenario: SELL
- Price at the time of writing: 4,392
- Entry price: 4,387
- Stop loss: 4,456
- Take profit: 4,216
- Risk-to-reward ratio: 1:2.5
The trade idea is valid until 8:00 AM on 19 September 2026 (server time, UTC+3).
US 500 forecast
As of 18 September 2026, the US equity market is assessing the consequences of the Federal Reserve's first rate increase in several years. On 16 September, the Fed raised the target rate range by 25 basis points to 3.75–4.00%, while most committee members indicated that another increase remains possible before the end of the year. The decision initially increased pressure on equities and bonds, but the market recovered on 17 September: the S&P 500 gained 1.1%, the Nasdaq rose 1.7%, and the 10-year Treasury yield declined towards 4.93%. Lower oil prices also supported equities by easing concerns about a renewed acceleration in inflation.
At the same time, labour-market data remain resilient: initial jobless claims fell to 196,000, confirming that employment conditions have not deteriorated sharply. For the index, this combination is mixed. A strong economy supports corporate earnings, but it also gives the Fed room to raise rates further. Oil remains above 100 USD per barrel, so inflation and geopolitical risks persist. In the short term, the market remains dependent on yields, oil prices and reassessment of the Fed's policy path. Valuations also remain highly sensitive to the cost of capital, so another rise in yields could quickly put pressure back on the index. Lower oil prices support risk appetite, but they do not yet remove the threat of another energy-driven inflation impulse.
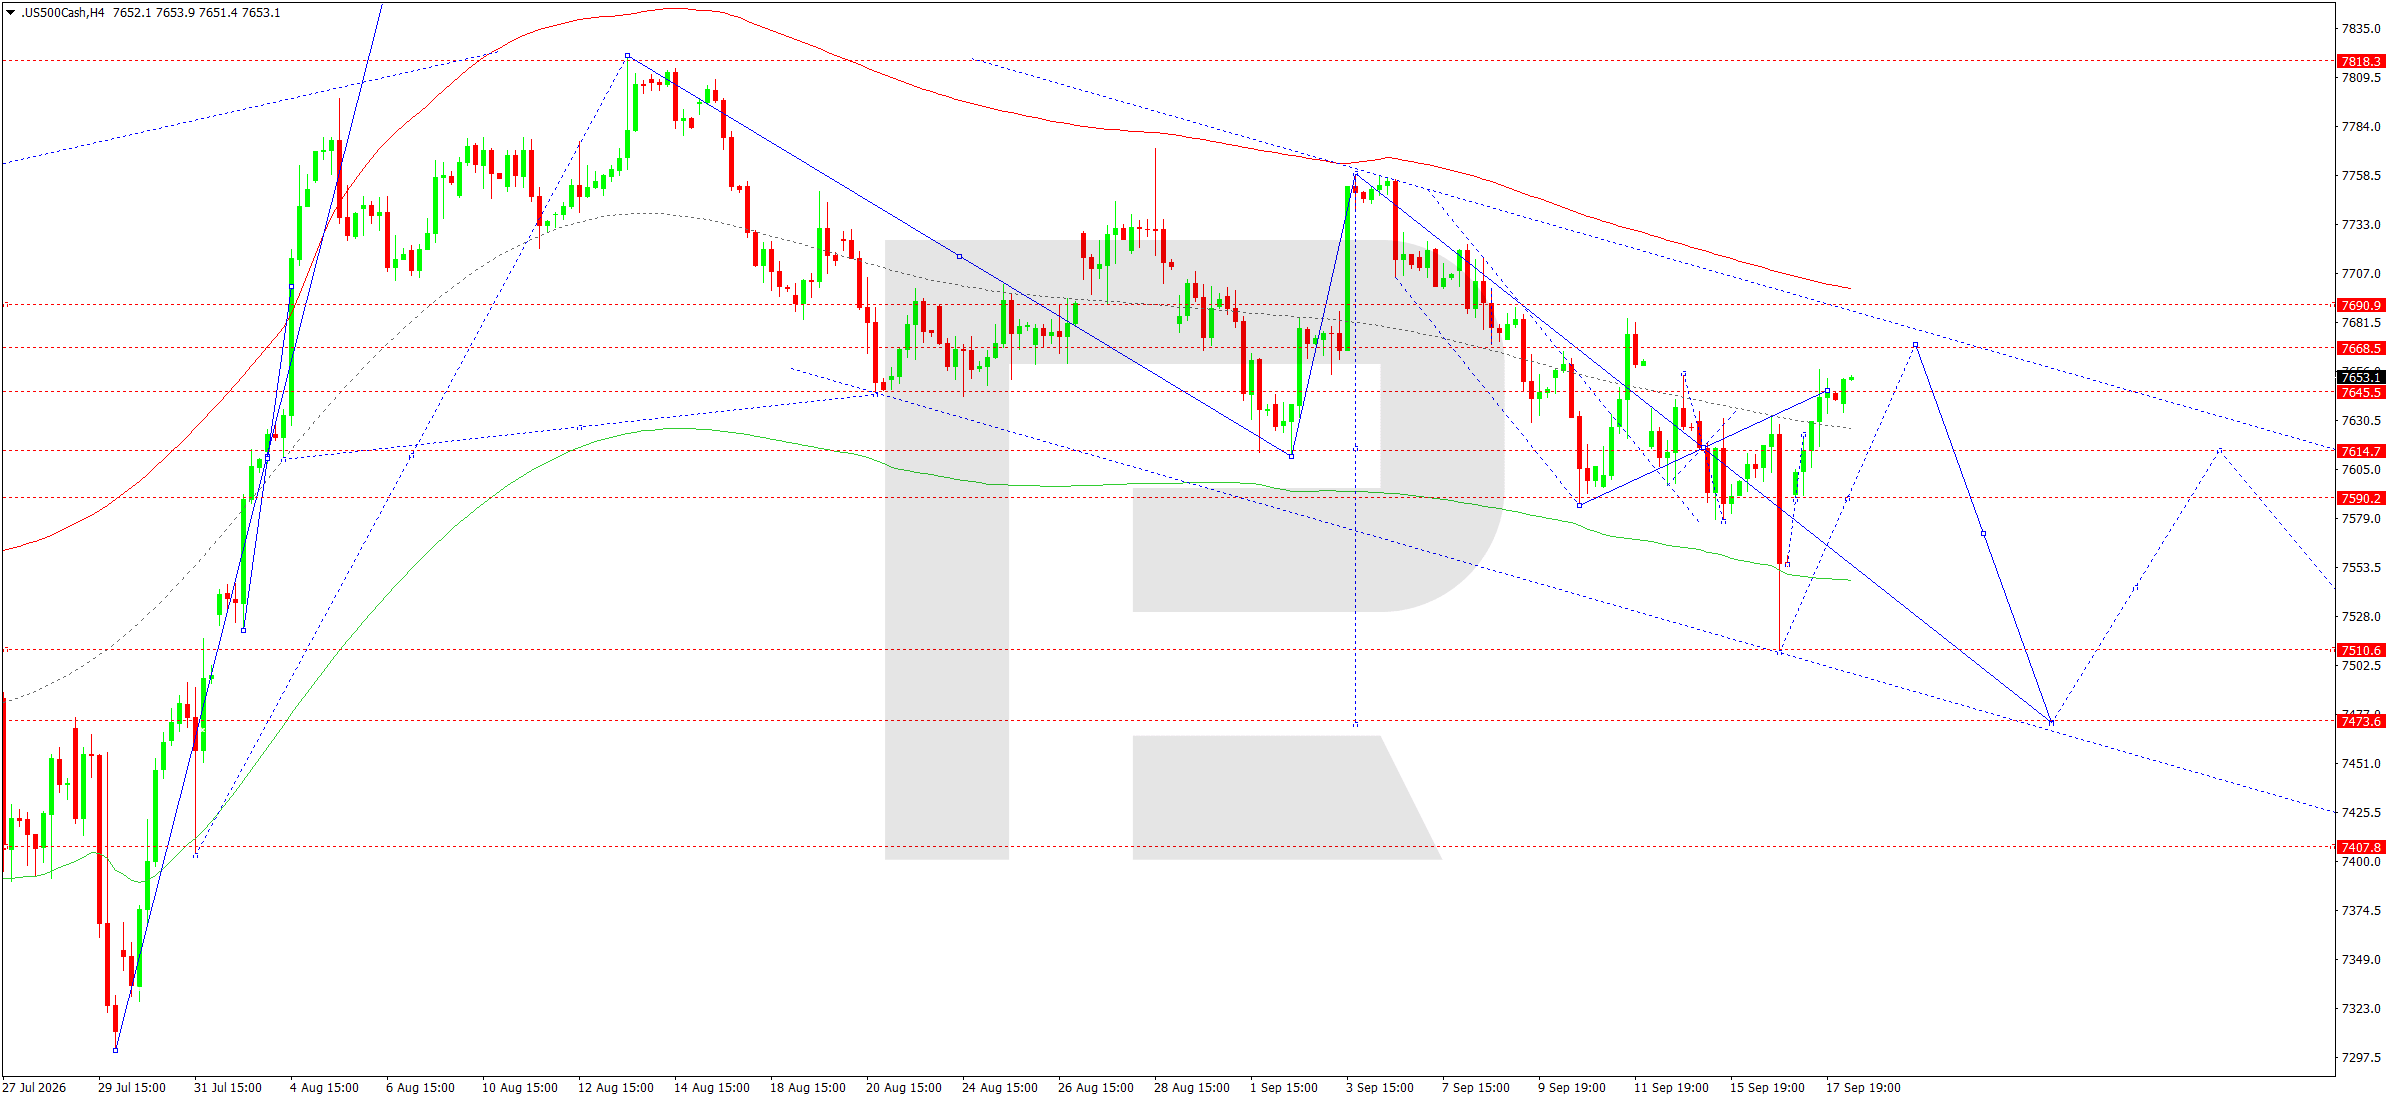
On the H4 chart, after falling towards 7,510, the US 500 formed a recovery wave and returned to the 7,645–7,668 area. With the current price at 7,671, the market is already testing the upper boundary of the local range, making 7,691 the nearest upside target. If momentum persists, a brief move above this level is possible. However, the broader structure from the September high remains bearish, with a descending channel boundary overhead.
The centre of the wave matrix is around 7,615 and continues to act as a pivot point. If the price returns below 7,645, the probability of a move towards 7,590 will increase. A breakout below 7,590 would open the way towards 7,510 and then 7,474, where the next projected target of the downward wave is located. Consolidation above 7,691 would temporarily postpone the downside scenario and allow for a recovery towards 7,740–7,760. Until that confirmation appears, the current rise looks like a correction within the broader bearish structure. For sellers, an important signal would be a return below 7,645 after a test of 7,691. The chart also shows a sequence of lower highs, while the recovery is developing towards the descending trend line.
This increases the importance of the 7,668–7,691 area as resistance. Holding above 7,590 would keep the index within a sideways correction, while a breakout below it would confirm a new downward wave. A stronger bearish signal would emerge after a move below 7,510, opening the way towards 7,474 and the lower boundary of the channel.
US 500 forecast scenario
Trading scenario: SELL
- Price at the time of writing: 7,671
- Entry price: 7,666
- Stop loss: 7,696
- Take profit: 7,590
- Risk-to-reward ratio: 1:2.5
The trade idea is valid until 8:00 AM on 19 September 2026 (server time, UTC+3).
BTCUSD forecast
As of 18 September 2026, Bitcoin remains under pressure from tight US monetary policy but is receiving support from renewed institutional demand. The Federal Reserve raised the target rate range by 25 basis points to 3.75–4.00% on 16 September and delivered a more hawkish signal on the future path of rates. For cryptocurrencies, this is an unfavourable factor, as higher real yields reduce the appeal of high-risk assets and increase the cost of capital.
Outflows from US spot Bitcoin ETFs had previously added further pressure. However, flows improved on 17 September: according to available data, spot ETFs attracted around 159.5 million USD, helping Bitcoin recover above 77,000. Today, the Bank of Japan raised its policy rate to 1.25%, continuing the global tightening cycle, although Bitcoin's reaction has so far remained muted. At the same time, the recovery in US technology shares and the decline in the 10-year Treasury yield towards 4.93% are supporting overall risk appetite. The fundamental balance remains mixed: short-term ETF inflows are supporting the price, but the tight global monetary backdrop is limiting the potential for sustained growth.
Correlation with the technology sector remains another important factor: yesterday's rise in the Nasdaq improved sentiment in the digital asset market. At the same time, high funding costs and the prospect of further Fed rate increases keep the risk of renewed deleveraging elevated. Therefore, a sustained Bitcoin recovery would require not only continued ETF inflows but also stabilisation in bond yields together with stronger global risk appetite.
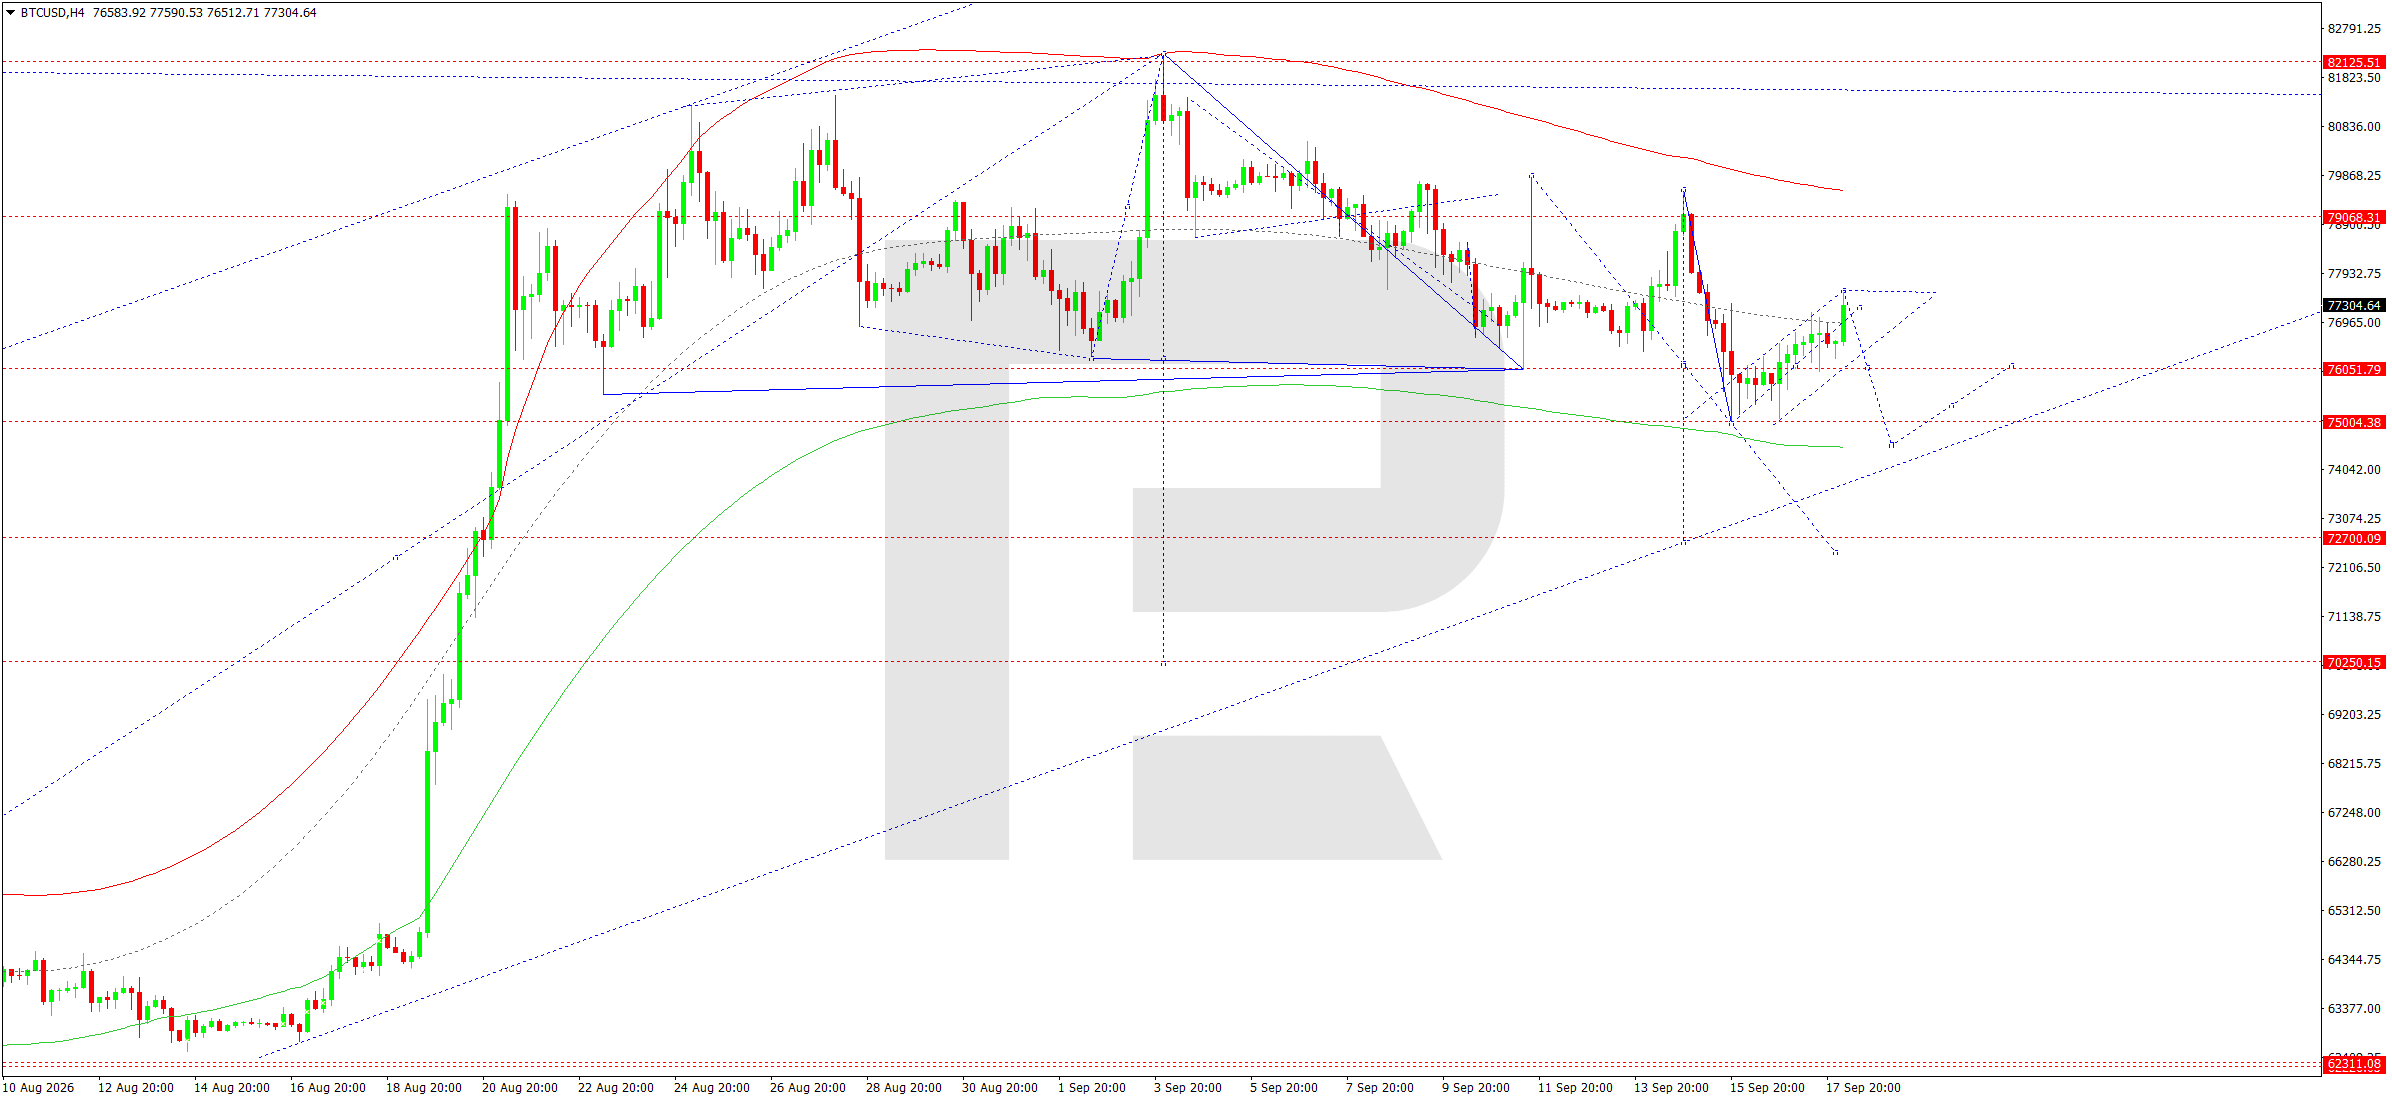
On the H4 chart, BTCUSD completed a corrective recovery from the 75,000 area and returned to resistance at 77,550. This zone acts as both the central line of the local Price Envelope and the upper boundary of the short-term consolidation range. While the price remains below 77,550–77,900, the preferred scenario is a resumption of the decline. The first target is 76,140, with important support near 76,050. A firm breakout below this area would open the way towards 75,000 and then 72,760–72,485.
The centre of the current wave matrix is around 76,132 and, after a breakout, may turn into resistance on a retest from below. The broader structure from the 81,225 high remains bearish, while the sequence of local highs has not yet been broken. Consolidation above 77,900 would ease selling pressure and allow for a rise towards 79,070. For the main scenario to change, the market would need to return sustainably above 79,070 and break through the descending channel boundary. Until that happens, the recovery towards 77,550 is viewed as a correction before another downward wave.
A return below this level would confirm weakening buyer momentum and accelerate the decline. The 75,000 area remains an intermediate support, although another test would increase the probability of a breakout. In that case, the next demand zone is located near 72,760–72,485, where the lower projected boundary of the extended channel and the target of the current wave structure are located.
BTCUSD forecast scenario
Trading scenario: SELL
- Price at the time of writing: 77,435
- Entry price: 77,430
- Stop loss: 77,900
- Take profit: 72,760
- Risk-to-reward ratio: 1:9.9
The trade idea is valid until 8:00 AM on 19 September 2026 (server time, UTC+3).
Editors’ picks
 EURUSD forecast 2026–2027: technical analysis, price levels & predictions
EURUSD has recovered from the July lows and is trading near 1.1545 — back in bullish territory. The pair has reclaimed EMA65 on the daily, formed a bullish EMA crossover on H4, and the US-eurozone GDP gap has narrowed sharply (US 1.5% vs eurozone 1.0%). Goldman Sachs and Deutsche Bank both now target 1.2500 by year-end. A confirmed close above 1.1700 opens the path to 1.1805. We break down the key levels, three trading scenarios, and what the unprecedented 9-3 FOMC dissent vote means for EURUSD.
 Gold (XAUUSD) forecast 2026: technical analysis, price levels & predictions
Gold has reversed its downtrend and is trading near 4,360 USD, back above both EMA65 and EMA200. ETF flows turned positive in July with 3 billion USD of net inflows, and central banks bought 288.9 tonnes in Q2 — up 62% year-on-year. A breakout above 4,500 USD opens the path to 4,855 USD and the 5,597 USD all-time high. We break down the key levels, three trading scenarios with entry triggers, and what J.P. Morgan, Deutsche Bank and Goldman Sachs are forecasting for gold in 2026.
Forecasts presented in this section only reflect the author’s private opinion and should not be considered as guidance for trading. RoboForex bears no responsibility for trading results based on trading recommendations described in these analytical reviews.