
Daily technical analysis and forecast for 21 September 2026
Daily technical analysis and forecast for EURUSD, USDJPY, GBPUSD, AUDUSD, USDCAD, XAUUSD, US 500, and BTCUSD for 21 September 2026.
Each scenario on this page reflects the market structure on the H4 chart as of 10:00 UTC+3 on 21 September 2026. The assessment considers the current H4 chart structure, key support and resistance levels, the direction of the medium-term movement, and the prevailing fundamental backdrop.
EURUSD forecast
As of 21 September 2026, EURUSD begins the week after a series of decisions by major central banks that materially changed the balance of interest-rate expectations. The European Central Bank raised its three key interest rates by 25 basis points on 10 September, taking the deposit rate to 2.50%. The regulator explained the decision by persistent inflationary pressure caused by the conflict in the Middle East and expects average inflation of 3.0% in 2026, with eurozone economic growth at 0.9%. This supports the euro, as the market received confirmation of the ECB's more hawkish stance.
At the same time, the Federal Reserve raised the federal funds target range to 3.75–4.00% on 16 September, emphasising resilient domestic demand and persistently elevated inflation. The interest-rate differential therefore remains in favour of the dollar for now. The global backdrop improved somewhat at the start of Monday: oil retreated from recent highs, Asian equities rose, and demand for safe-haven assets declined. For EURUSD, this creates a mixed picture: the ECB's hawkish stance limits the euro's downside potential, but the Fed's higher policy rate and expectations of further tightening continue to weigh on the pair. For the upcoming session, the key fundamental factor remains the dollar's reaction to US Treasury yields and new comments from Fed officials.
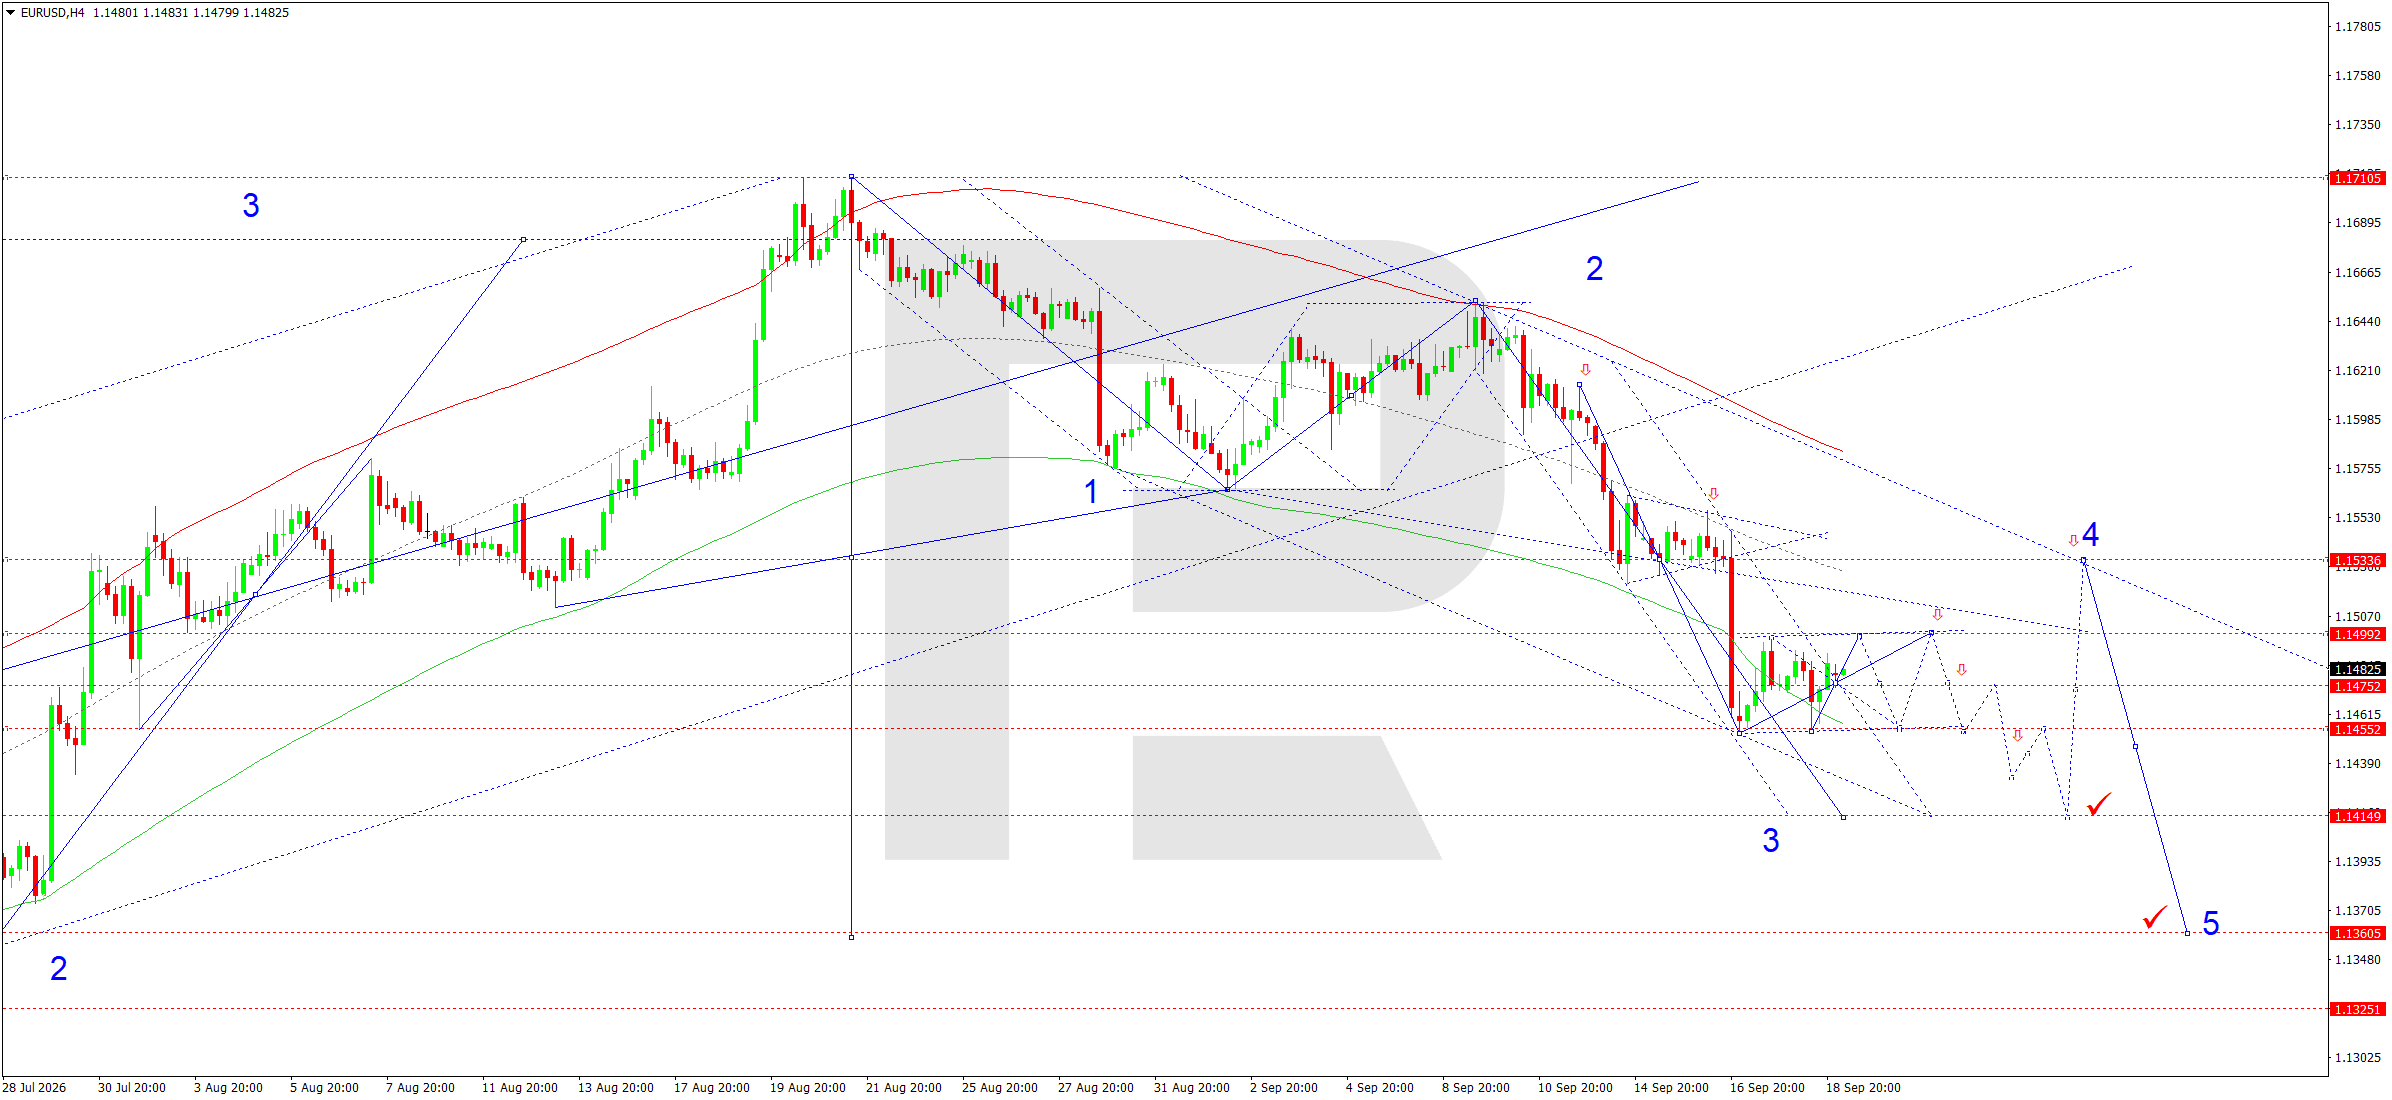
On the H4 chart, EURUSD completed an upward impulse towards 1.1495 and then corrected towards 1.1455. Today, 21 September 2026, the main scenario is the formation of a narrow consolidation range above 1.1475. Within this range, another extension upwards towards 1.1499 is likely, after which the decline towards 1.1475 may resume. If buyers manage to consolidate the price above 1.1499, the correction may continue towards 1.1535, where an important resistance area and the Matrix pivot are located.
The main H4 structure nevertheless remains bearish. The Elliott Wave structure allows for the local correction to complete and the third downward wave to continue. The lower boundary of the Price Envelope in the 1.1453 area has already been tested, so the market may first return towards its central line at 1.1499–1.1535. A firm breakout below 1.1470 would increase selling pressure and open the way towards 1.1415, which is viewed as the target of the third wave. Below this level, the next reference points are 1.1360 and 1.1325, although for today's horizon the priority remains a move towards 1.1415. While the price remains below 1.1535, growth is best viewed as corrective within the broader bearish structure.
Further confirmation of the bearish scenario comes from the price trading below the descending dynamic resistance line and beneath the medium-term moving-average zone. The local rebound from 1.1455 has not yet broken the sequence of lower highs. To invalidate the preferred scenario, sellers would need to lose control of the 1.1535–1.1550 zone; only sustained consolidation above it would restore the potential for a move towards 1.1600 and change the short-term H4 structure. Until then, the preference remains for selling into strength.
EURUSD forecast scenario
Trading scenario: SELL
- Price at the time of writing: 1.1483
- Entry price: 1.1478
- Stop Loss: 1.1505
- Take Profit: 1.1415
- Risk-to-reward ratio: 1:2.33
The trade idea is valid until 8:00 AM on 22 September 2026 (server time, UTC+3).
USDJPY forecast
As of 21 September 2026, USDJPY remains one of the currency pairs most sensitive to interest-rate differentials and intervention expectations. The Bank of Japan raised its key rate to 1.25% on 18 September, the highest level in 31 years. However, the yen did not strengthen after the decision: the market focused on disagreements within the board and the absence of a sufficiently hawkish signal about the pace of further rate increases. As a result, the pair ended last week with a notable rise, while the yen stabilised around 156.85 per dollar on Monday morning.
Another factor is the Federal Reserve, which raised the target rate range to 3.75–4.00% on 16 September. US yields and expectations of further tightening continue to favour the dollar. At the same time, Japanese authorities have stepped up their attention to the currency market following the yen's sharp weakening; reports of rate checks are supporting expectations of possible intervention. The fundamental backdrop therefore remains two-sided: the interest-rate differential supports USDJPY, while the risk of official action and gradual BoJ tightening limit the upside. On the daily horizon, the pair's reaction to the 158.00 area and the dynamics of US bond yields are important.
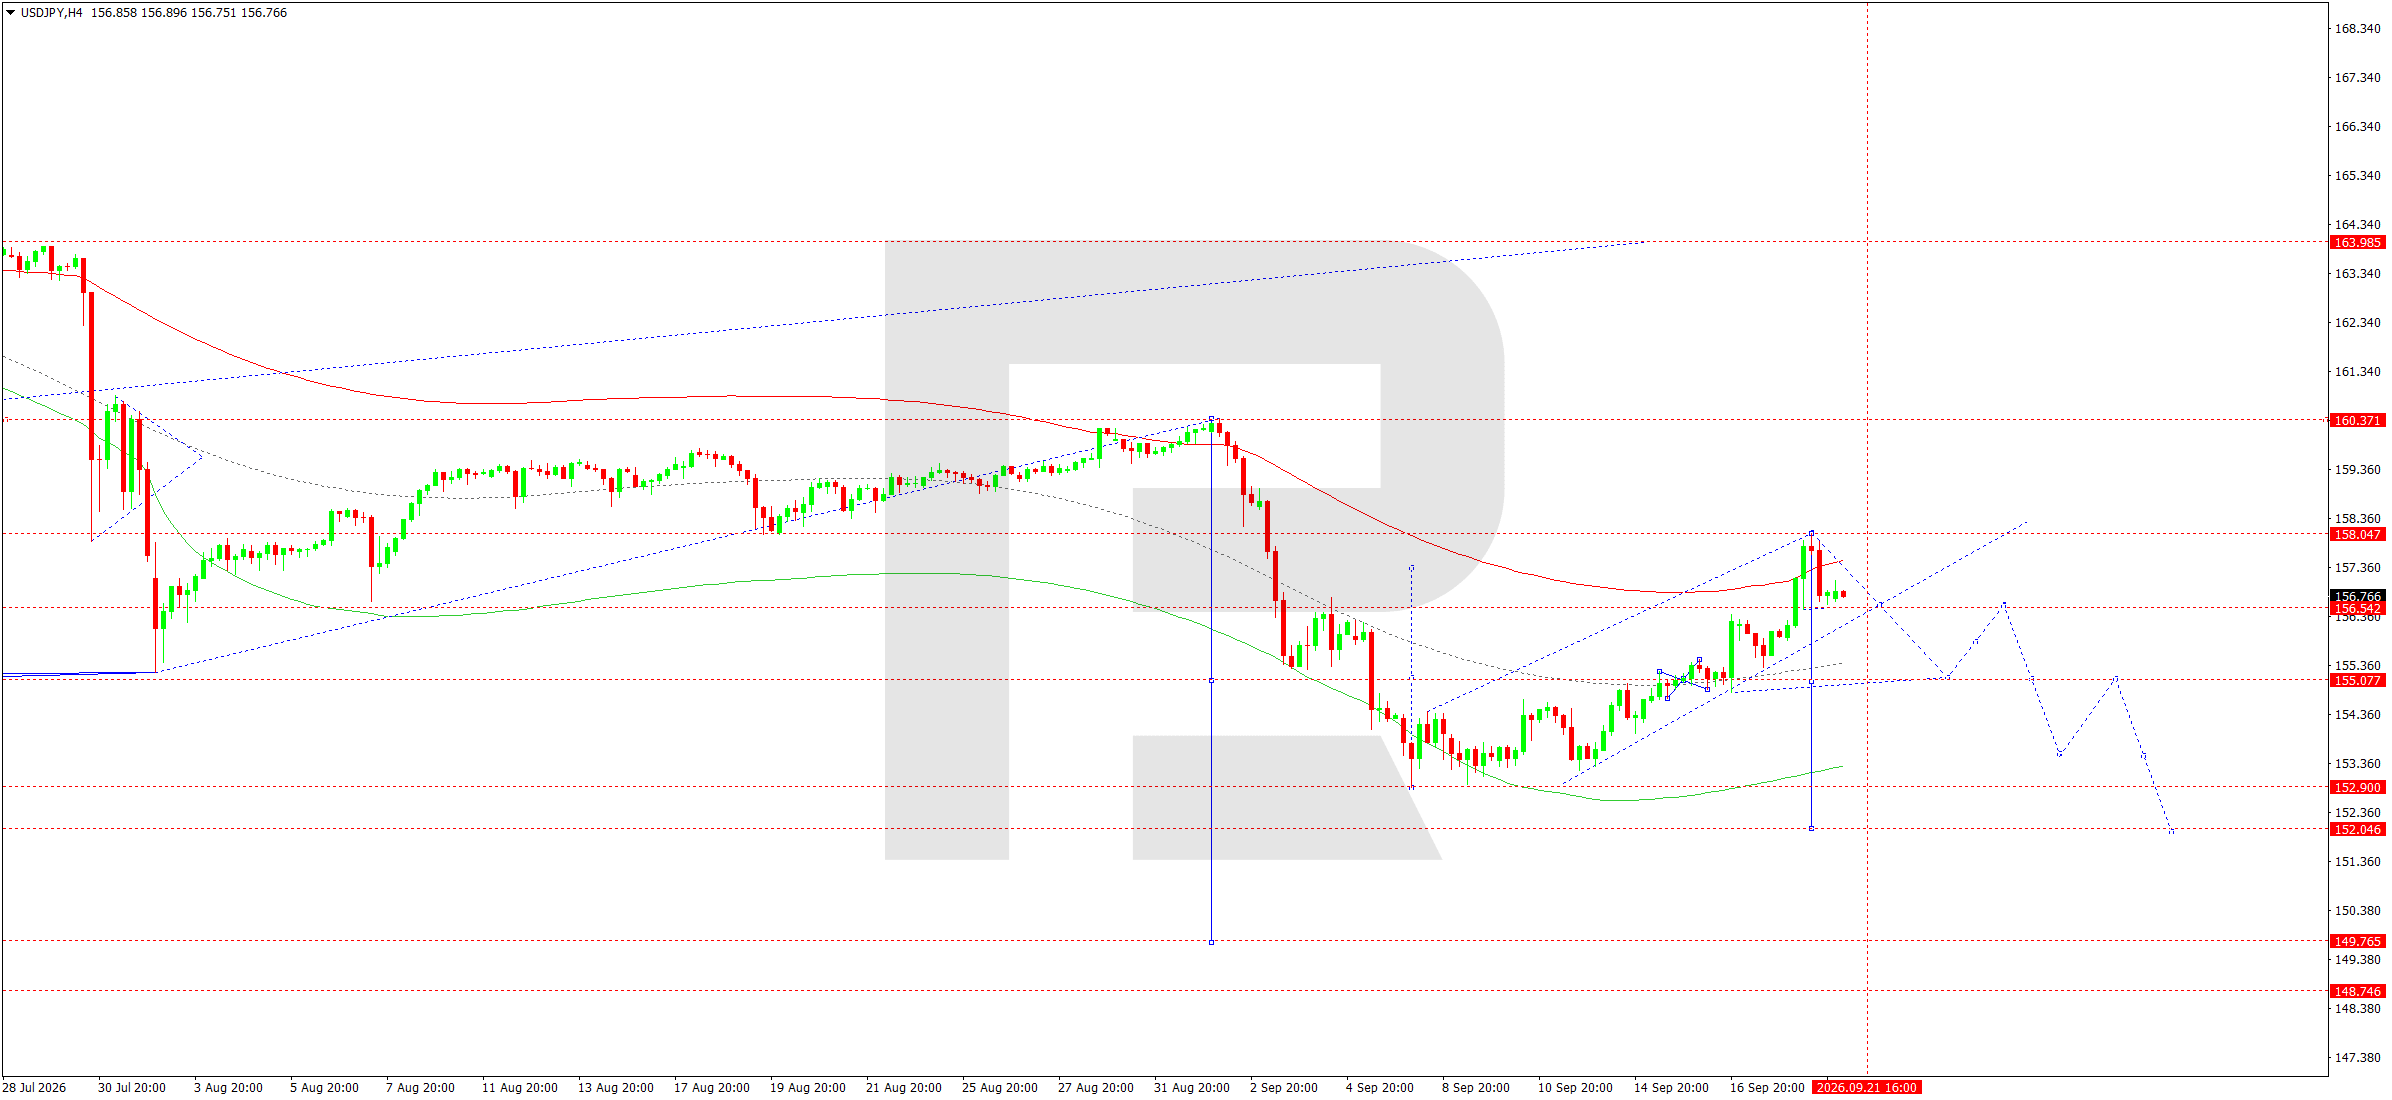
On the H4 chart, USDJPY found support around 156.50 and completed an upward wave towards 158.00. Today, the main scenario is the development of a corrective downward wave back towards 156.50. This zone coincides with an important central area of the Price Envelope and may temporarily hold back sellers. If 156.50 is broken firmly from above, the next target will be 155.00–155.05, where the centre of the wave Matrix is located.
The Elliott Wave structure suggests that the move towards 158.00 may have completed a local upward leg within a broader corrective formation. The upper boundary of the Price Envelope near 158.00 has already been tested, increasing the technical probability of a return towards the central line. Below 155.00, the way would open towards 153.60 and then 152.00–152.05, corresponding to the lower boundary of the Envelope and the next important support. At the same time, consolidation above 158.05 would invalidate the immediate downside scenario and create conditions for another rise. Until such consolidation occurs, the preference remains for a downward correction. The price action after the pullback from 158.00 also confirms the formation of a local high. The nearest resistance is in the 157.40–158.05 zone, while intermediate support lies around 156.50. A move below it should increase selling momentum and accelerate the decline towards 155.05.
For today's session, the reaction to 156.50 will determine whether the correction develops into a full downward wave. The medium-term picture remains complex: the BoJ has raised rates, but the technical chart has not yet confirmed a sustained reversal in favour of the yen. Selling the pair is therefore viewed primarily as trading the correction from the upper boundary of the range. A sequential breakout below 155.05 and 153.60 would be required to change the broader structure; without this, the market may retain elevated volatility between 155.00 and 158.00 over the coming sessions.
USDJPY forecast scenario
Trading scenario: SELL
- Price at the time of writing: 156.77
- Entry price: 156.72
- Stop Loss: 157.60
- Take Profit: 155.05
- Risk-to-reward ratio: 1:1.90
The trade idea is valid until 8:00 AM on 22 September 2026 (server time, UTC+3).
GBPUSD forecast
As of 21 September 2026, the pound remains influenced by a combination of hawkish Bank of England rhetoric and a strong dollar. The Bank of England kept the policy rate unchanged at 3.75% on 17 September, although the decision was taken by a 6–3 majority, with three Monetary Policy Committee members voting for an increase to 4.00%. The regulator noted that UK inflation rose to 3.1% in August and is likely to accelerate further because of the energy shock. This backdrop limits pressure on the pound, as the market must account for the possibility of further policy tightening.
At the same time, the Federal Reserve raised the target rate range to 3.75–4.00% and maintained its focus on the need to return inflation to the 2% target. The dollar is therefore receiving support from higher yields and expectations of additional rate increases. At the start of the week, lower oil prices slightly improved global risk appetite and eased immediate inflation concerns, but this remains a secondary factor for GBPUSD. The main fundamental balance remains neutral to negative: a more hawkish BoE supports sterling, but the strong dollar and investor caution following the central-bank decisions continue to put pressure on the pair.
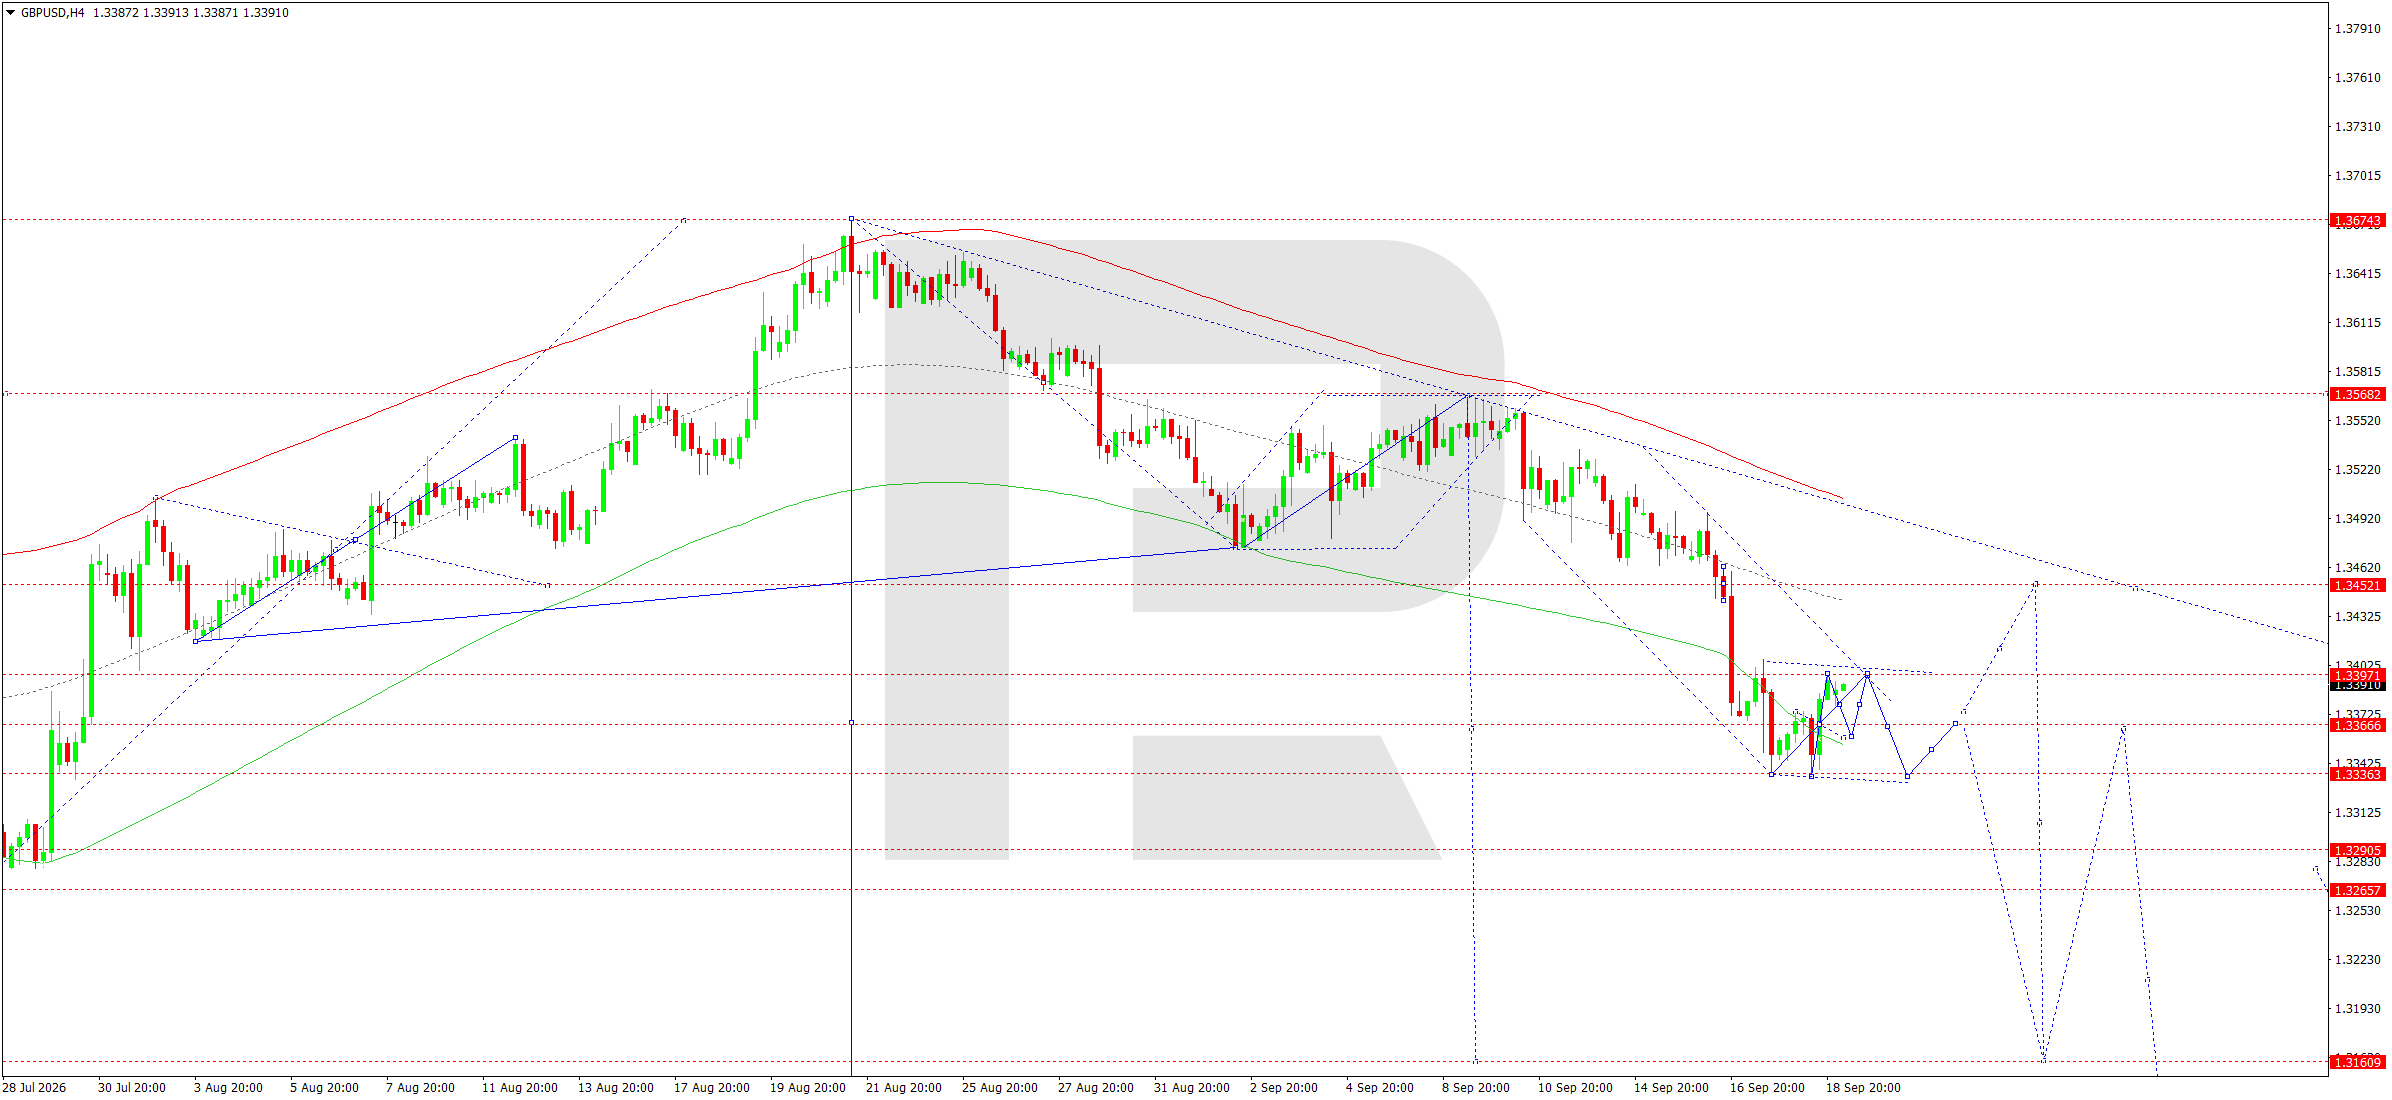
On the H4 chart, GBPUSD completed a downward wave towards 1.3336 and then moved into a local range. Today, an attempt to rise towards 1.3397 is expected while consolidation around 1.3366 continues. This rebound is viewed as a correction within the bearish structure. If the price consolidates firmly above 1.3399, the recovery potential may extend towards 1.3452, where an important Matrix pivot and dynamic resistance area are located.
The main H4 trend remains bearish. The Elliott Wave structure allows for a continuation of the decline after the correction is complete. A return below 1.3366 followed by a breakout below 1.3330 would make 1.3290 the next target, with scope for a subsequent move towards 1.3160. The lower boundary of the Price Envelope around 1.3336 has already been reached, so technically a return towards the central line near 1.3450 is possible before another wave of selling. While the price remains below 1.3452, the bearish scenario retains priority.
Further confirmation comes from the sequence of lower highs and the price trading below the descending resistance line. The 1.3397–1.3452 zone should determine the depth of the correction. A rejection from this area would restore selling pressure and increase the probability of a move towards 1.3290. To invalidate the bearish scenario, the market would need to consolidate firmly above 1.3452 and then break above 1.3520; until then, any rise is better viewed as a technical pullback.
The intraday structure also shows that after the sharp downward impulse, the market moved into accumulation between 1.3336 and 1.3397. A breakout from this zone will provide the next directional signal. Given the price's proximity to the lower part of the range, a brief rise is possible before selling resumes. However, without a breakout above 1.3399, buyers will not gain a technical advantage, while a decline below 1.3330 would confirm continuation of the fifth local wave towards deeper targets of the current trend.
GBPUSD forecast scenario
Trading scenario: SELL
- Price at the time of writing: 1.3391
- Entry price: 1.3386
- Stop Loss: 1.3410
- Take Profit: 1.3290
- Risk-to-reward ratio: 1:4.00
The trade idea is valid until 8:00 AM on 22 September 2026 (server time, UTC+3).
AUDUSD forecast
As of 21 September 2026, AUDUSD is trading against a backdrop of persistently tight Australian monetary policy and a strong US dollar. At its latest meeting, the Reserve Bank of Australia kept the cash rate unchanged at 4.35% after three increases during the year. The regulator emphasised that inflation remains too high and that financial conditions have already tightened significantly. The next RBA decision is scheduled for 29 September, so the market continues to assess the likelihood of restrictive policy remaining in place and the economy's sensitivity to high rates.
The external backdrop for the Australian dollar is mixed. At the start of the week, Asian equity markets received support from the technology sector, oil prices declined, and the yuan strengthened ahead of a meeting between the leaders of the US and China. Improved risk appetite traditionally supports the AUD, but the Federal Reserve raised the target rate range to 3.75–4.00% on 16 September, keeping the dollar attractive from a yield perspective. Fundamentally, the pair therefore remains caught between support from the RBA and China and pressure from a strong US dollar. For the upcoming session, the dynamics of commodity currencies, Chinese assets and US bond yields are important.
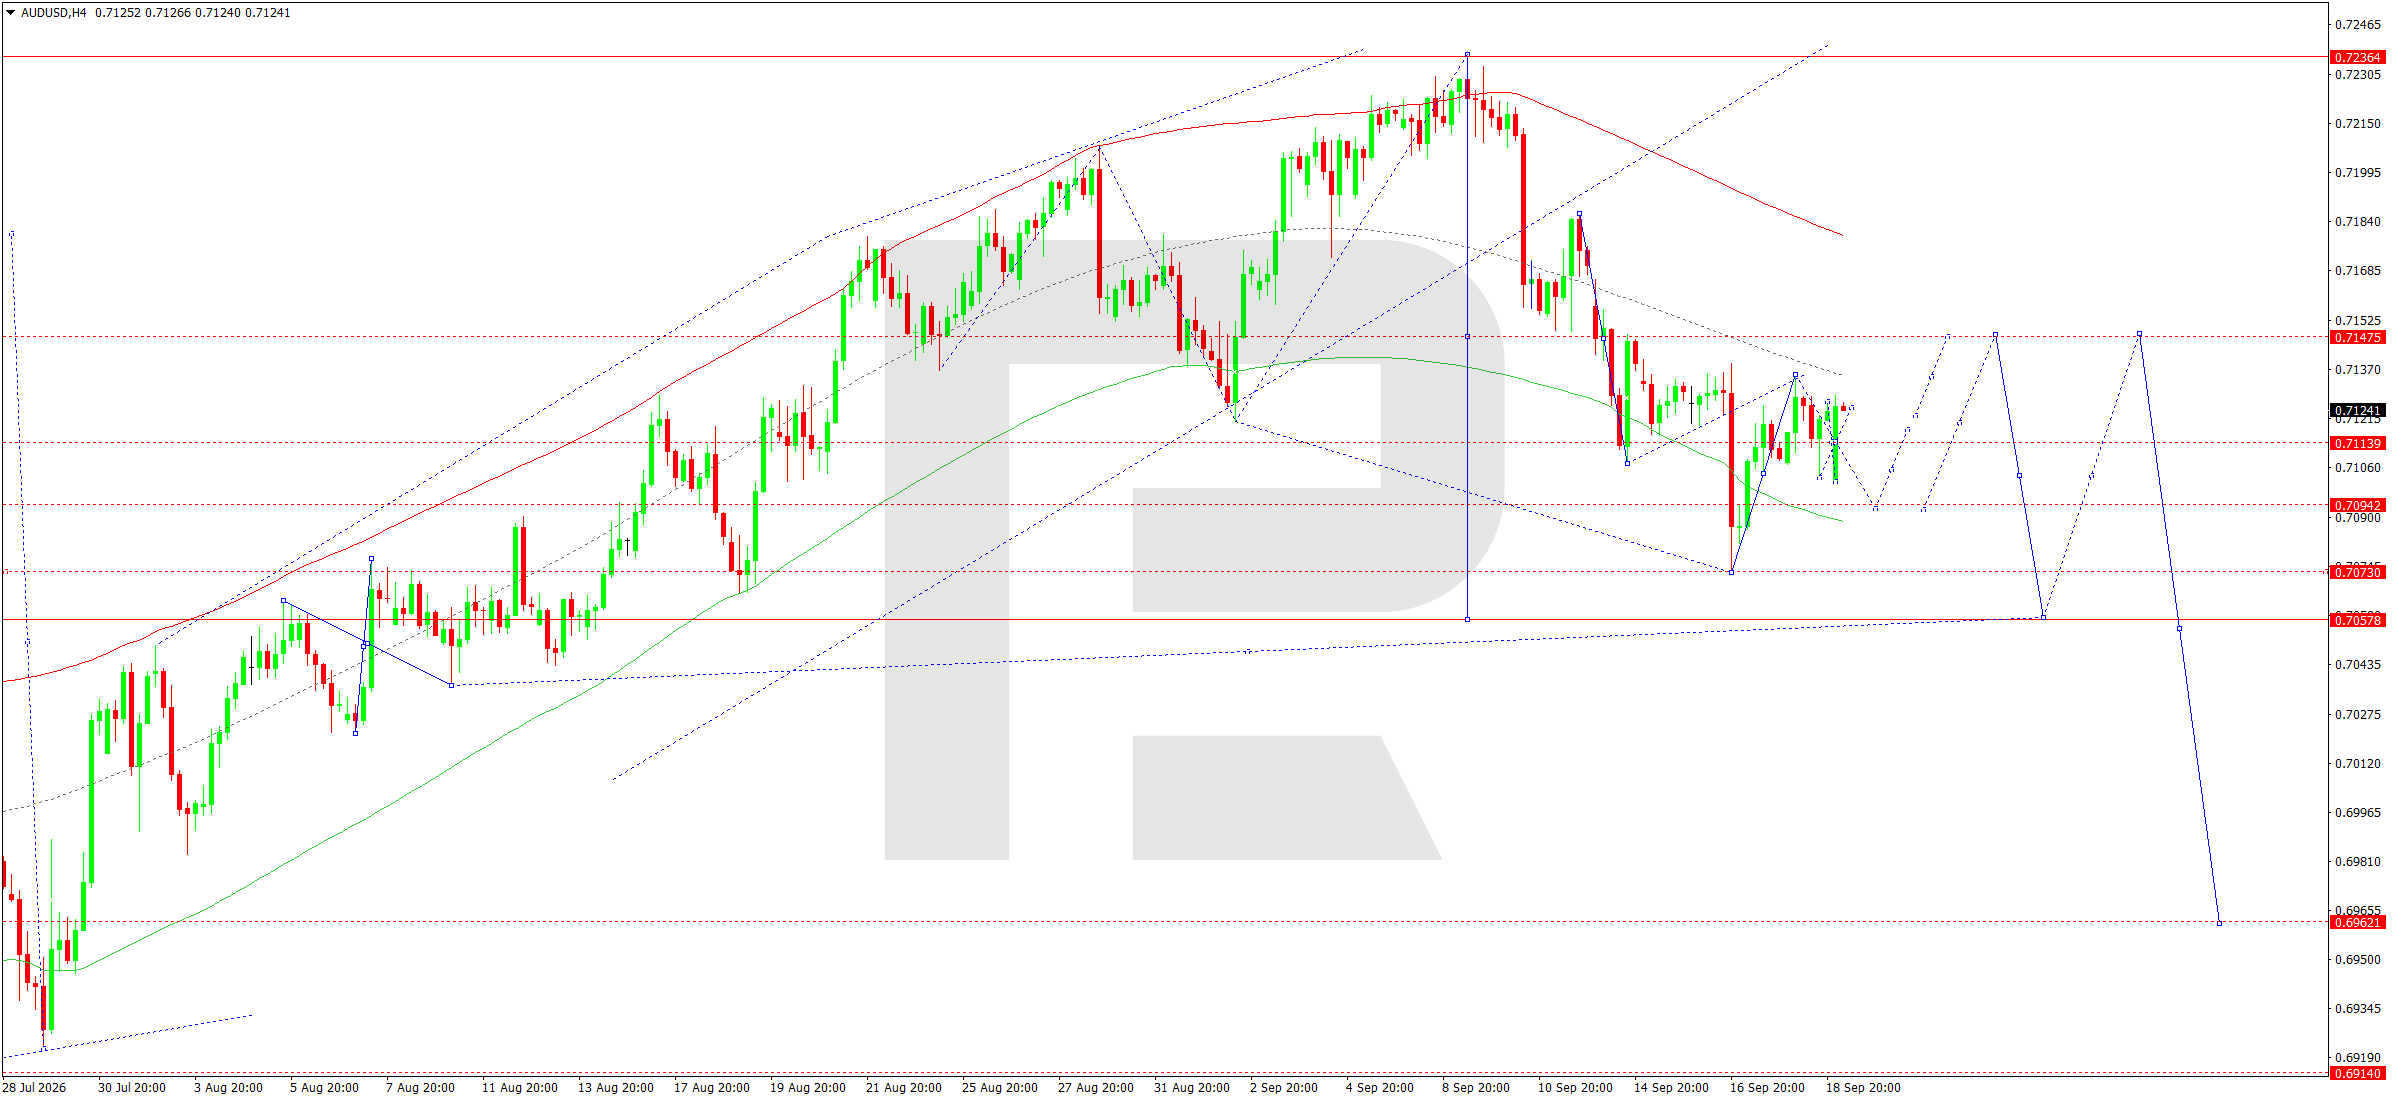
On the H4 chart, AUDUSD completed an upward impulse towards 0.7128 and formed a local consolidation below this level. Today, the main scenario is a decline towards 0.7095 followed by an attempt to recover towards 0.7128 and 0.7147. The 0.7147 level acts as a key resistance zone and the centre of the downward wave Matrix. While the price remains below it, growth is viewed as corrective.
The Elliott Wave structure allows for a continuation of the downward move after the local rebound is complete. The market previously reached 0.7073 and then returned to the central line of the Price Envelope in the 0.7137 area. The next important test is the 0.7092–0.7095 zone. If it holds, another rise towards 0.7147 is possible. However, a firm breakout below 0.7090 would open the way towards 0.7055, which is viewed as the first target of the current wave.
Additional pressure comes from the price trading below the descending moving average and beneath the local resistance line. The sequence of highs since the 0.7236 area remains downward. To change the short-term structure, buyers need to consolidate above 0.7147 and then overcome 0.7180. Until then, the preference remains for selling into strength. A breakout below 0.7055 would strengthen the bearish impulse and open the prospect of a move towards 0.6962, although for today's horizon the main target remains the 0.7055 area. The intraday range of 0.7095–0.7147 is therefore viewed as the main decision-making zone.
A return to the upper boundary without consolidation above it would confirm buyer weakness and create conditions for a new downward wave. Conversely, a rapid rebound from 0.7095 could delay the bearish scenario. On the H4 chart, the decisive signal will be the candle close relative to 0.7090, as this level separates a correction from a continuation of the main downward impulse. While the price remains below 0.7147, the structure continues to favour the downside in the current session.
AUDUSD forecast scenario
Trading scenario: SELL
- Price at the time of writing: 0.7124
- Entry price: 0.7119
- Stop Loss: 0.7148
- Take Profit: 0.7055
- Risk-to-reward ratio: 1:2.21
The trade idea is valid until 8:00 AM on 22 September 2026 (server time, UTC+3).
USDCAD forecast
As of 21 September 2026, USDCAD remains influenced by a notable divergence between US and Canadian monetary policy, as well as fluctuations in the oil market. The Bank of Canada kept its key rate unchanged at 2.25% on 2 September. The regulator noted that headline inflation had remained around 3% in recent months, while core inflation measures stayed closer to 2%. At the same time, the BoC pointed to rising inflation risks due to high energy prices and new trade restrictions between Canada and the US.
The Federal Reserve raised the target rate range to 3.75–4.00% on 16 September, strengthening the dollar's yield advantage. Oil prices declined at the start of Monday amid hopes for improved supply and diplomatic signals surrounding the Middle East. Weaker oil typically worsens the fundamental backdrop for the Canadian dollar, so the current combination of factors is supporting USDCAD. An excessively sharp drop in oil prices could put additional pressure on the CAD. On the daily horizon, the key drivers remain US yields, oil dynamics and expectations regarding the October decisions of the Fed and BoC.
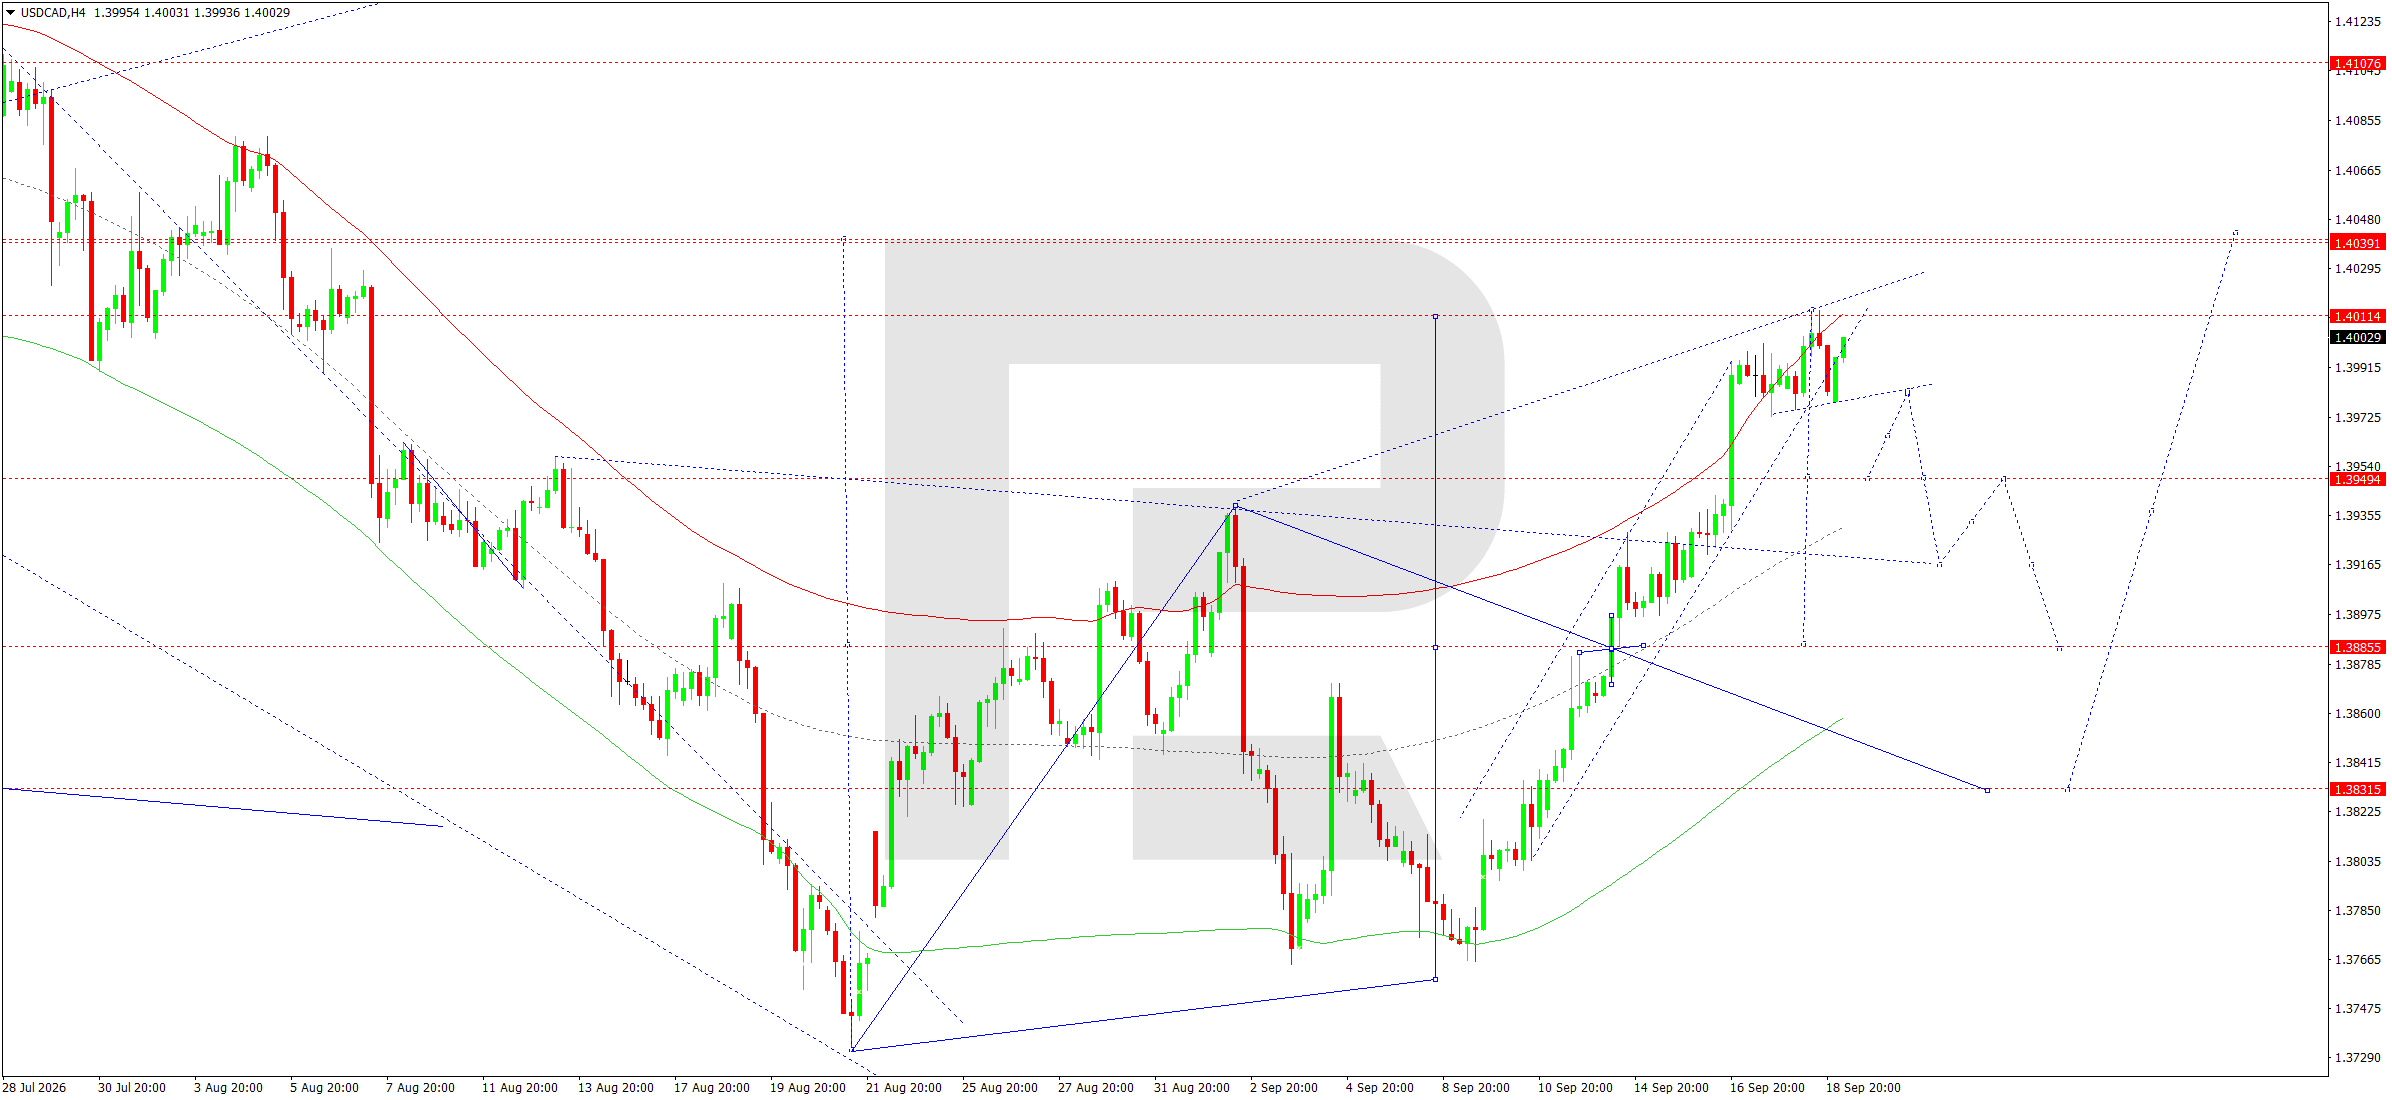
On the H4 chart, USDCAD completed an upward wave towards 1.4011 and approached the upper boundary of the local range. Today, the main scenario is the formation of a compact consolidation below 1.4011. A firm breakout above 1.4015 would create the possibility of extending the rise towards 1.4039. This area acts as the nearest resistance and a potential point for the current upward impulse to complete.
The main technical structure nevertheless allows for a subsequent correction. The centre of the upward wave Matrix is around 1.3885, coinciding with an important support area. If the price exits the range to the downside and breaks below 1.3978, the next target will be 1.3949 and then 1.3885. The upper boundary of the Price Envelope near 1.4011 is already being tested, so the probability of a pullback after the impulse completes is increasing.
The Elliott Wave structure also allows for the local fifth upward wave to complete and transition into a correction. While the price holds above 1.3978, the bullish impulse remains intact, although upside potential is limited by the 1.4011–1.4039 area.
Consolidation above 1.4039 would invalidate the immediate corrective scenario and open the way towards 1.4108. Conversely, a return below 1.3978 would signal weakening buyer momentum and increase the probability of a move towards 1.3885. On the H4 chart, it is important to note that the rise from the September low has developed with virtually no deep correction, making the 1.4011–1.4039 area a natural zone for profit-taking.
Local support at 1.3949 should show whether buyers retain control after the first pullback. If this level is broken from above, the structure will begin to shift into a corrective phase. Until then, another test of 1.4011 remains possible, but the preference for a new position is shifting towards selling from resistance, targeting a return to the centre of the Matrix and the lower part of the current range around 1.3885 over the next few market sessions.
USDCAD forecast scenario
Trading scenario: SELL
- Price at the time of writing: 1.4003
- Entry price: 1.3998
- Stop Loss: 1.4040
- Take Profit: 1.3885
- Risk-to-reward ratio: 1:2.69
The trade idea is valid until 8:00 AM on 22 September 2026 (server time, UTC+3).
XAUUSD forecast
As of 21 September 2026, gold begins the week amid a conflicting combination of tighter US monetary policy and persistent geopolitical risks. The Federal Reserve raised the target rate range to 3.75–4.00% on 16 September, which under normal conditions increases pressure on gold by raising the opportunity cost of holding a non-yielding asset. The metal initially declined after the decision but rose by more than 2% the following day as the dollar weakened and Treasury yields fell.
Gold continues to receive additional support from tensions in the Middle East and the associated demand for safe-haven assets. At the same time, oil prices declined on the morning of 21 September and global risk appetite improved, temporarily reducing defensive demand. The fundamental backdrop therefore remains two-sided: the Fed's high policy rate limits the potential for sustained growth, while geopolitics and a possible decline in yields support demand for the metal. For today's session, the key factors will be the dynamics of the dollar, US bonds and the flow of Middle East news.
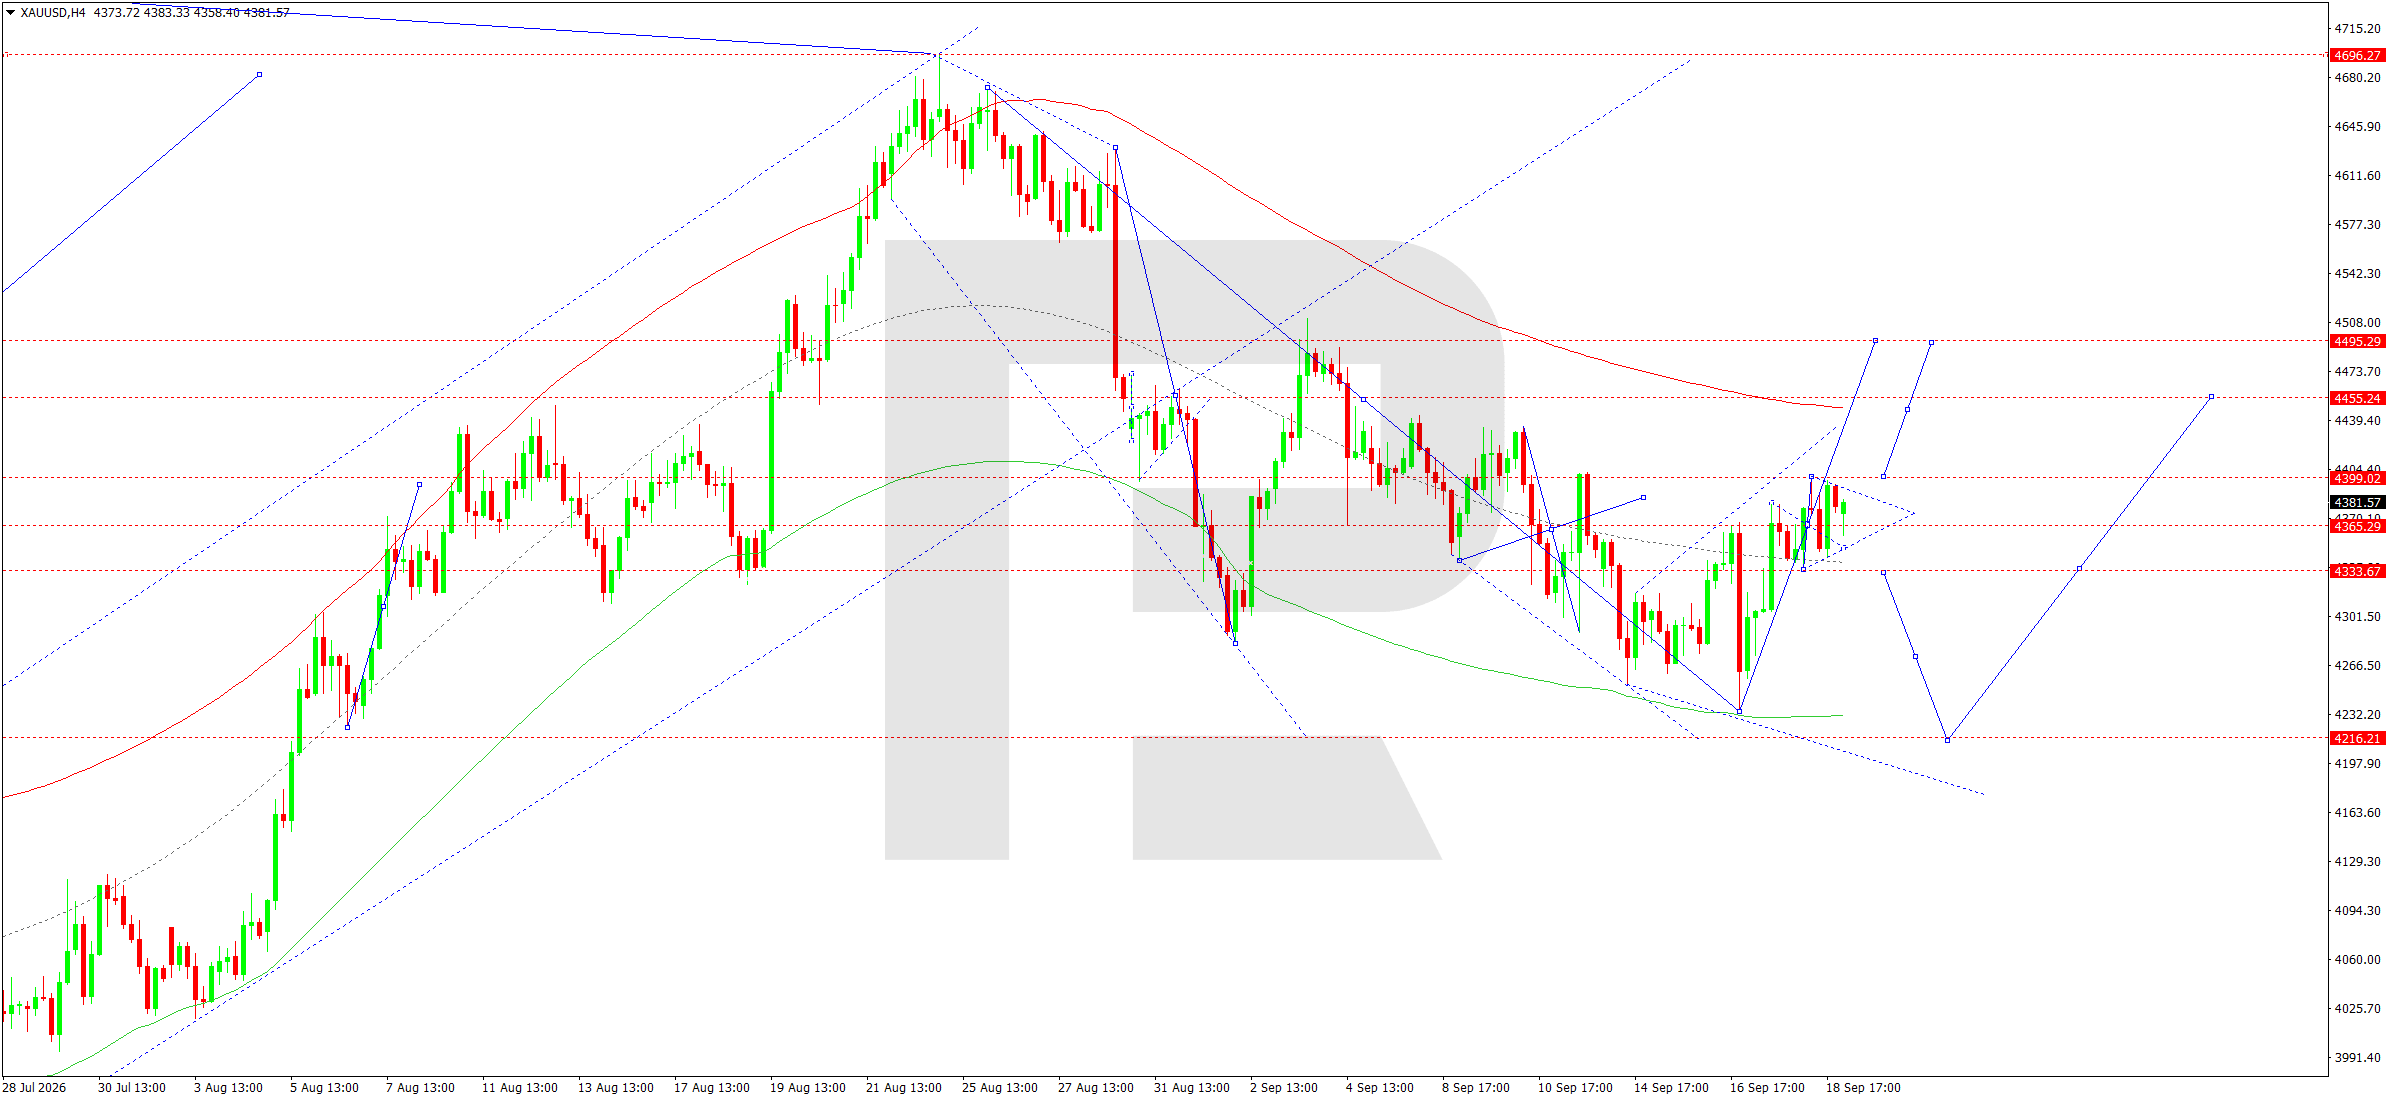
On the H4 chart, XAUUSD continues to develop a broad consolidation range around 4,365. After recovering from the 4,235 area, the price formed an upward wave towards 4,399 and then returned to local accumulation. Today, the main scenario is continued trading below 4,399 with the possibility of extending the upward leg towards 4,455 and then 4,495. This trajectory is consistent with an expanding triangle, which allows for elevated volatility before a directional breakout.
The centre of the downward wave Matrix is around 4,465.
The upper boundary of the Price Envelope is near 4,495, so a rise towards this zone is viewed primarily as a correction within a broader bearish structure. Once the correction is complete, a return towards 4,365 and 4,333 is expected. A firm breakout below 4,333 would open the potential for a decline towards 4,216, which acts as the first major target.
The Elliott Wave structure allows for another upward impulse before the decline resumes. While the price holds above 4,333, buyers retain the opportunity to test 4,455–4,495. However, consolidation below 4,333 would shift the short-term balance in favour of sellers. To invalidate the medium-term bearish scenario, the market would need to consolidate firmly above 4,495 and then continue towards 4,696.
Until then, the 4,455–4,495 area is viewed as a potential zone for the correction to complete and a new downward pivot to form. The intraday structure shows that the 4,365 area remains the central balance point of the current consolidation. A return below it after a test of 4,399 would be the first sign of weakening buyer momentum, while consolidation above 4,399 would increase the probability of a move towards 4,455. As the market is trading between strong levels, momentum may develop sharply. The most important confirmation of growth would be a breakout above 4,399, while confirmation of the subsequent decline would be a return below 4,365 followed by a test of support at 4,333 and an extension towards 4,216.
XAUUSD forecast scenario
Trading scenario: BUY
- Price at the time of writing: 4,382
- Entry price: 4,387
- Stop Loss: 4,333
- Take Profit: 4,495
- Risk-to-reward ratio: 1:2.00
The trade idea is valid until 8:00 AM on 22 September 2026 (server time, UTC+3).
US 500 forecast
As of 21 September 2026, the US 500 index begins the week after a strong market reaction to the Federal Reserve's decision. On 16 September, the Fed raised the target rate range to 3.75–4.00% and emphasised that inflation remains elevated while the economy continues to grow at a steady pace. For the equity market, this means interest rates remain high and financing stays more expensive, limiting equity multiples and making the technology sector particularly sensitive to changes in Treasury yields.
At the same time, Monday begins against a more favourable external backdrop. Oil has retreated, Asian markets have risen, and demand for technology shares is being supported by expectations of further investment growth in artificial-intelligence infrastructure. US equity-index futures also moved higher. The fundamental picture for the US 500 therefore remains mixed: a hawkish Fed creates medium-term pressure, while lower oil prices, calmer yields and sustained demand for technology shares support short-term risk appetite. For today's session, the key issue is whether the index can sustain its rise despite the high cost of capital.
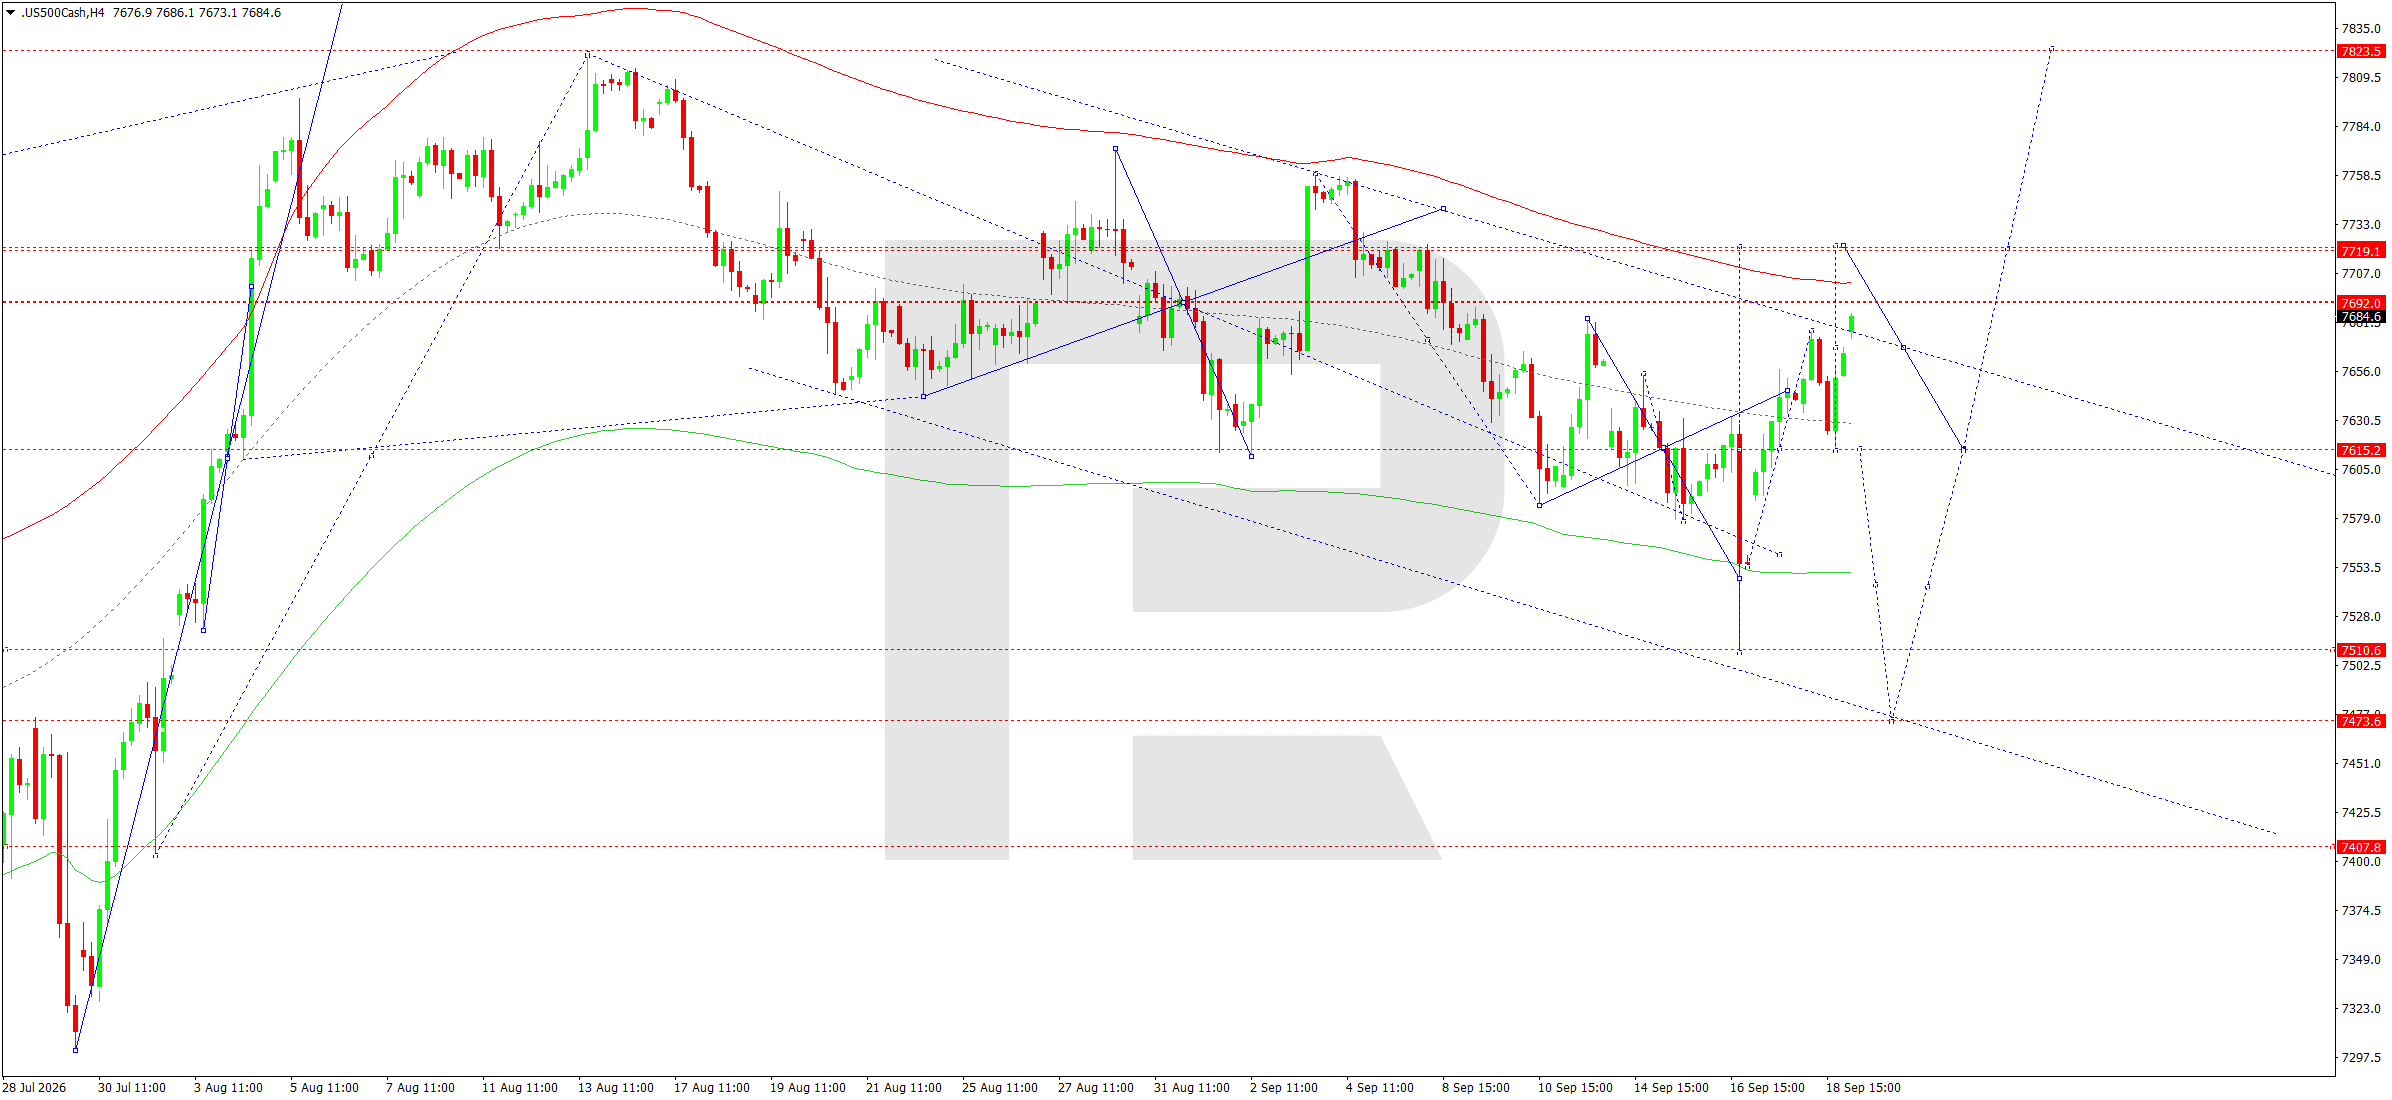
On the H4 chart, the US 500 completed an upward structure towards the 7,667–7,692 area and formed a local consolidation range around this zone. Today, the main scenario is an attempt to extend the move towards 7,719. If buyers manage to consolidate above 7,719, the next target will be the 7,823 area, corresponding to the upper boundary of the broader technical range. While the price remains above 7,615, the short-term bullish impulse remains intact.
The centre of the current wave Matrix is around 7,615. This level also acts as key support and the central line of the Price Envelope. After a possible rise towards 7,719, the market may return to 7,615 for a retest from above. A firm breakout below 7,615 would change the structure and open the way towards 7,511 and then 7,474. At this stage, this remains an alternative scenario that requires confirmation.
The Elliott Wave structure allows for the local upward impulse to complete in the 7,719 area and for a correction to form. However, while the sequence of lows remains rising, buyers retain the advantage. Support at 7,615 should determine the next direction: holding this level would allow another attack on 7,719, while an H4 close below it would strengthen sellers. A firm move below 7,511 is required to invalidate the bullish scenario. Until then, declines are viewed as corrections within the recovery from the September low.
The intraday range of 7,615–7,719 therefore remains the main working zone. The current price is closer to the upper part of the range, increasing the likelihood of a resistance test in the first half of the session. If the breakout proves false, a return below 7,692 would signal weakening momentum. If 7,692 holds, the market may continue towards 7,719 and then move on to the broader target at 7,823. This remains the preferred scenario while support at 7,615 holds on an H4 closing basis.
US 500 forecast scenario
Trading scenario: BUY
- Price at the time of writing: 7,685
- Entry price: 7,690
- Stop Loss: 7,658
- Take Profit: 7,823
- Risk-to-reward ratio: 1:4.16
The trade idea is valid until 8:00 AM on 22 September 2026 (server time, UTC+3).
BTCUSD forecast
As of 21 September 2026, BTCUSD begins the week amid a conflicting combination of improved global risk appetite and tighter US monetary policy. The Federal Reserve raised the target rate range to 3.75–4.00% on 16 September, maintaining pressure on assets that are sensitive to liquidity and the cost of capital. For Bitcoin, high real and nominal yields remain a restraining factor because they increase the appeal of dollar-denominated instruments and reduce demand for risk.
At the same time, the market backdrop on Monday morning looks moderately positive: Asian equities rose, the technology sector received support from the artificial intelligence theme, and lower oil prices eased some inflation concerns. This supports demand for high-risk assets. However, the cryptocurrency market also remains affected by regulatory uncertainty: last week, the US Senate failed to advance a comprehensive digital-assets regulation bill, after which Bitcoin and crypto-related shares came under pressure. Fundamentally, BTCUSD therefore retains elevated volatility and remains dependent on the broader behaviour of the dollar, yields and the equity market.
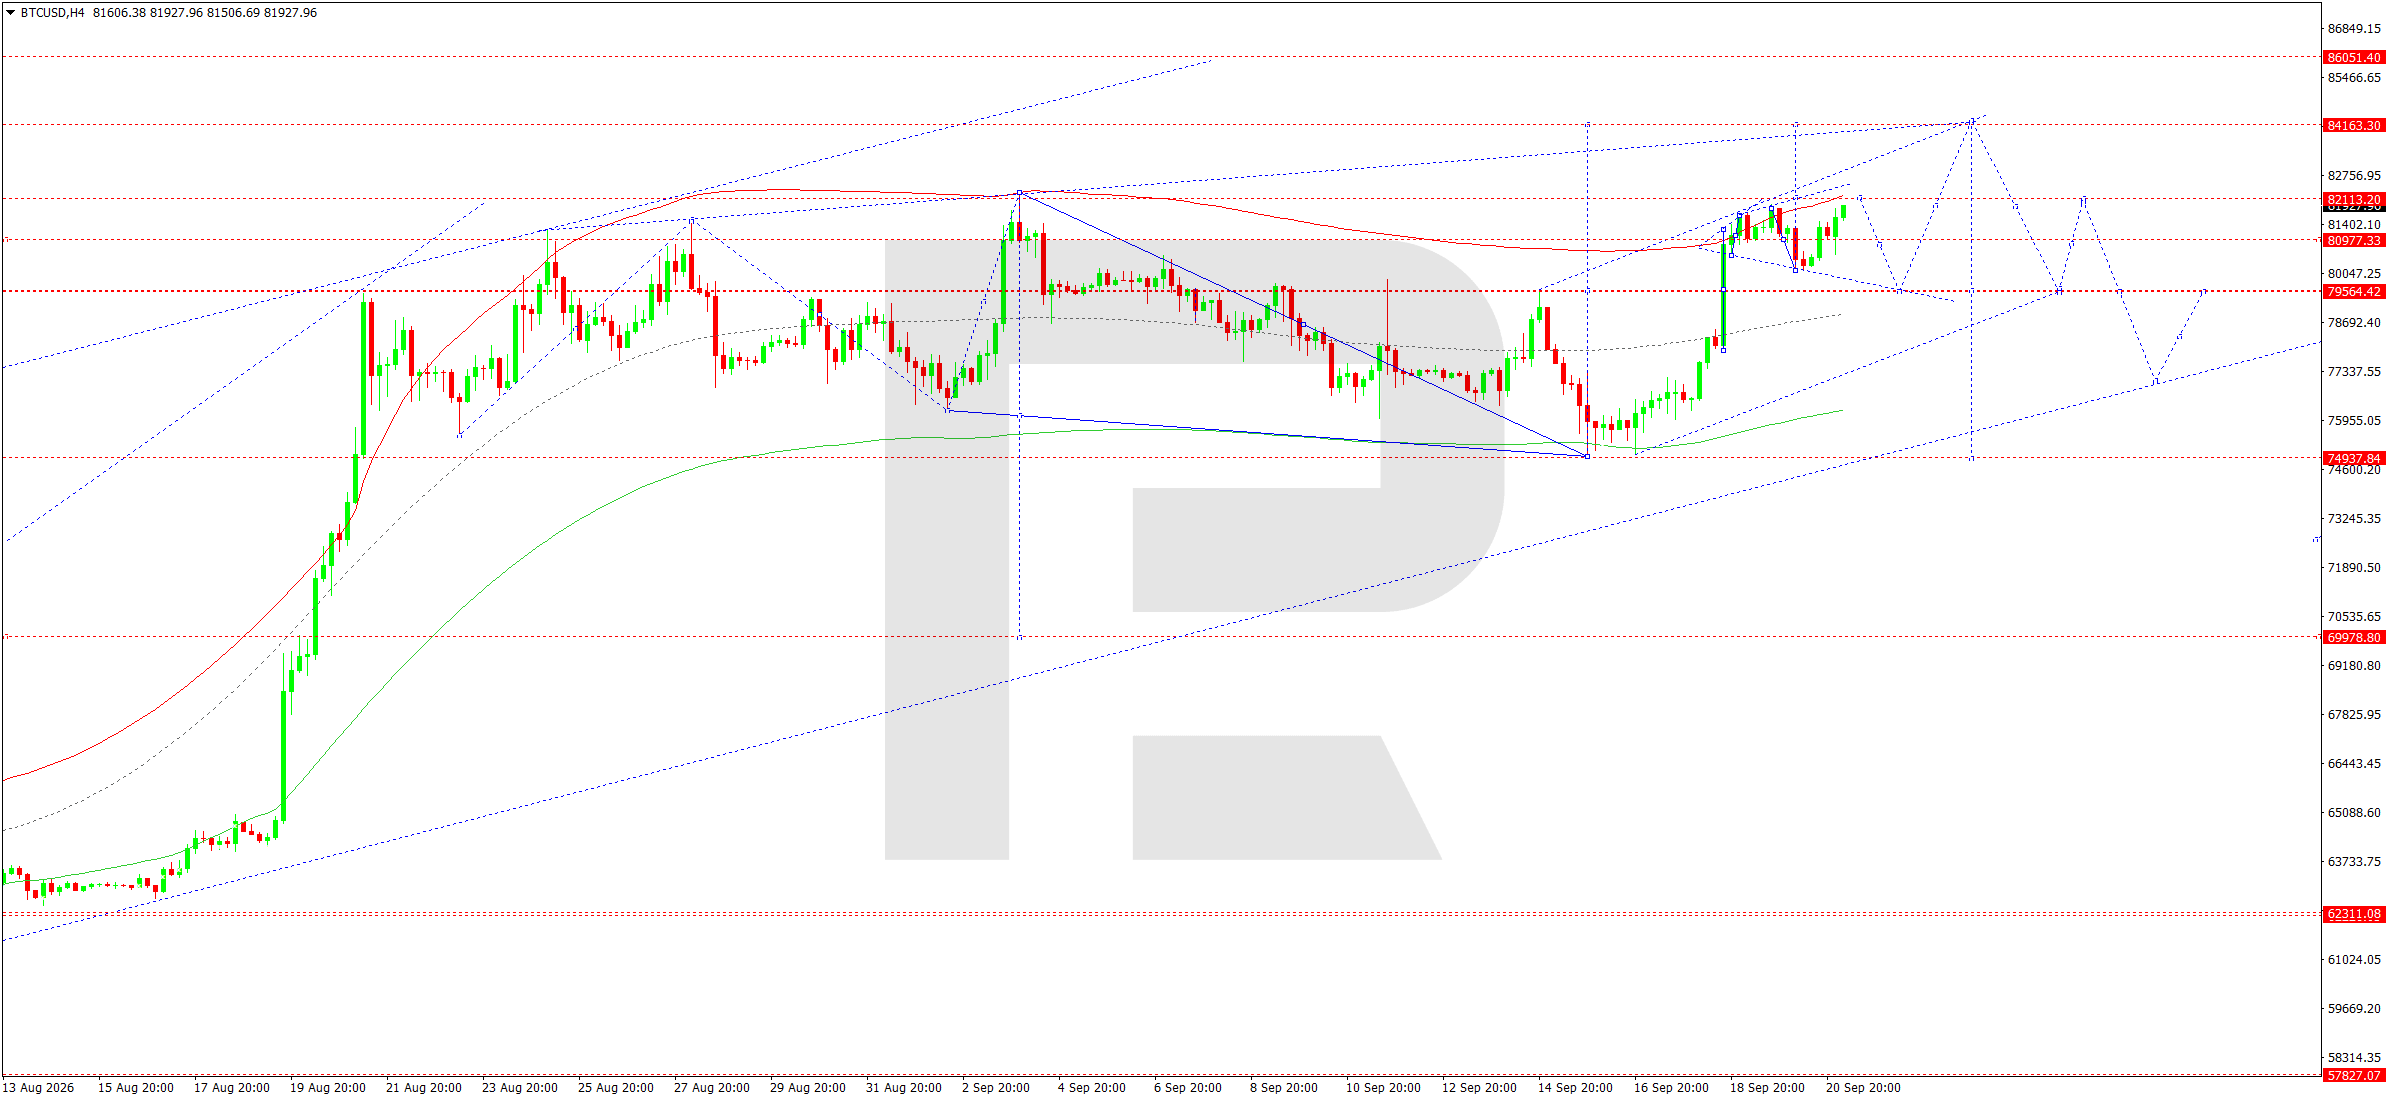
On the H4 chart, BTCUSD completed an upward structure towards 82,113 and formed a consolidation range directly below this resistance. Today, the main scenario is the start of a corrective wave towards 79,564. This level acts as the centre of the wave Matrix and the central line of the Price Envelope. A test of this level will help assess whether the potential for the medium-term recovery remains intact.
After a correction towards 79,564, a new upward wave towards 84,164 is possible, where an important upper boundary of the current structure is located. However, a subsequent return towards 79,564 remains likely. If sellers firmly break below this level, the way will open towards 74,955 and then 72,485. In that case, the downward correction would broaden and disrupt the local bullish sequence.
The Elliott Wave structure suggests that the move towards 82,113 may have completed a local upward impulse. The price is near the upper boundary of the Price Envelope, so the risk of profit-taking has increased. The first confirmation of a correction would come on a move below 80,977 followed by a breakout below 79,564. To invalidate the bearish intraday scenario, the market would need to consolidate above 82,113; this would allow it to continue directly towards 84,164. Until then, the preference remains for a downward correction.
An additional technical factor is the broad ascending channel, whose lower boundary lies well below current levels. This allows the market to correct without damaging the medium-term structure. Therefore, a decline towards 79,564 is currently viewed as a normal pullback after strong growth. Only a breakout below 74,955 would alter the broader picture and bring deeper downside targets back into focus. On the daily horizon, the reaction to 80,977 will provide the first directional signal. If the level fails to hold, sellers will gain the advantage and may develop a move towards the centre of the Matrix. Holding 80,977, by contrast, would preserve the possibility of another test of 82,113 before a deeper correction begins.
BTCUSD forecast scenario
Trading scenario: SELL
- Price at the time of writing: 81,928
- Entry price: 81,923
- Stop Loss: 82,700
- Take Profit: 79,564
- Risk-to-reward ratio: 1:3.04
The trade idea is valid until 8:00 AM on 22 September 2026 (server time, UTC+3).
Editors’ picks
 EURUSD forecast 2026–2027: technical analysis, price levels & predictions
The EURUSD outlook for 2026 and 2027: key levels on the daily chart, three trading scenarios and the policy gap between the Fed and the ECB that drives the pair.
 Gold (XAUUSD) forecast 2026: technical analysis, price levels & predictions
Where gold could trade in 2026: key levels, three trading scenarios with entry triggers and the forecasts from J.P. Morgan, Deutsche Bank and Goldman Sachs.
Forecasts presented in this section only reflect the author’s private opinion and should not be considered as guidance for trading. RoboForex bears no responsibility for trading results based on trading recommendations described in these analytical reviews.