
Daily technical analysis and forecast for 26 October 2026
Daily technical analysis and forecast for EURUSD, USDJPY, GBPUSD, AUDUSD, USDCAD, XAUUSD, US 500, and BTCUSD for 26 October 2026.
Each scenario on this page reflects the market structure on the H4 chart as of 10:00 AM UTC+3 on 26 October 2026. The assessment considers the current H4 chart structure, key support and resistance levels, the direction of the medium-term movement, and the prevailing fundamental backdrop.
EURUSD forecast
EURUSD begins the trading week with investors focused on forthcoming central bank decisions. The US Federal Reserve and the European Central Bank are due to meet this week. Market participants largely expect interest rates to remain unchanged, making policymakers' comments on future monetary policy particularly significant.
Falling US government bond yields are also limiting dollar strength. Meanwhile, inflation risks associated with high energy costs and geopolitical tensions in the Middle East persist. A modest decline in oil prices is helping stabilise market expectations.
For the euro, the eurozone growth outlook and possible changes in interest rate differentials remain important. Forthcoming US consumer confidence, PCE inflation, and gross domestic product data could alter short-term expectations for Fed policy. The fundamental backdrop allows for a local euro recovery, although the sustainability of gains remains limited.
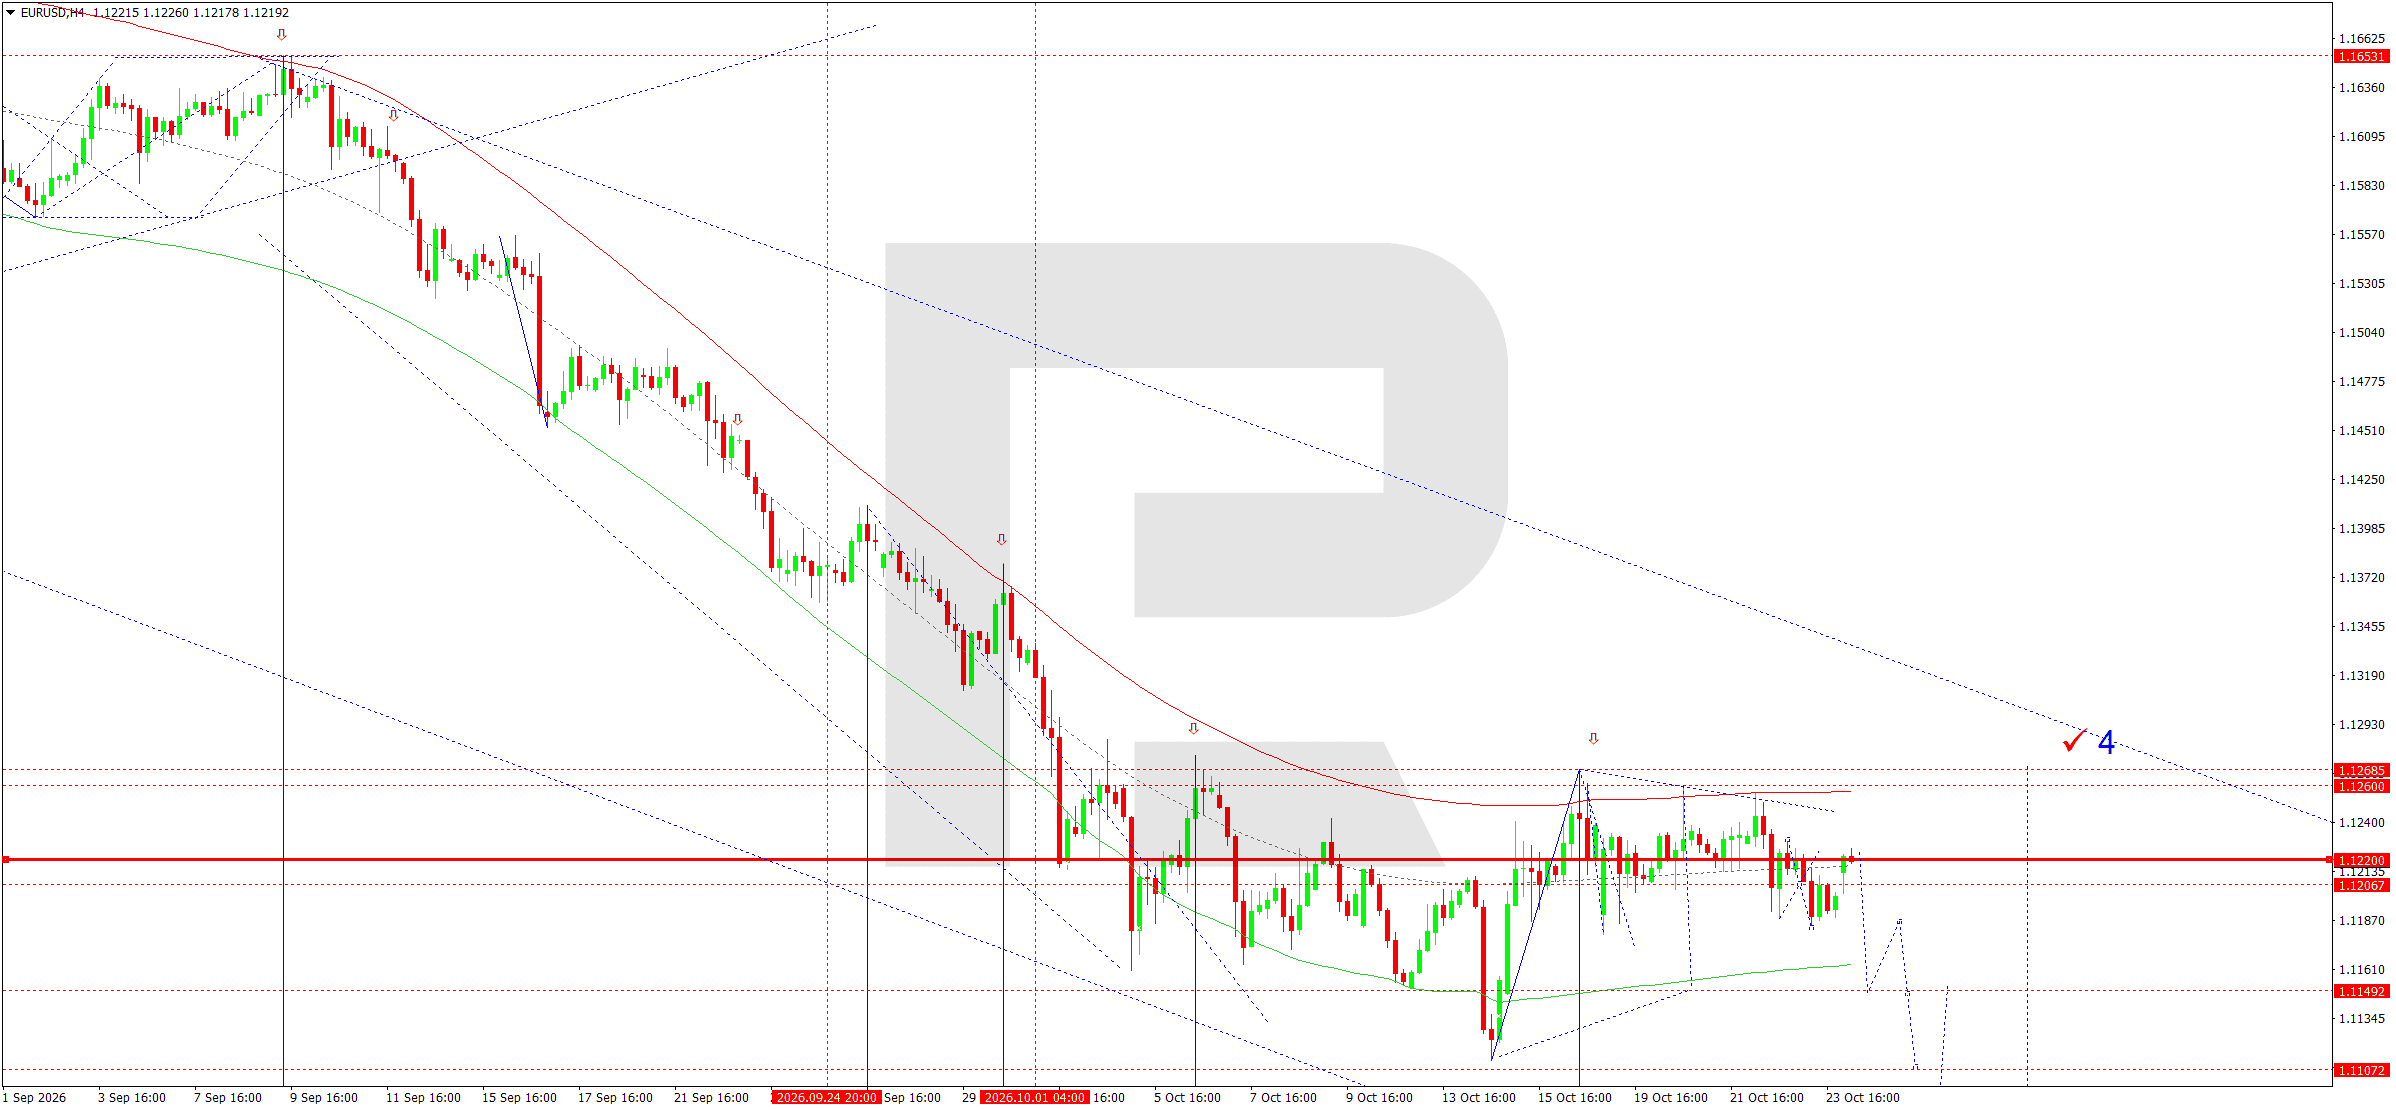
On the H4 chart, EURUSD declined to 1.1183 before correcting upwards to 1.1215. Today, 26 October, consolidation may develop around 1.1222, the pivot of the current wave matrix.
The main trend remains bearish. A sideways range below the 1.1222 resistance level could precede a renewed decline. A breakout below 1.1200 would create conditions for a move towards 1.1150 and then 1.1100.
The Elliott wave structure suggests continued selling pressure once the local correction ends. Prices remaining below the upper boundary of the Price Envelope provide additional confirmation. A breakout below 1.1100 would open the way towards 1.1085, the Envelope's lower boundary.
An alternative scenario suggests consolidation above 1.1222 followed by a test of resistance at 1.1260. Selling remains preferable until the price overcomes this level. In the medium term, the bearish structure allows for a move towards 1.0800 if selling pressure persists.
EURUSD forecast scenario
USDJPY forecast
The Japanese yen begins the week amid uncertainty over future monetary policy decisions. The Bank of Japan is preparing for its next meeting, at which market participants largely expect current monetary policy settings to remain unchanged. However, subsequent comments on inflation and wages could significantly alter investor expectations.
US government bond yields remain important for USDJPY. Falling yields on ten-year US Treasuries reduce the dollar's appeal relative to the yen and encourage a corrective move.
The energy market adds uncertainty. High oil prices increase import costs for Japan, although signs of easing geopolitical tensions could partly limit this effect.
Investors are also focusing on this week's Fed decision. Expectations of unchanged rates are already partly priced in, so comments on future policy changes could be the main source of volatility. In the short term, fundamental conditions allow for yen appreciation, although the overall interest rate differential continues to support the dollar.
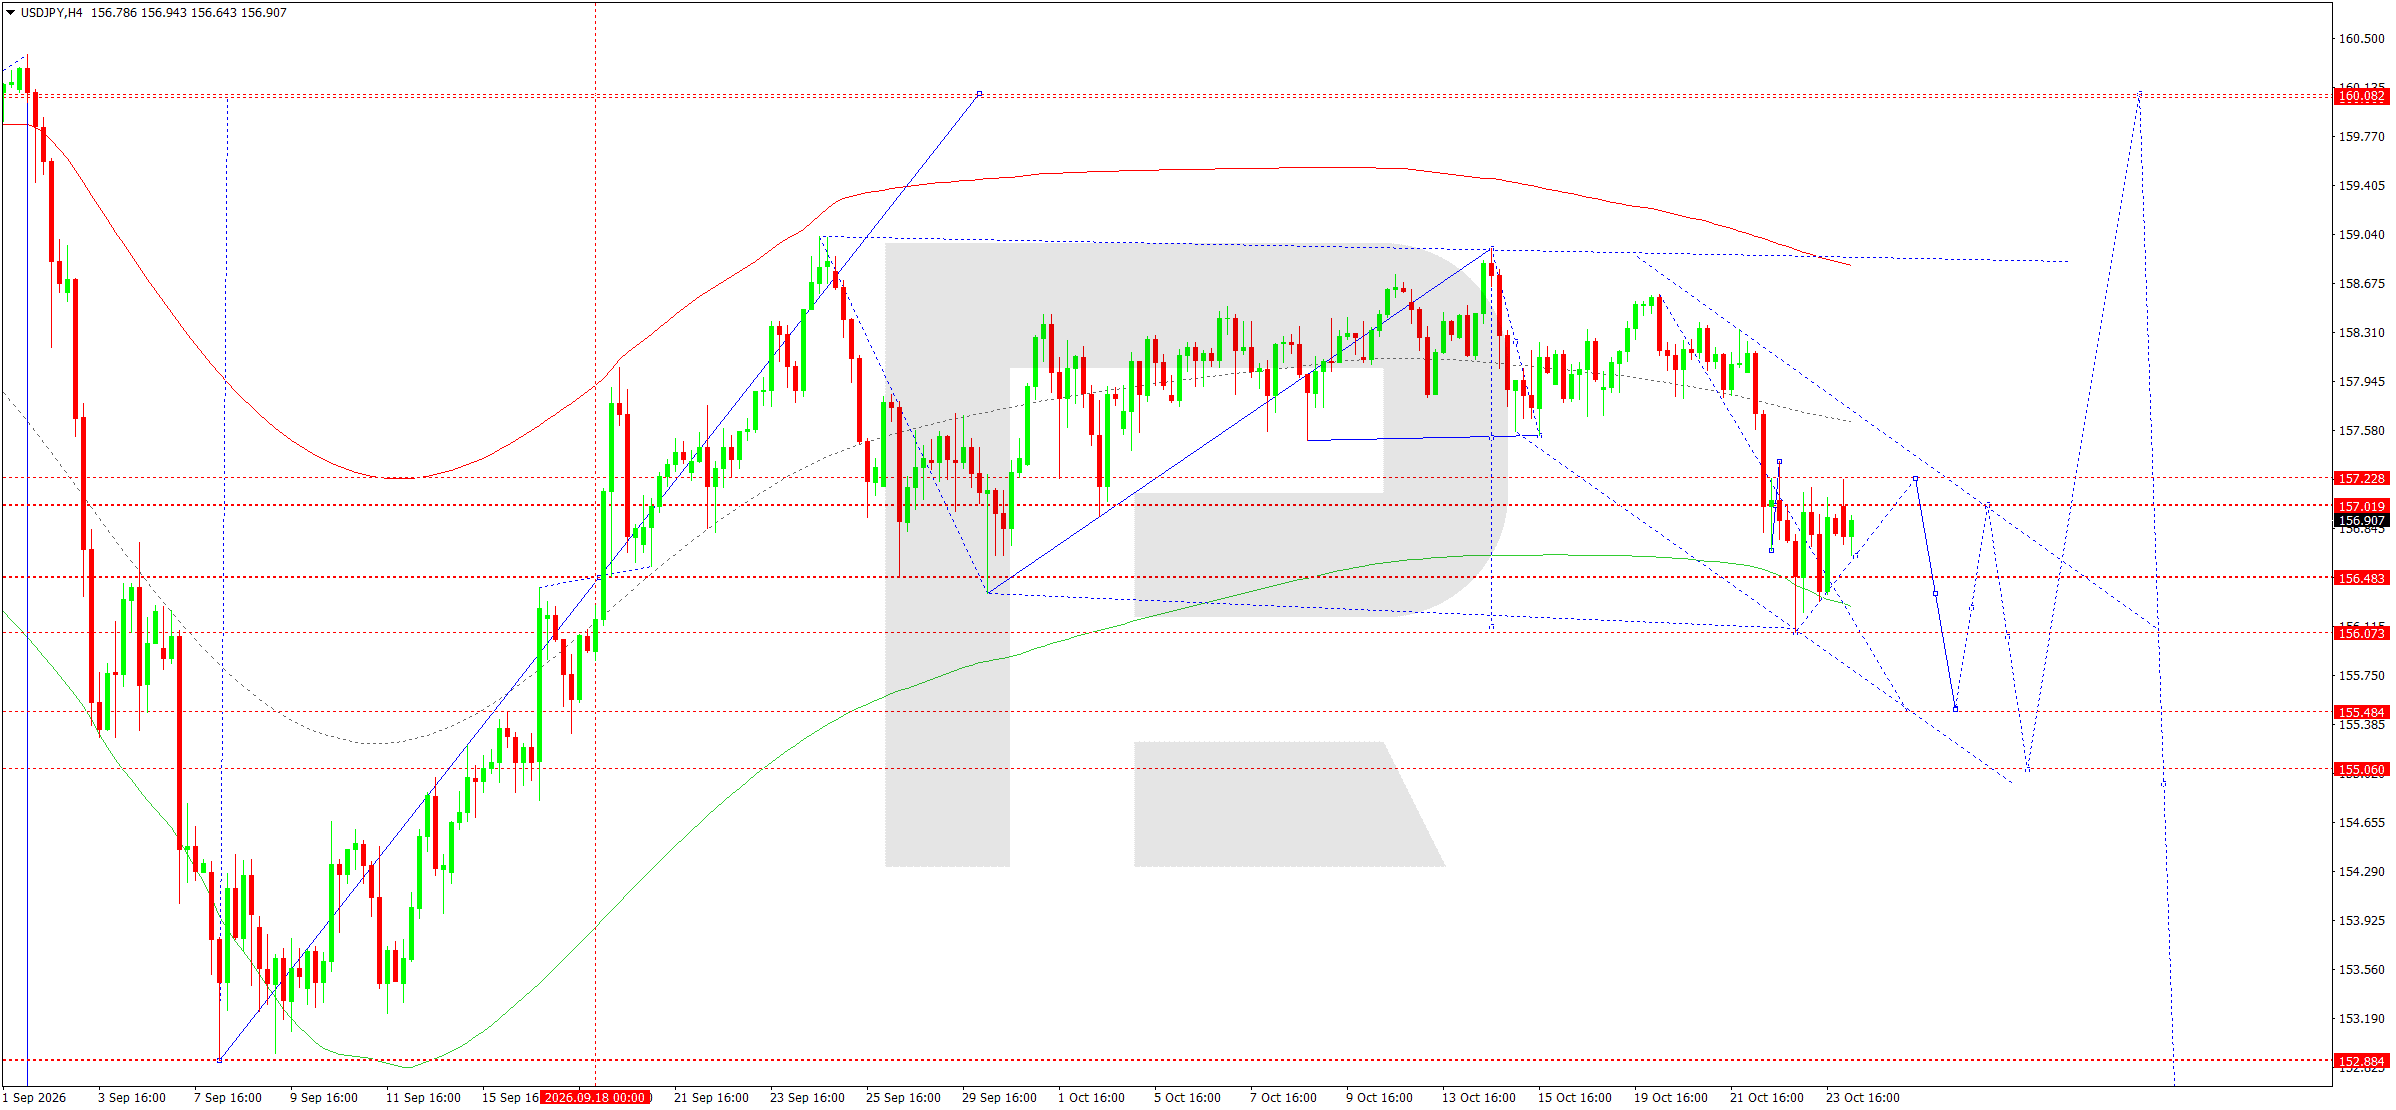
On the H4 chart, USDJPY completed an upward wave towards 157.22 and formed a consolidation range immediately below that resistance. A downward breakout and corrective decline towards 156.48 and then 155.48 are possible today.
The Elliott wave structure indicates a downward corrective leg within a broader wave pattern. The matrix pivot is near 157.02, defining the key area for trading decisions.
Prices are close to the Price Envelope's central line. Failure to consolidate above 157.22 would confirm persistent selling pressure. A breakout below 156.48 would open the way towards 156.07 and then 155.48.
Once the correction ends, a recovery towards 157.66 is envisaged. A breakout above that resistance would create conditions for further growth towards the Envelope's upper boundary at 160.06.
The main short-term scenario envisages a decline before growth potentially resumes. Invalidating the corrective scenario would require a convincing breakout above 157.22 and a new upward impulse.
USDJPY forecast scenario
GBPUSD forecast
Sterling begins the trading week with increased attention on the monetary policy outlook in the UK and US. The Bank of England continues to assess persistent inflationary pressure, domestic demand, and wage trends. These indicators determine the scope for future interest rate changes.
Forthcoming government budget decisions are also significant for sterling. Market participants are assessing prospects for public spending, taxation, and debt sustainability, as budget changes could affect UK bond yields.
The US dollar is facing moderate pressure from falling US government bond yields. However, expectations surrounding the Fed decision and forthcoming inflation releases are limiting activity in dollar currency pairs.
Geopolitical developments and elevated energy costs remain additional sources of uncertainty for the UK economy. In the short term, fundamentals allow sterling to stabilise, but the absence of a sustained improvement in macroeconomic expectations limits its upside potential. Changes in interest rate expectations remain the priority.
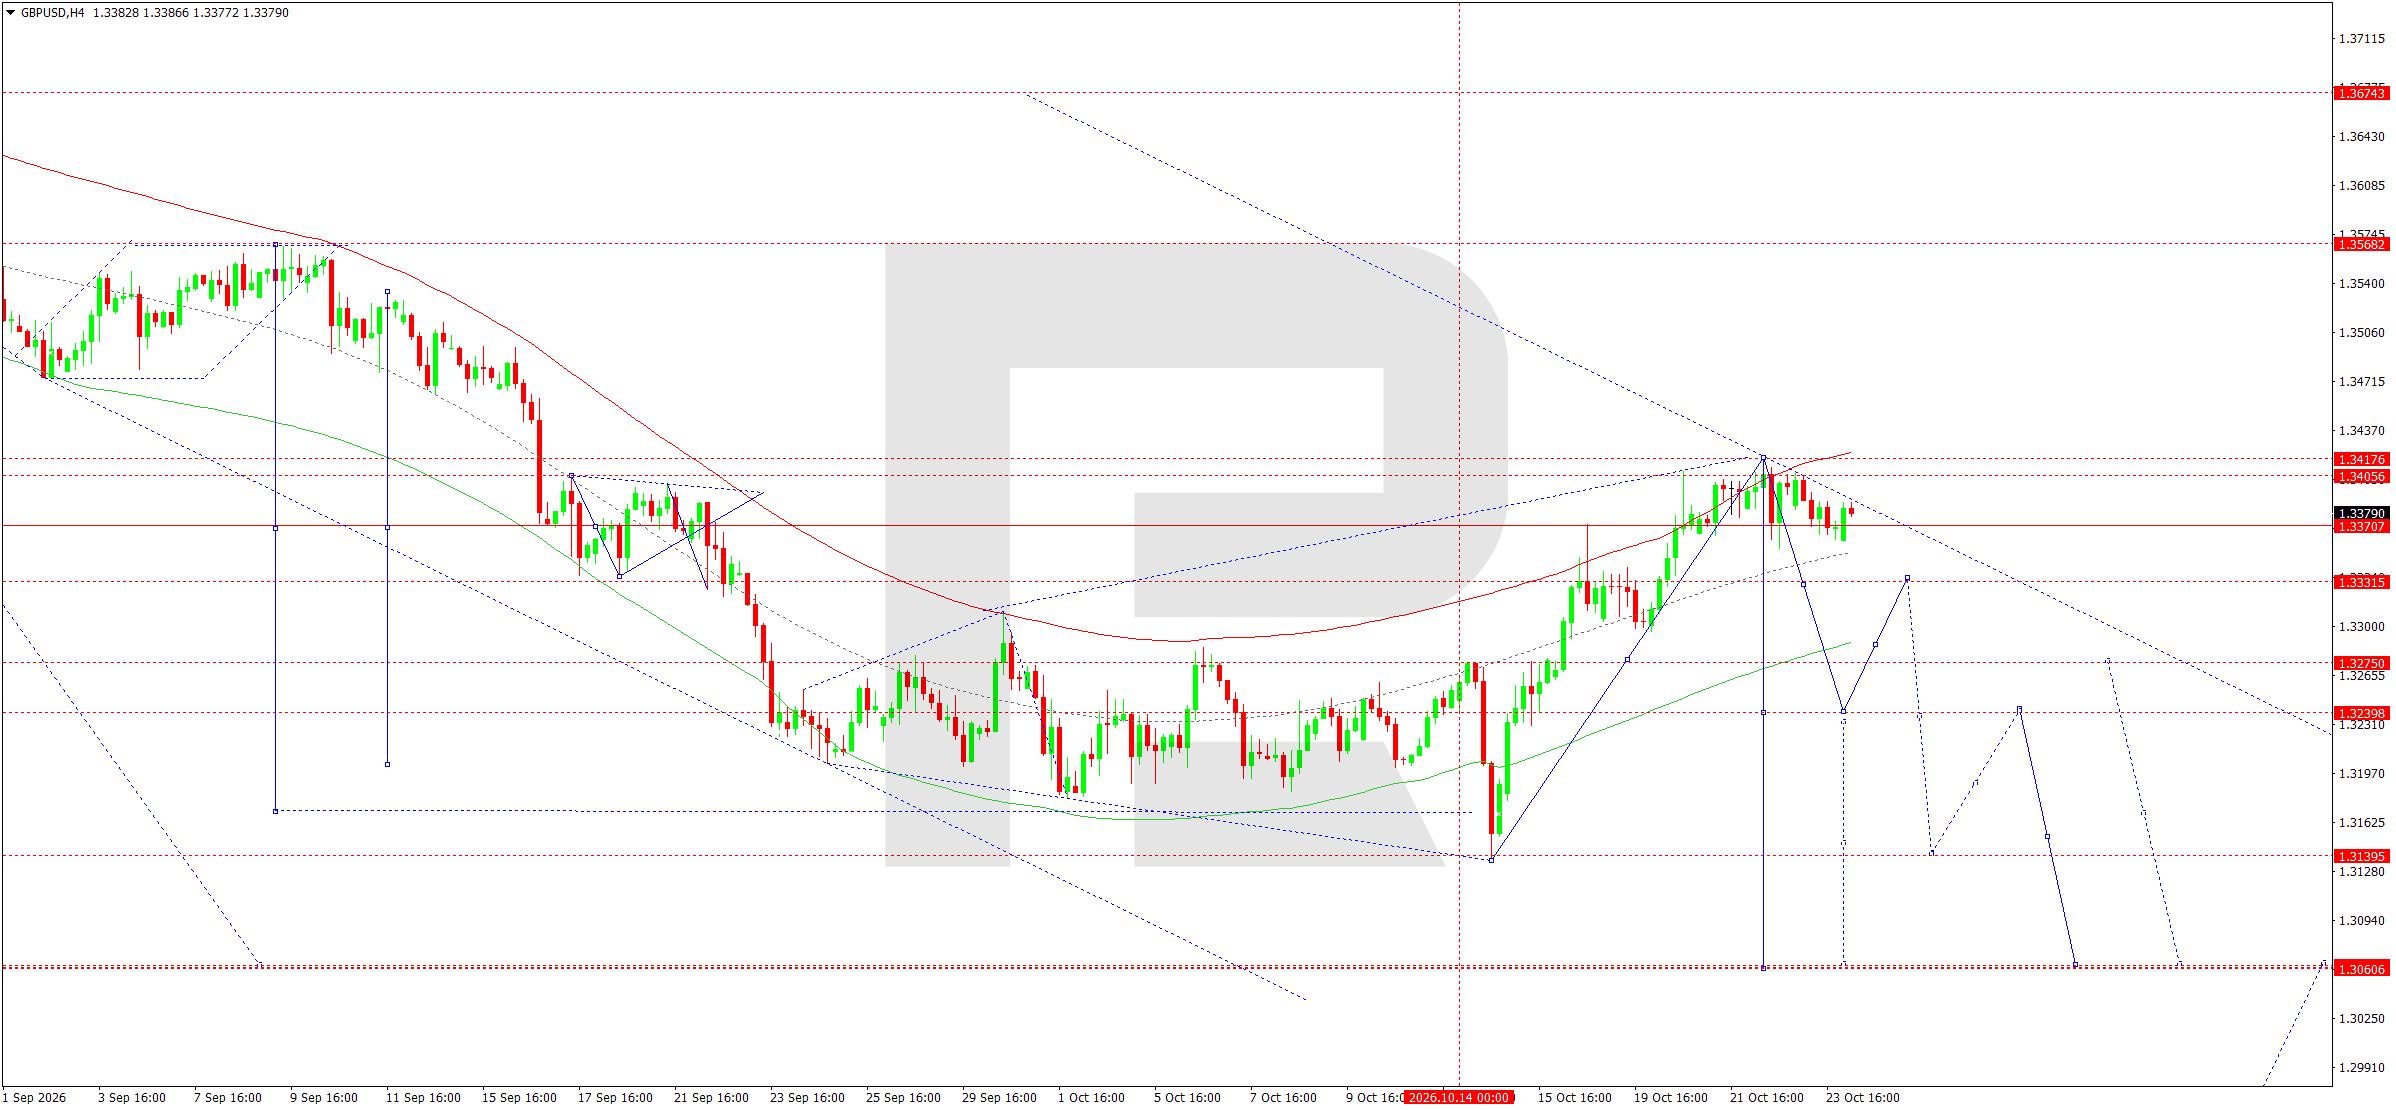
On the H4 chart, GBPUSD completed a decline to 1.3354 before correcting upwards towards resistance at 1.3405. Today, 26 October, a local consolidation range is expected below this level.
The main wave structure remains bearish. The matrix pivot at 1.3370 defines the balance within the current price range.
Prices previously tested the Price Envelope's upper boundary around 1.3407 but failed to consolidate above resistance. This structure allows for the corrective wave to end and the decline to resume.
The initial downside target is 1.3331. A breakout below it would create conditions for a move towards 1.3275 and 1.3238, with further targets at 1.3131 and 1.3060.
The Elliott wave model confirms the possibility of another downward impulse. Sellers retain the advantage while prices remain below 1.3405.
An alternative scenario suggests consolidation above 1.3418 followed by an extension of the correction. Until resistance is convincingly broken, the primary scenario remains a downward wave towards the specified targets.
GBPUSD forecast scenario
AUDUSD forecast
The Australian dollar begins the trading week under the influence of expectations of new inflation data and upcoming decisions by leading central banks. The Reserve Bank of Australia continues to assess persistent price pressures, domestic demand, and economic growth prospects.
The upcoming Australian inflation release could significantly change expectations for future interest rate policy.
China's economic conditions are another factor, as China is Australia's largest trading partner. Changes in demand for iron ore, coal, and other commodities directly affect Australian export prospects and the national currency.
International markets remain uncertain amid geopolitical tensions and oil price fluctuations. Falling US bond yields are somewhat limiting dollar strength, although investor caution is preventing a strong recovery in higher-yielding currencies.
This week's Fed decision will have an additional influence. If the US central bank maintains restrictive signals, pressure on AUDUSD may return. The fundamental backdrop therefore remains mixed, allowing for a short-term recovery in the Australian currency before the downward correction potentially continues.
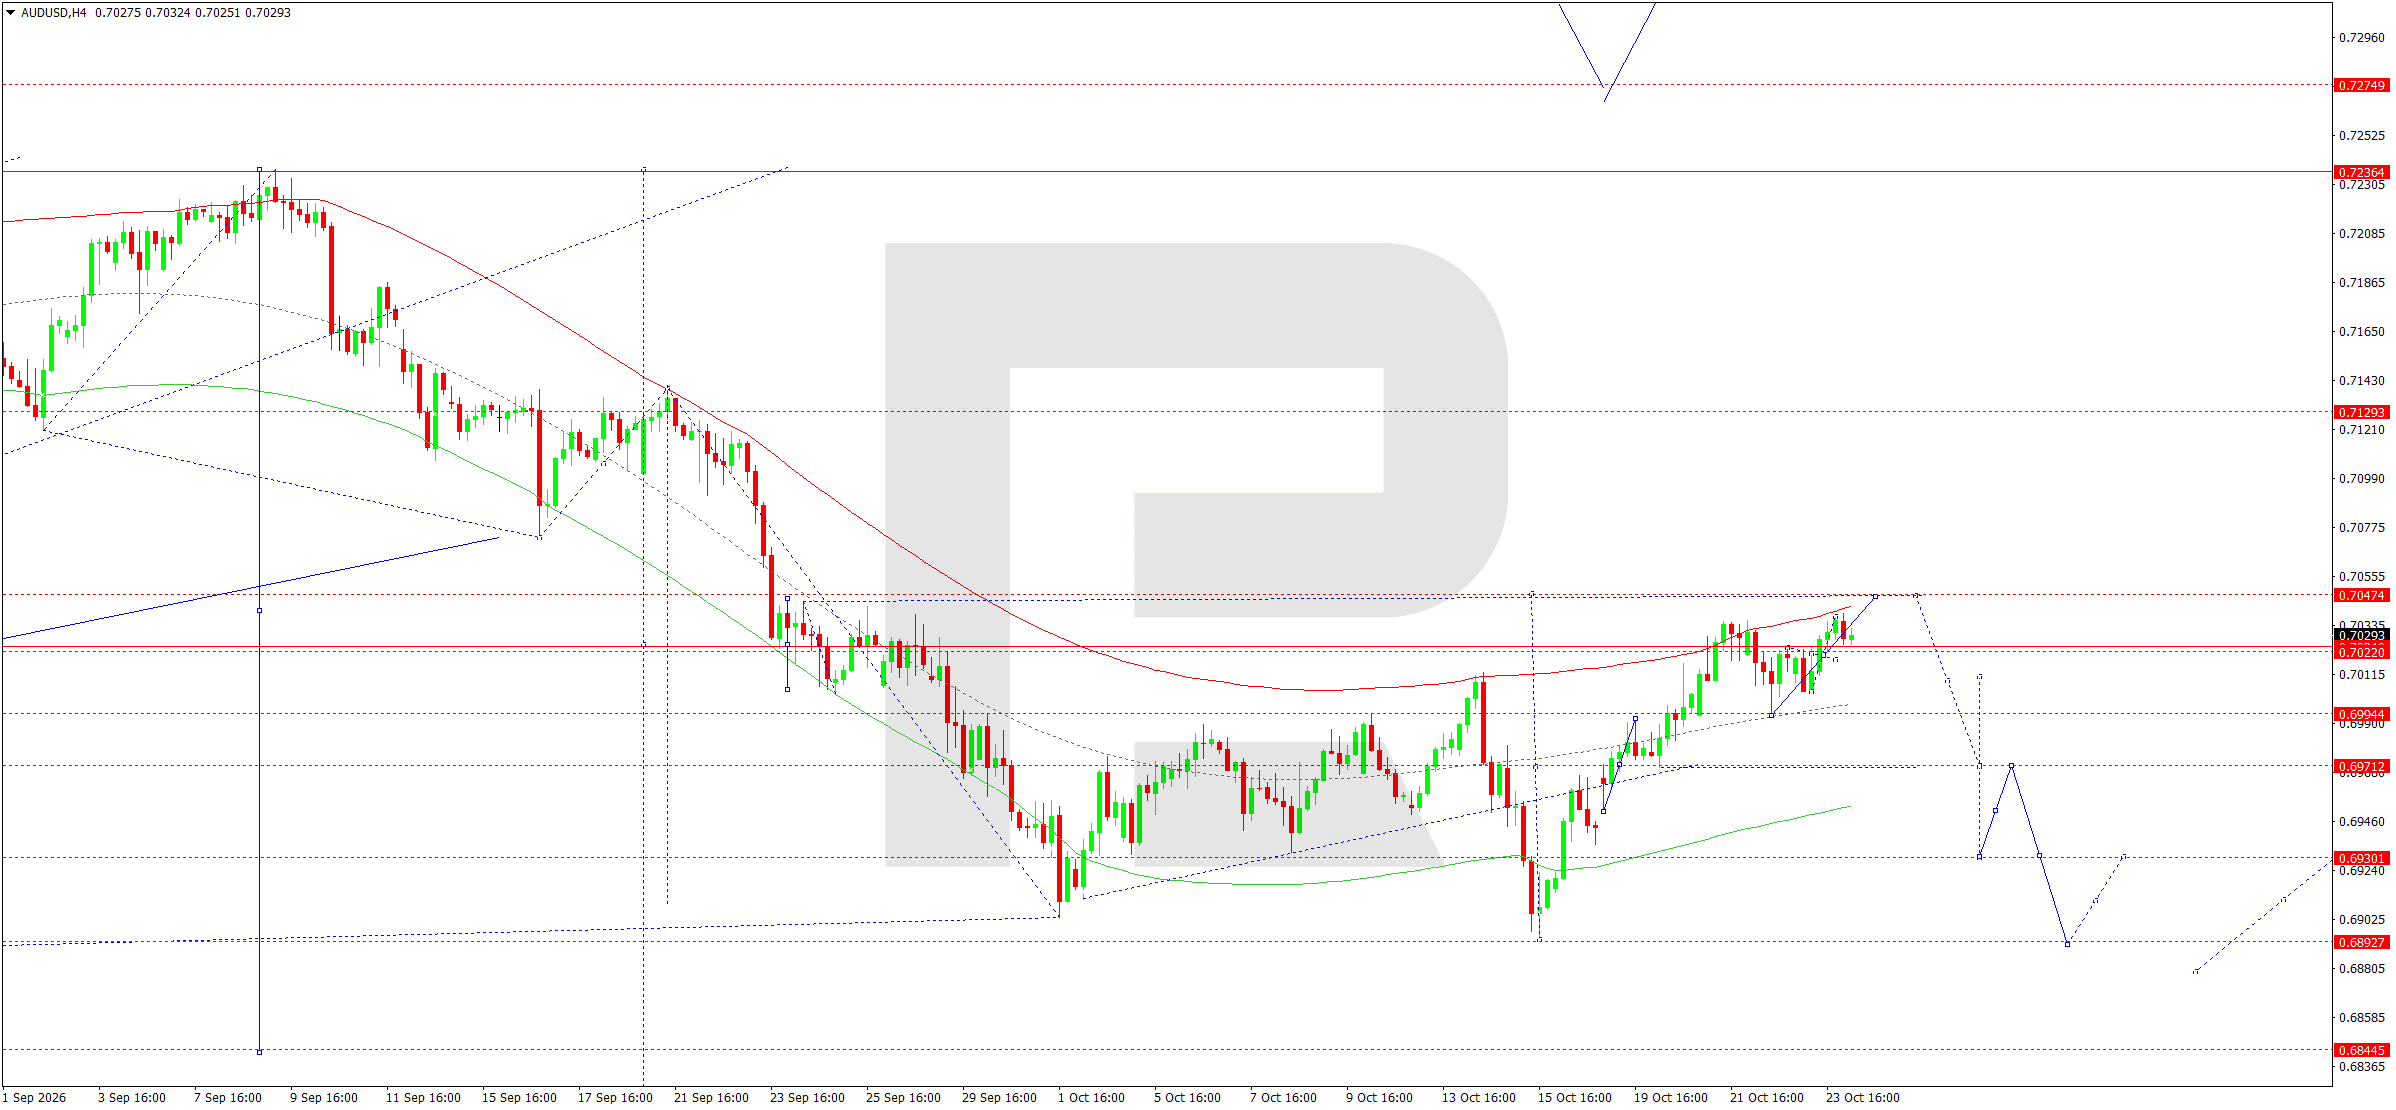
On the H4 chart, AUDUSD completed an upward move towards 0.7038 and formed a local consolidation range around 0.7022. Today, 26 October, the range could extend towards resistance at 0.7047 before a downward wave develops.
The Elliott wave structure indicates a corrective rise within a broader bearish pattern. The matrix pivot around 0.7024 is a key reference point for current movements.
Prices have approached the Price Envelope's upper boundary around 0.7035. Failure to consolidate above 0.7047 would indicate limited recovery potential.
The main scenario envisages a decline towards 0.6994 after the local rise ends. A breakout below this support would create conditions for a move towards 0.6971 and then 0.6940, the Envelope's lower boundary.
If selling pressure intensifies, the next targets could be 0.6930 and 0.6893.
An alternative scenario suggests consolidation above 0.7047 followed by a correction towards 0.7129. Until a confirmed breakout above resistance occurs, the bearish scenario remains preferable.
A return below the matrix's central level is the main condition for this scenario.
AUDUSD forecast scenario
USDCAD forecast
The Canadian dollar begins the week highly sensitive to oil prices and expectations surrounding the national central bank's decision. The Bank of Canada meets on 28 October. Market participants see the possibility of an interest rate increase, so the decision and accompanying comments could determine USDCAD's short-term movements.
The energy market has a significant influence. After oil prices rose last week, signs of a correction emerged amid diplomatic efforts to reduce tensions in the Middle East. Lower oil prices could constrain the Canadian dollar, given the importance of energy exports to the country's economy.
Meanwhile, the US dollar faces pressure from falling US Treasury yields. Expectations surrounding the Fed decision are limiting directional moves in dollar currency pairs.
Important events this week include US economic growth and inflation releases, as well as Canadian GDP data. The fundamental picture is mixed: expectations of a more restrictive BoC policy support the Canadian dollar, while an oil price correction could limit further appreciation.
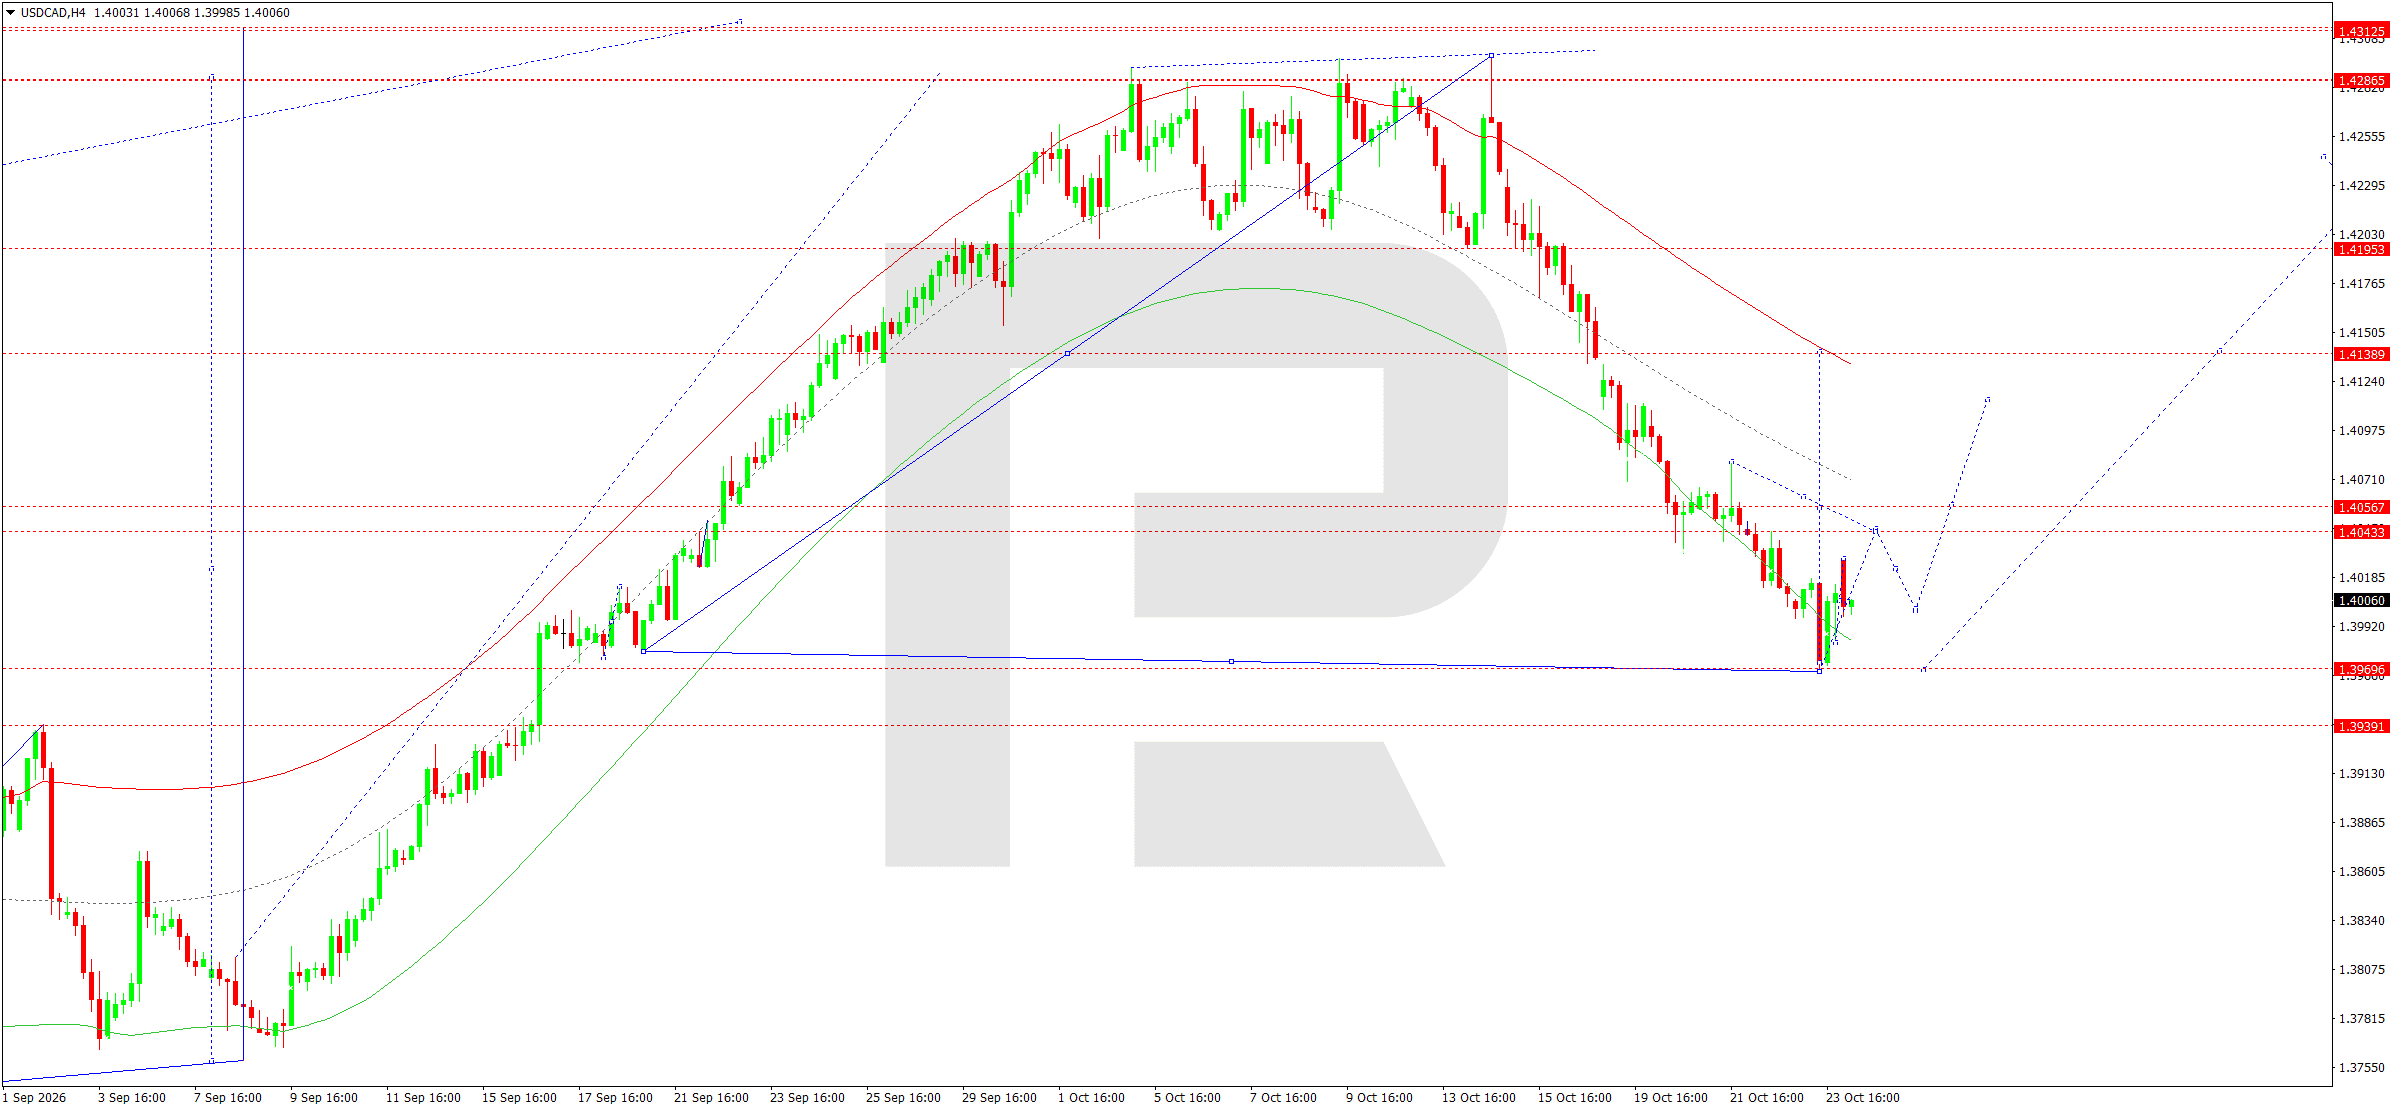
On the H4 chart, USDCAD completed a downward wave towards support at 1.3969 before forming a local recovery impulse. Today, 26 October, a narrow consolidation range could develop near the low reached.
The Elliott wave structure suggests that another downward leg has ended and a corrective phase may begin. The pivot of the current matrix lies around 1.4139 and is an important recovery reference point.
Prices have reached the Price Envelope's lower boundary around 1.3969. Nevertheless, an additional decline towards 1.3939 and 1.3900 remains possible before a sustained reversal forms.
The main scenario envisages a recovery wave once support is confirmed. The initial upside targets are 1.4043 and 1.4057. Consolidation above them would open the way towards 1.4139.
The next reference point is resistance at 1.4195. A breakout above it would allow a recovery towards 1.4286.
An alternative scenario suggests a breakout below support at 1.3969 and a continued decline. However, the local reversal structure suggests that buyers could gain the advantage during the correction.
A sequence of higher lows and consolidation above the nearest resistance would confirm the recovery.
USDCAD forecast scenario
XAUUSD forecast
The gold market begins the trading week amid conflicting monetary policy expectations and geopolitical risks. Investors are focused primarily on the forthcoming Fed meeting, as the future path of US interest rates determines gold's appeal relative to income-generating financial instruments.
Falling US government bond yields could support gold by reducing the opportunity cost of holding it. However, inflation risks associated with high energy costs continue to limit expectations of an imminent easing of monetary conditions.
Geopolitical tensions in the Middle East continue to generate safe-haven demand. At the same time, reports of diplomatic efforts to ease tensions are encouraging a partial reduction in defensive positions.
US dollar movements are another factor. Dollar weakness usually supports gold prices, but heightened stock market volatility can prompt sales of the precious metal to raise liquidity.
This week's key reference points will include US PCE inflation, economic growth data, and Fed comments. Until fresh signals emerge, the fundamental backdrop allows for a corrective gold recovery but does not guarantee the end of the downtrend.
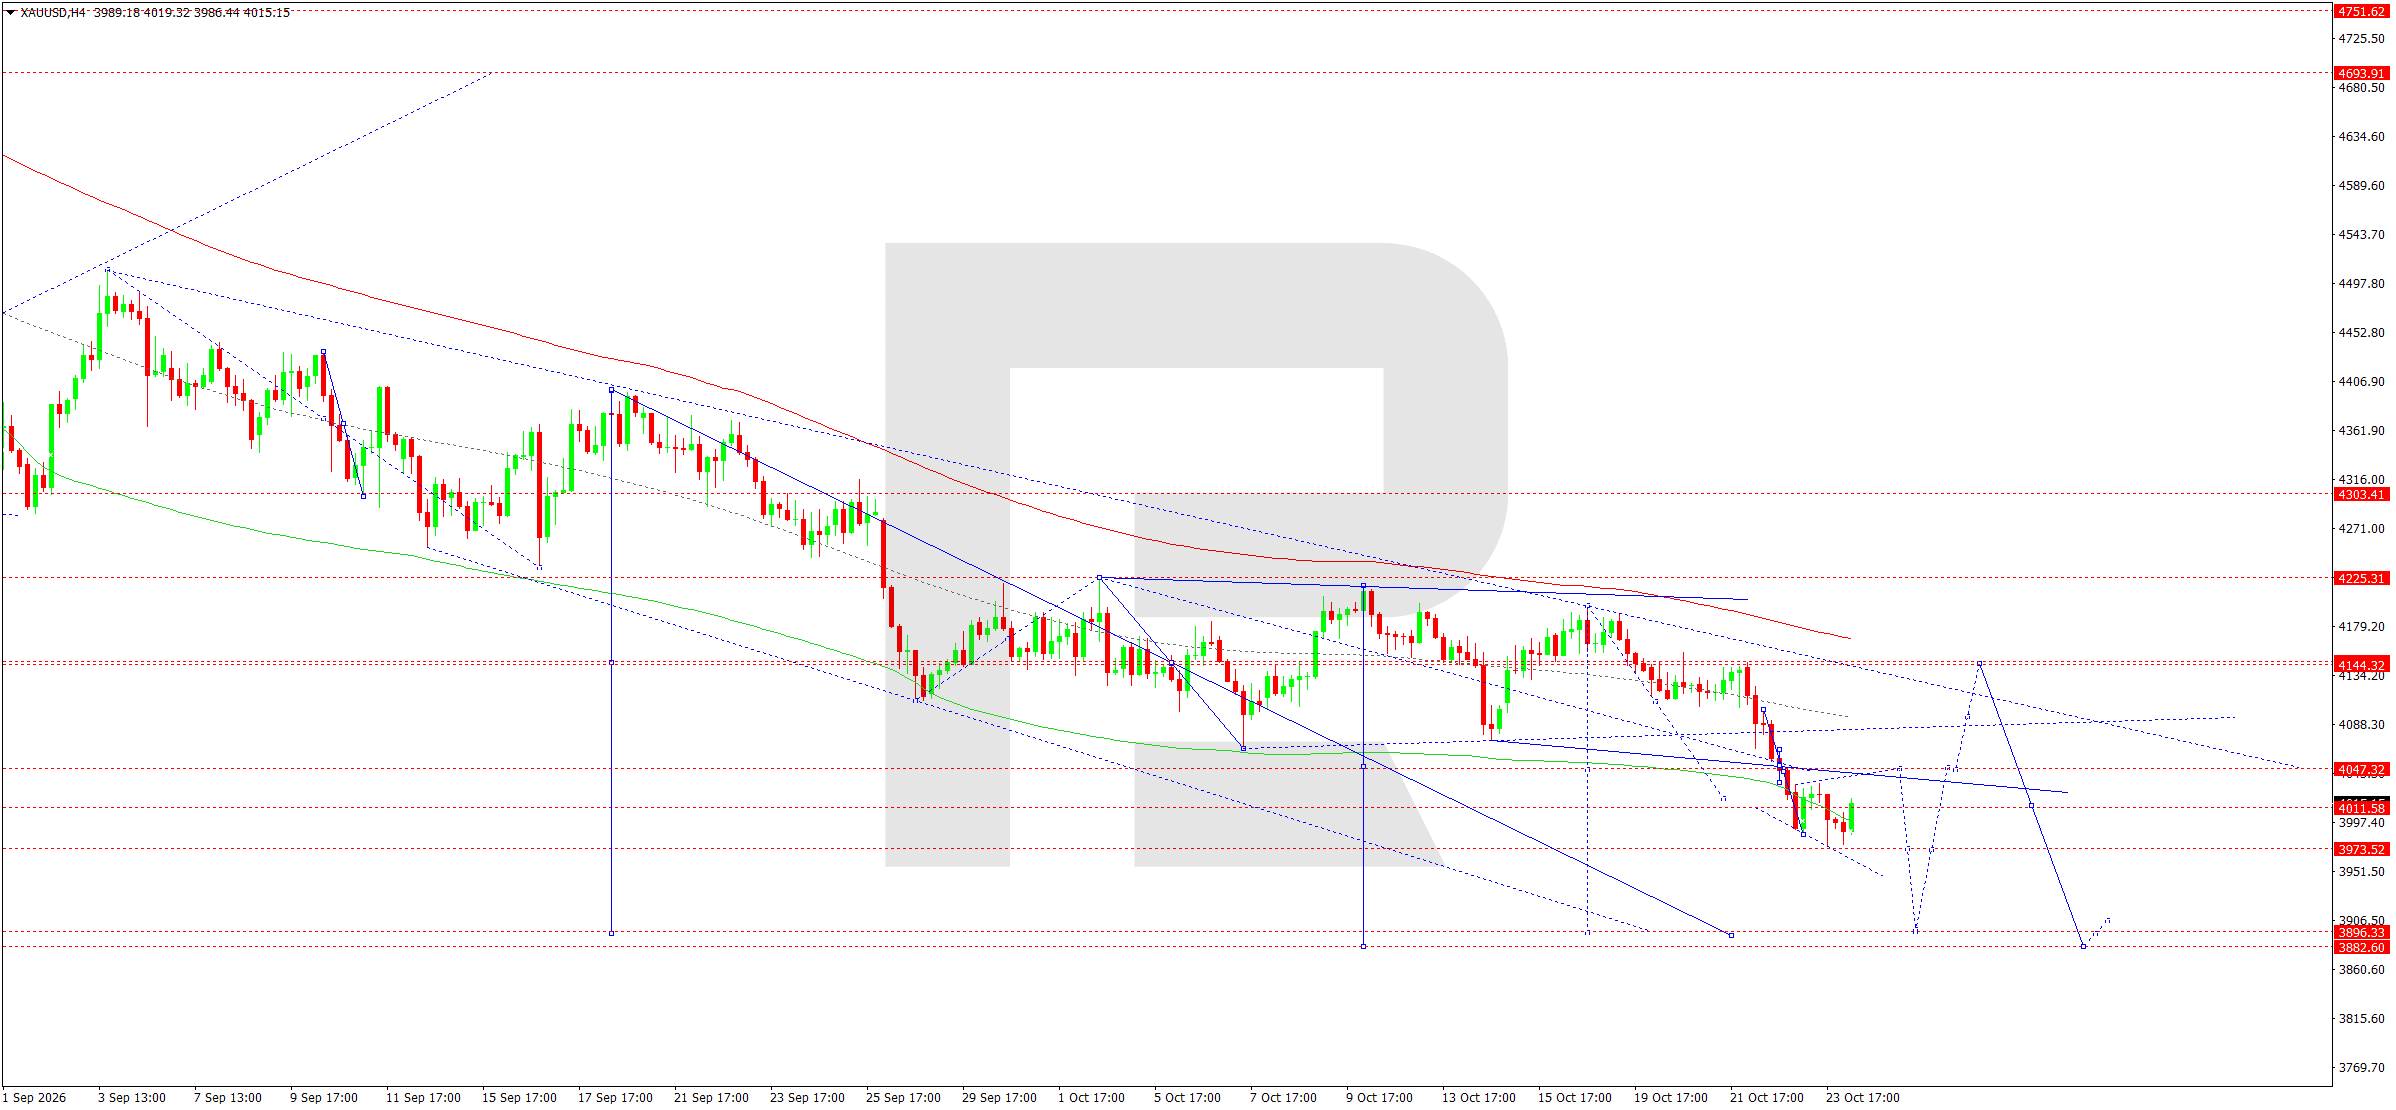
On the H4 chart, XAUUSD completed another downward wave towards 3,975 and began forming a local consolidation range. Today, 26 October, a short-term recovery is possible before the main decline continues.
The Elliott wave structure confirms sellers' predominance. The matrix pivot stands at 4,225 and remains a key reference point for the medium-term bearish pattern.
Prices are close to the Price Envelope's lower boundary. The nearest resistance is 4,011. A breakout above it would create conditions for a corrective rise towards 4,047.
However, failure to consolidate above 4,047 would indicate that downside potential remains intact.
Once the recovery leg ends, a decline towards 3,973 and then 3,948 is expected.
A breakout below these support levels would open the way towards 3,896 and 3,883, the extended target of the downward wave.
An alternative scenario suggests consolidation above 4,047 followed by a recovery towards 4,144. While prices remain below key resistance levels, the main trend stays bearish and local gains are primarily viewed as corrective.
XAUUSD forecast scenario
US 500 forecast
The US stock market begins the trading week amid heightened uncertainty about future monetary policy and corporate earnings prospects. The main event will be the Fed meeting, at which investors expect interest rates to remain unchanged. Subsequent comments from policymakers could significantly influence equity valuations and growth expectations.
Attention is also focused on quarterly earnings from leading technology companies, including Microsoft, Alphabet, and Amazon. Their results will be important indicators of the sustainability of corporate spending on artificial intelligence and prospects for the technology sector.
Falling US government bond yields create conditions for a recovery in demand for equities. However, inflation risks and high energy costs are limiting investor optimism.
Geopolitical tensions in the Middle East continue to affect global risk appetite. Diplomatic initiatives aimed at easing tensions could also help stabilise stock indices.
US GDP and PCE inflation figures will be further reference points this week. Fundamentals allow for a technical market recovery, but its sustainability will depend on corporate results and Fed comments.
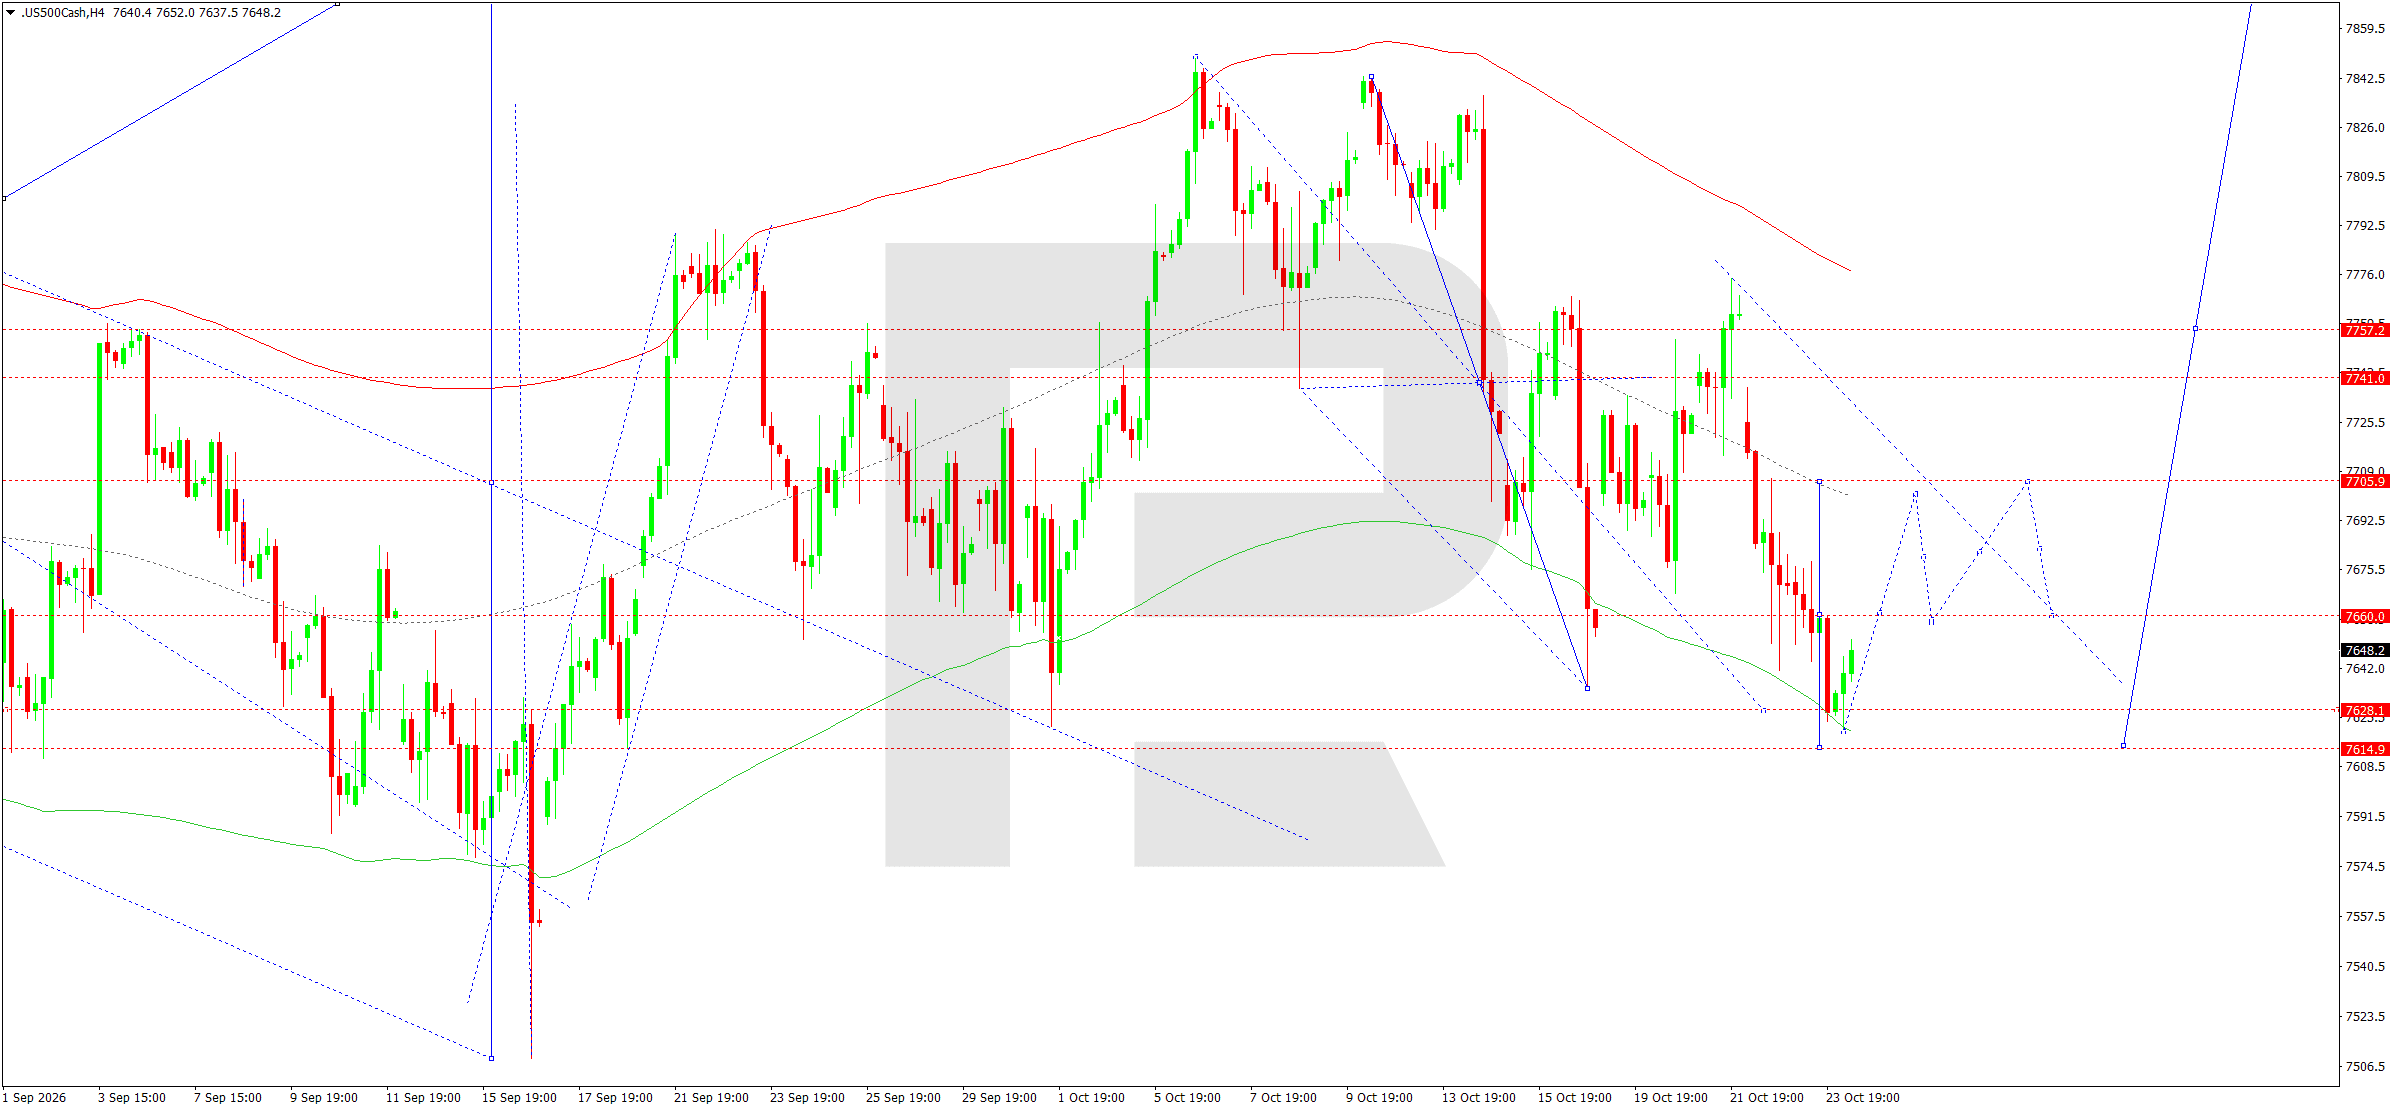
On the H4 chart, US 500 completed a downward wave towards support at 7,615 before forming a local consolidation range. Today, 26 October, a recovery could develop after the low is tested.
The Elliott wave structure points to a corrective leg after the downward impulse ends.
The matrix pivot at 7,739 is a key reference point for the current pattern.
Prices have approached the Price Envelope's lower boundary around 7,626. If support holds, an upward correction could form.
The initial target for buyers is resistance at 7,660. Consolidation above it would create conditions for further growth towards 7,706.
The next recovery targets are 7,715 and 7,741, near the Envelope's central line. Breaking above these resistance levels would open the way for a broader correction towards 7,757.
An alternative scenario suggests a breakout below support at 7,615 and a continued decline. However, if the current reversal structure holds, a short-term recovery is preferred.
The main medium-term trend remains bearish, so the expected rise is viewed as a correction within a broader wave structure.
US 500 forecast scenario
BTCUSD forecast
The cryptocurrency market begins the trading week highly sensitive to global risk appetite and US monetary policy expectations. The upcoming Fed decision is the main factor, as it could change expectations regarding the cost of dollar liquidity and the appeal of alternative financial assets.
Falling US government bond yields could support investor interest in riskier instruments. However, persistent inflation risks limit expectations of further easing in financial conditions.
US stock market movements are another factor. Heightened volatility in technology shares and concerns about valuations of companies associated with artificial intelligence could increase caution among cryptocurrency market participants.
Geopolitical tensions and high energy costs remain sources of uncertainty. If global sentiment deteriorates, investors may reduce positions in highly volatile assets, including Bitcoin.
This week, particular attention will be paid to US inflation data, economic growth indicators, and Fed statements. Fundamentals allow for a local BTCUSD recovery after the decline, but a sustained return of buyers will require better market sentiment and more stable dollar liquidity.
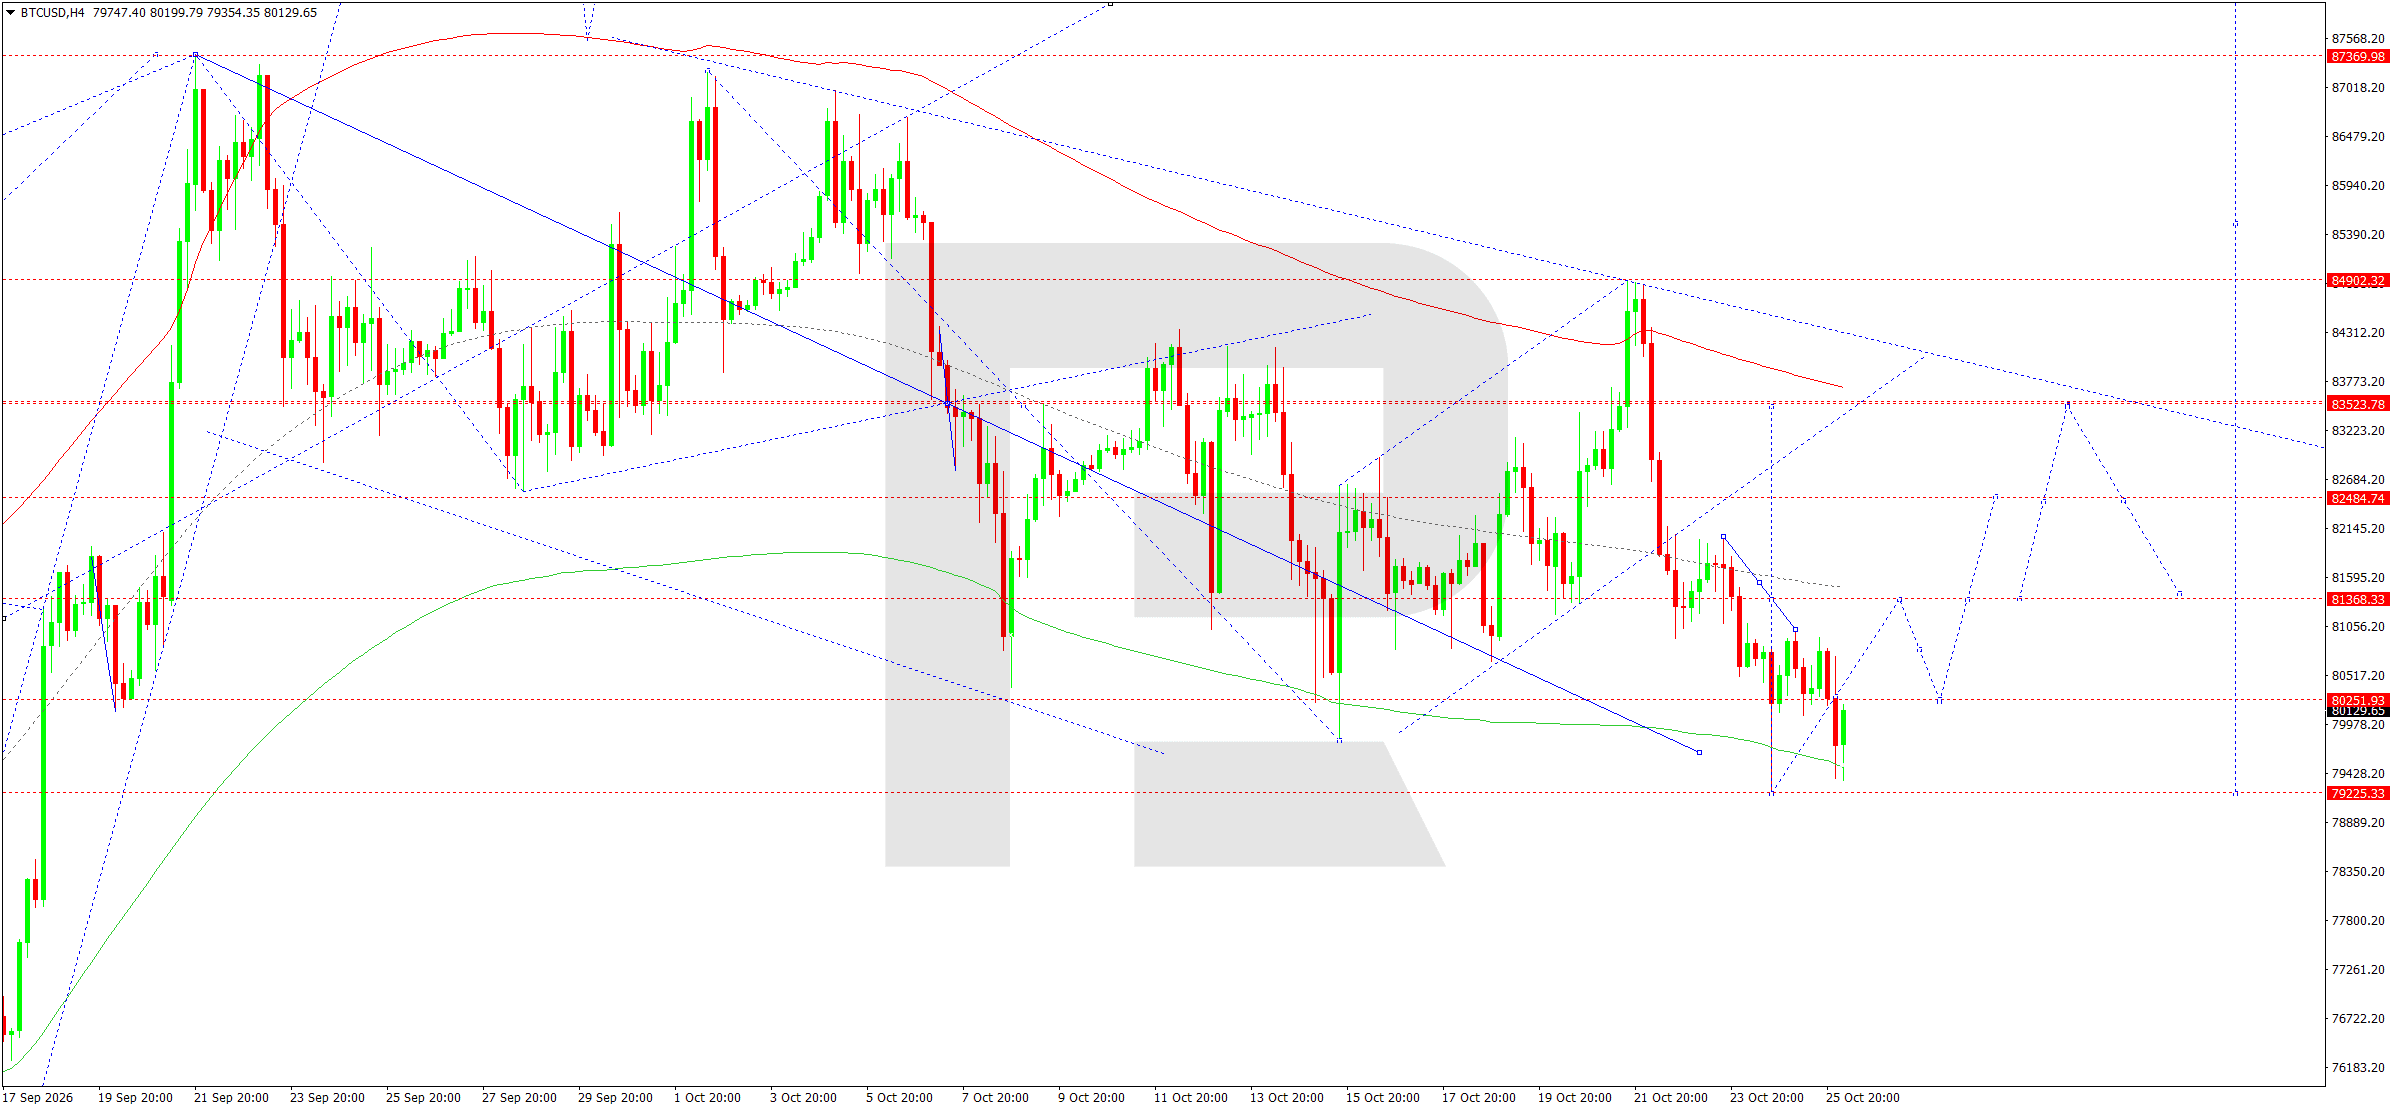
On the H4 chart, BTCUSD completed a downward corrective wave towards support at 79,225. Today, 26 October, a local recovery could form after a test of the Price Envelope's lower boundary.
The Elliott wave structure suggests that another downward leg may have ended. The matrix pivot is around 83,460 and remains a key reference point for the broader wave pattern.
Prices are near important support at 79,225. Holding this level would create conditions for an upward correction.
The initial target for buyers is resistance at 80,252. Consolidation above it would allow a further recovery towards 81,368.
The next target is the 82,485 area. If buying activity strengthens further, prices could reach 83,524, corresponding to the upper part of the current corrective range.
An alternative scenario suggests a breakout below support at 79,225, followed by further declines and new local lows.
The main medium-term trend remains bearish. The anticipated rise is therefore regarded as a corrective recovery, which would be confirmed by consolidation above the nearest resistance levels.
BTCUSD forecast scenario
Editors’ picks


EURUSD forecast 2026–2027: technical analysis, price levels & predictions
The EURUSD outlook for 2026 and 2027: key levels on the daily chart, three trading scenarios and the policy gap between the Fed and the ECB that drives the pair.

Gold (XAUUSD) forecast 2026: technical analysis, price levels & predictions
Where gold could trade in 2026: key levels, three trading scenarios with entry triggers and the forecasts from J.P. Morgan, Deutsche Bank and Goldman Sachs.
Forecasts presented in this section only reflect the author’s private opinion and should not be considered as guidance for trading. RoboForex bears no responsibility for trading results based on trading recommendations described in these analytical reviews.