Weekly technical analysis and forecast (8–12 June 2026)
In this weekly technical analysis, we review key chart patterns and levels for EUSUSD, USDJPY, GBPUSD, AUDUSD, USDCAD, gold (XAUUSD), and Brent oil to forecast developments for the upcoming week (8–12 June 2026)
Major technical levels to watch this week
- EURUSD: Support: 1.1525, 1.1428. Resistance: 1.1670, 1.1796
- USDJPY: Support: 158.60, 156.46. Resistance: 160.70, 161.17
- GBPUSD: Support: 1.3321, 1.3290. Resistance: 1.3533, 1.3600
- AUDUSD: Support: 0.7070, 0.6911. Resistance: 0.7160, 0.7198
- USDCAD: Support: 1.3744, 1.3701. Resistance: 1.3965, 1.4007
- Gold: Support: 4,215, 3,920. Resistance: 4,889, 5,413
- Brent: Support: 95.16, 89.60. Resistance: 100.72, 106.42
EURUSD forecast
The EURUSD pair ends the week near the 1.1600–1.1670 zone, where the market continues to assess monetary policy prospects on both sides of the Atlantic. Expectations of further policy tightening by the European Central Bank remain the main support factor for the euro. The latest eurozone inflation data showed consumer price growth accelerating to 3.2%, well above the regulator’s target. Against this backdrop, market participants have almost fully priced in an ECB rate hike at the next meeting.
In the US, the situation looks more balanced. US Federal Reserve officials continue to maintain a cautious stance, citing persistent inflation risks and no need for urgent changes to interest rates. At the same time, the market will focus on labour market and inflation data, which could significantly affect expectations regarding the Fed’s next steps.
Geopolitical risks in the Middle East and related fluctuations in energy prices remain an additional uncertainty factor. Rising oil prices increase inflationary pressure in Europe and the US, although this factor appears more sensitive for the eurozone.
EURUSD technical analysis
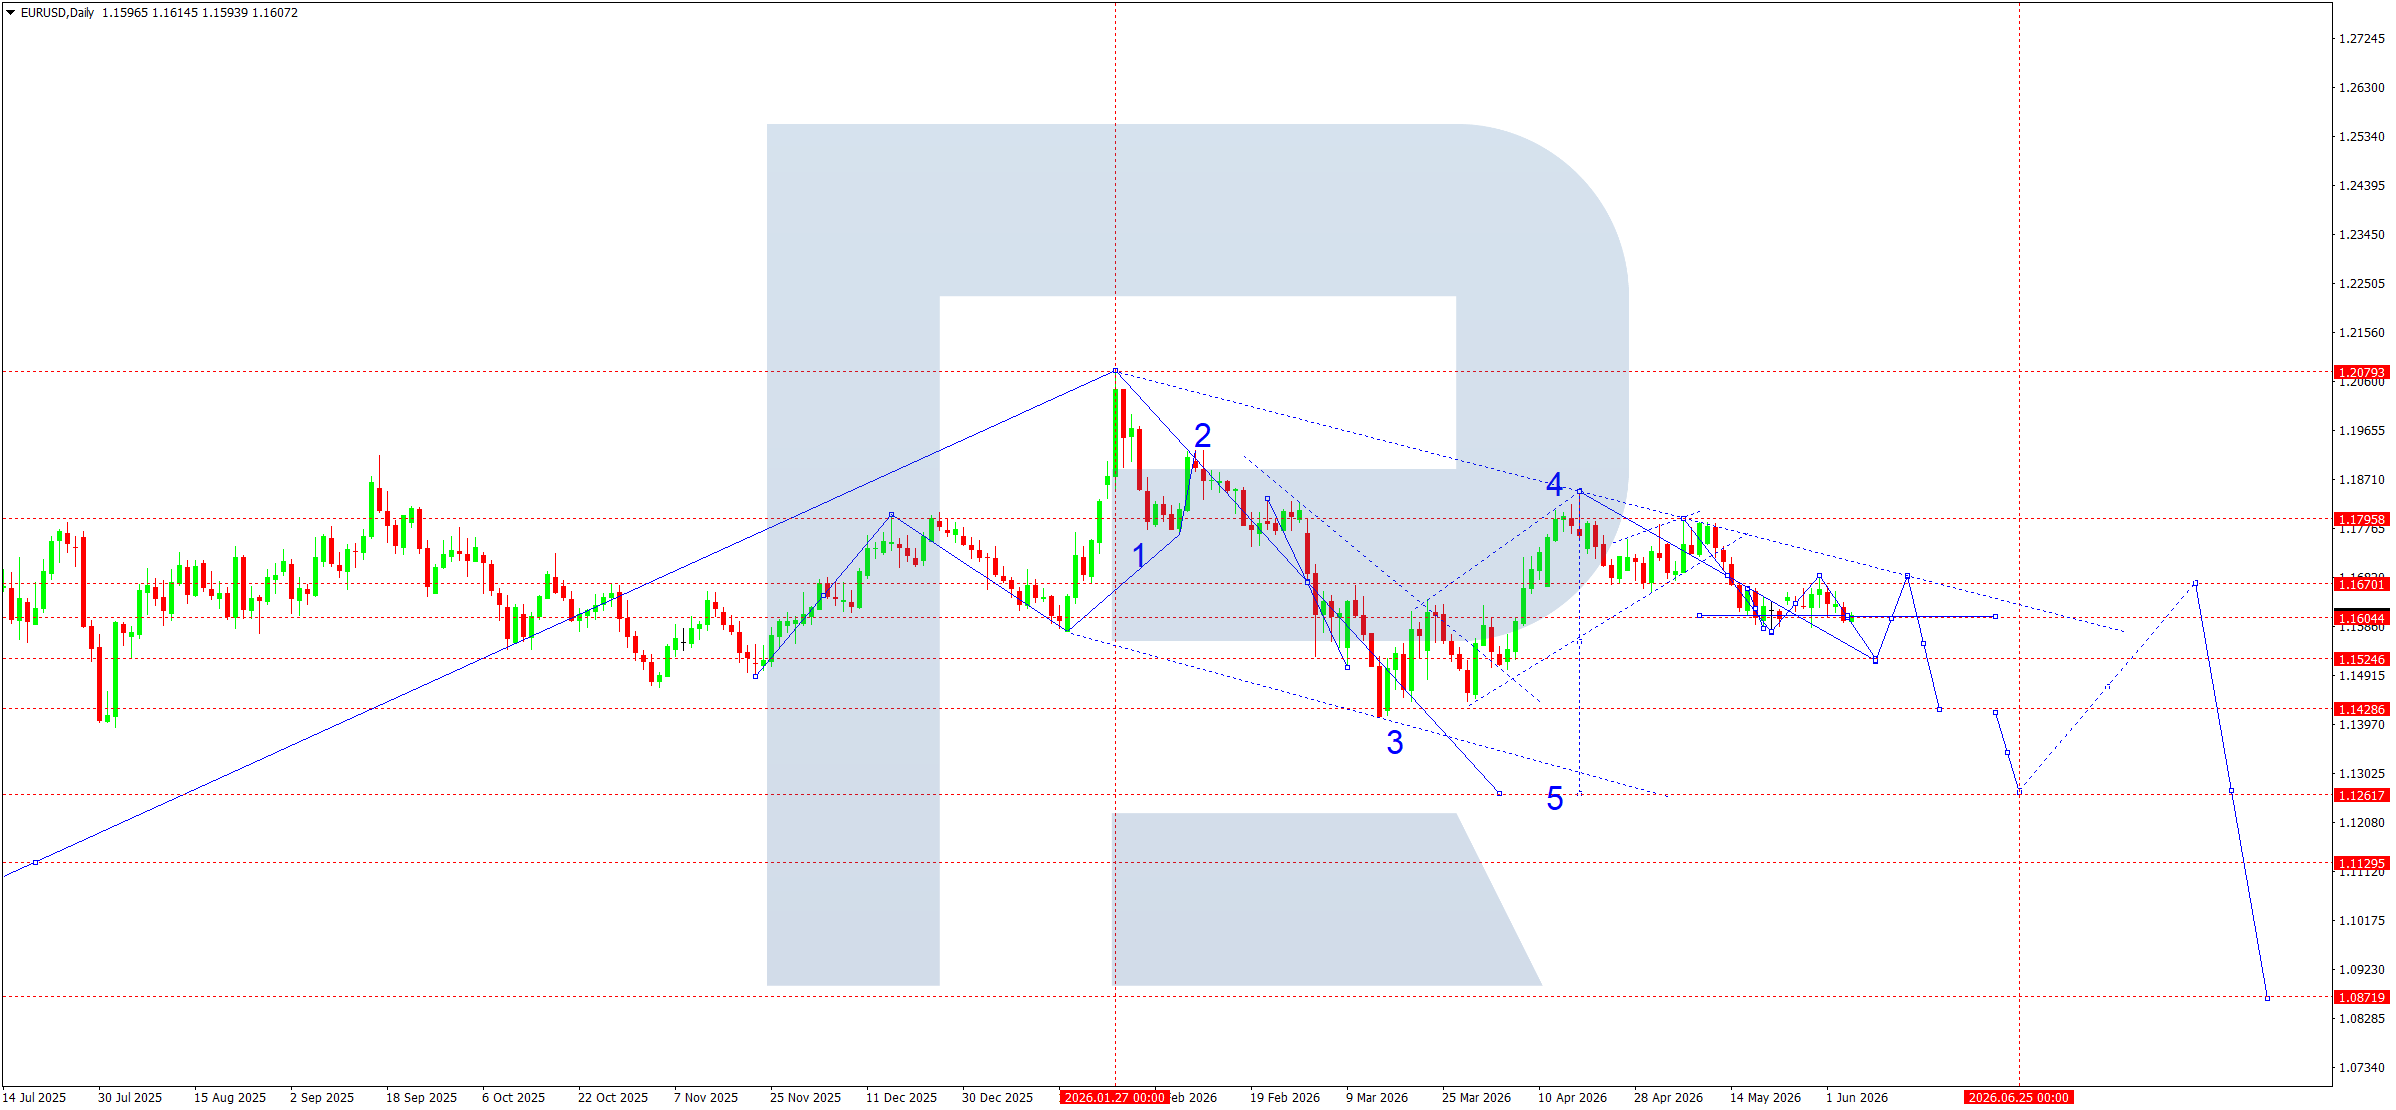
On the daily EURUSD chart, the market continues to form a large downward wave structure after completing the peak near 1.2079. After the first and second waves formed, the market is developing the third downward wave. The low of the third wave was reached near 1.1428, after which a corrective fourth wave began.
At present, the pair is trading in a consolidation range around 1.1604, which acts as the key pivot point of the current structure. The formation of a sideways range indicates position accumulation before the next directional move.
According to the wave structure, the current correction is developing within a descending channel, whose upper boundary runs through the 1.1670–1.1796 area. While the market remains below this zone, the medium-term priority remains with sellers.
A breakout below the 1.1525 support level would confirm the end of the corrective phase and open potential for a renewed decline towards 1.1428. Consolidation below this level would confirm the fifth downward wave, followed by movement towards 1.1262. This level acts as the main estimated target of the entire current wave structure.
At the same time, holding above 1.1525 will allow consolidation to continue within the range and may lead to another test of the 1.1670 resistance level. However, this movement is still viewed exclusively as corrective.
EURUSD forecast scenarios
Bearish scenario (baseline): a decline below 1.1525 will confirm the end of the correction. Movement towards 1.1428 is expected, followed by the fifth downward wave towards 1.1262.
Bullish scenario (alternative): if 1.1670 is broken upwards on rising volumes, the market will be able to continue corrective growth towards the 1.1796 area.
USDJPY forecast
The USDJPY pair ends the week near the psychologically important 160.00 mark. The divergence in monetary policy between the US Federal Reserve and the Bank of Japan remains the main market driver. The US economy continues to demonstrate resilience, supporting high US Treasury yields and maintaining demand for the dollar.
At the same time, market participants are focused on the upcoming BoJ meeting, which will take place in mid-June. Recent statements from representatives of the Japanese regulator point to growing concern over inflationary pressure and weakness in the national currency. The market is actively discussing the probability of another interest rate hike as early as this month. Rising energy prices remain an additional factor, increasing inflationary pressure in Japan and forcing the BoJ to consider further policy normalisation.
At the same time, the pair’s approach to 160.00 again increases the risks of currency interventions by the Japanese authorities. This zone has previously triggered an active response from Japan’s Ministry of Finance.
USDJPY technical analysis
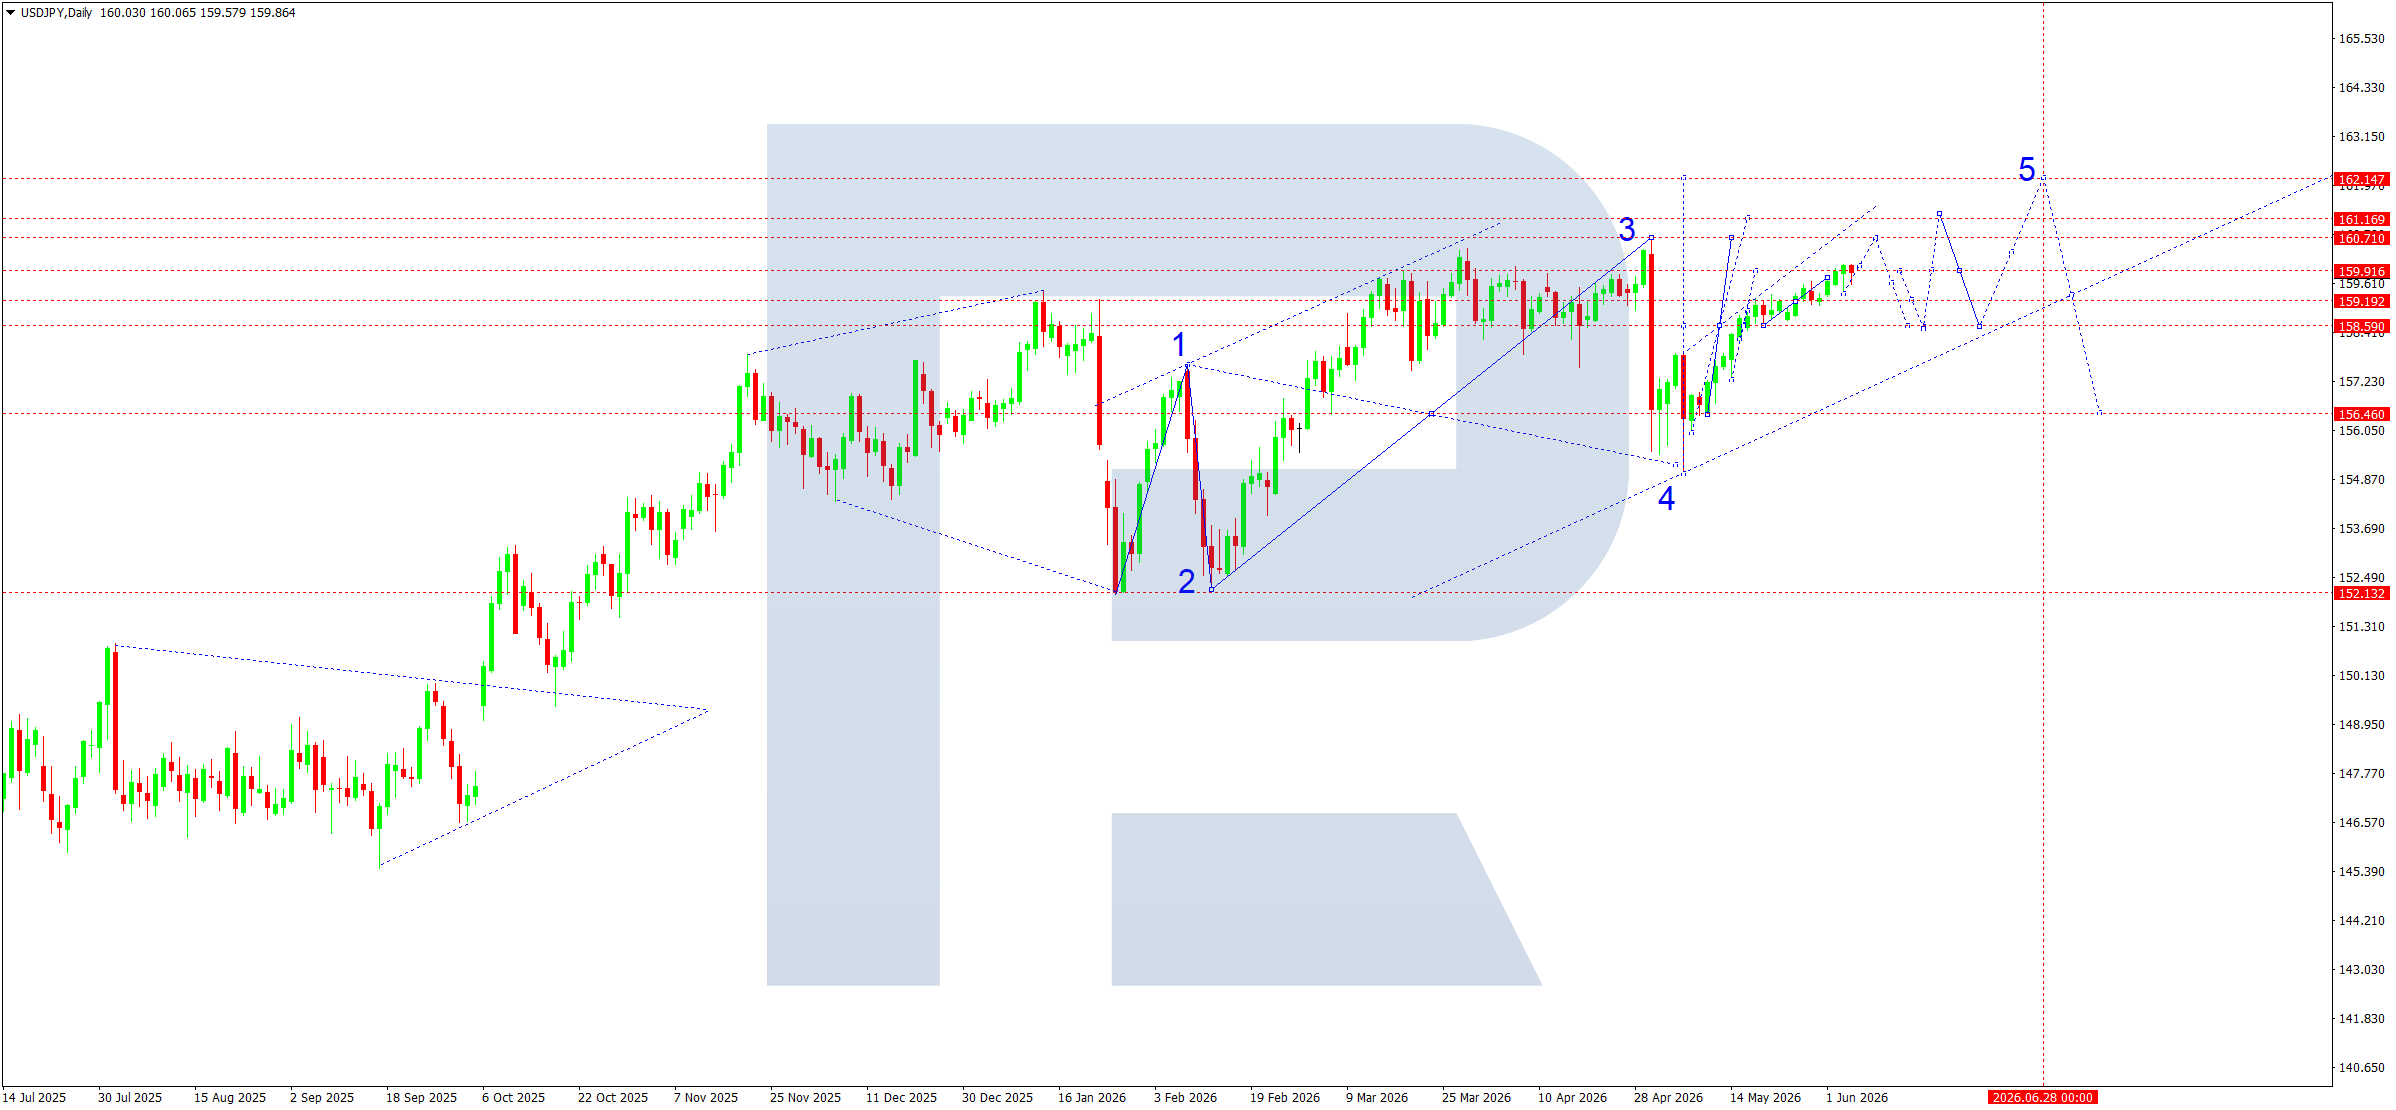
The daily USDJPY chart maintains an upward wave structure. After the corrective wave 4 ended in the 154.90–156.50 area, the market began to form the fifth upward wave.
At present, price is testing the 159.90–160.00 area, which acts as key resistance for further development of the upward impulse. According to the wave structure, the market is in the early stage of the fifth wave. The main estimated target is the 162.15–162.50 area, where the upper boundary of the ascending channel runs and the projected completion of the current impulse is located.
The intermediate resistance is 160.70. A confident breakout of this level will confirm the development of the next growth phase towards 161.17 and then the main target at 162.15. The movement structure indicates that buyers retain control despite local overbought conditions.
The 158.60–159.20 range is viewed as the pivot point of the current fifth wave. While price holds above this zone, the upward scenario remains the priority. Consolidation below 160.00 may become an intermediate accumulation phase before further upward movement.
The alternative scenario suggests a deeper correction if expectations of a BoJ rate hike strengthen or if signals of possible currency intervention emerge. In this case, the market may return to the 158.60 support level, followed by a test of 156.46, where the lower boundary of the ascending channel runs.
USDJPY forecast scenarios
Bullish (baseline): consolidation above 160.00 will open growth potential towards 160.70, then 161.17 and 162.15 as part of the fifth upward wave.
Bearish (alternative): a breakout below 158.60 will increase the probability of a correction towards 156.46, with potential for a deeper decline.
GBPUSD forecast
In the coming week, market participants will focus on the outlook for monetary policy in the UK and the US. Recent UK data indicates persistent inflationary pressure. Bank of England officials continue to maintain hawkish rhetoric, citing risks from wage growth and secondary inflation effects. Bank of England Governor Andrew Bailey stated the need to keep inflation under control and emphasised the regulator’s readiness to maintain restrictive policy if prices continue to rise. At the same time, the UK manufacturing sector is showing recovery, although rising business costs remain a serious risk factor for the economy.
From the US side, stable macroeconomic indicators and expectations that the Fed will keep interest rates high continue to support the dollar. Geopolitical risks in the Middle East and related inflation threats through the energy market remain an additional demand factor for the US currency. As a result, the pound remains under pressure despite stronger expectations of further BoE policy tightening.
GBPUSD technical analysis
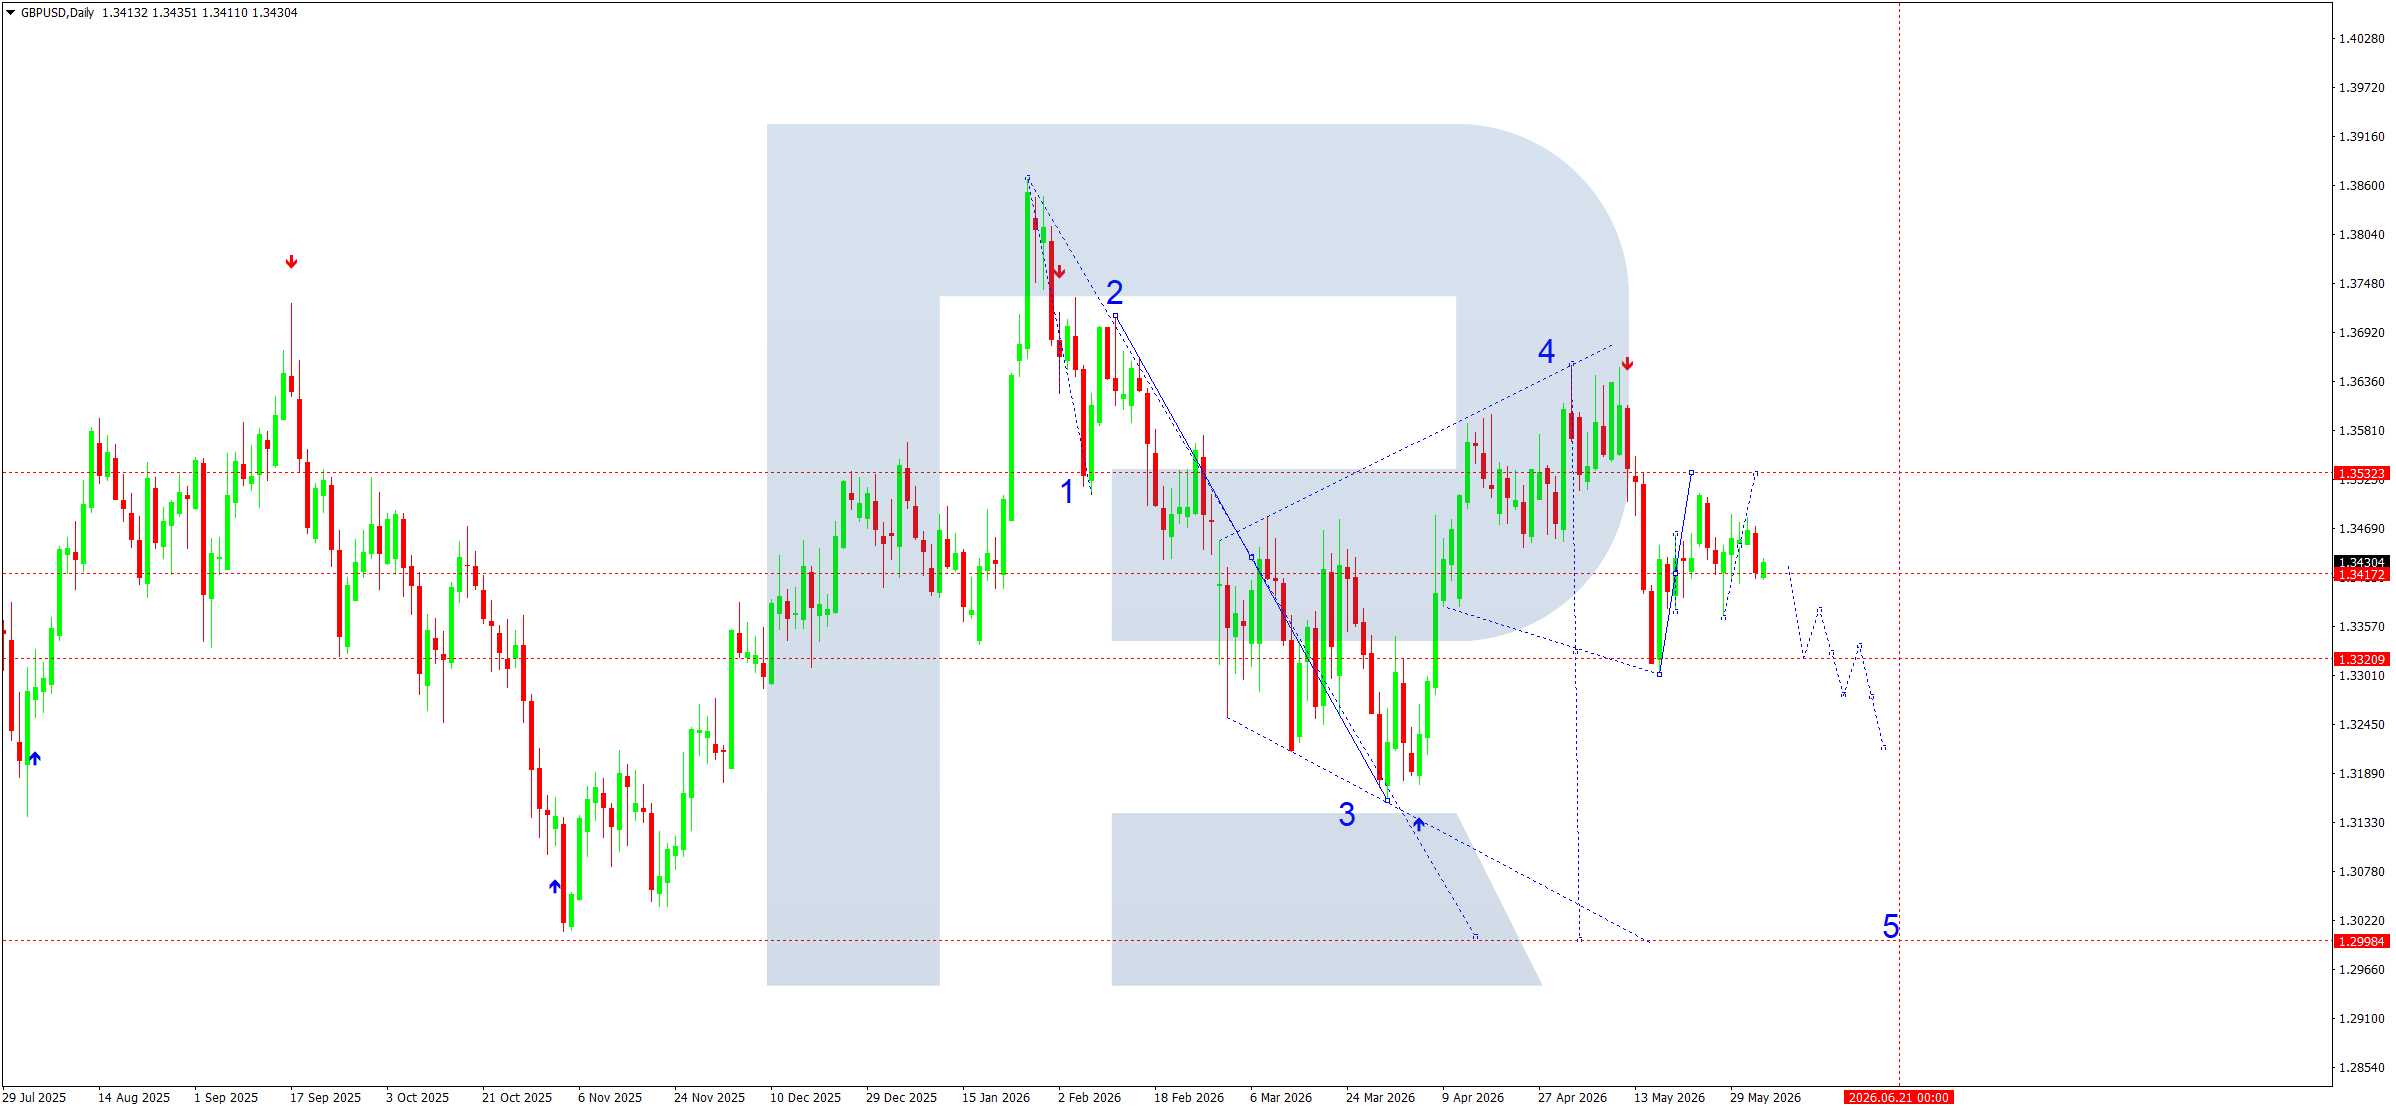
From a technical perspective, GBPUSD continues to form a medium-term downward structure. After the third wave ended at 1.3180, the market formed a corrective fourth wave with a high near 1.3600. According to the current wave structure, the fifth downward wave is forming. The key pivot point is the 1.3417 area, around which the pair is completing its consolidation phase.
On the daily chart, the price remains below resistance at 1.3533, preserving sellers’ advantage. Local support is located at 1.3321. A breakout of this level will confirm the completion of the corrective recovery and open the way for downward momentum. The nearest downside target is 1.3290. If pressure from the dollar strengthens, the market may continue to move towards 1.3180. The main estimated target of the fifth wave remains 1.3000, where the lower boundary of the long-term descending channel runs.
While the price remains below 1.3533, the market structure remains bearish. Attempts to rise towards resistance may be viewed as corrective movements within the forming fifth wave.
GBPUSD forecast scenarios
Bearish scenario (main): PP – 1.3417. A decline below 1.3321 will open the way towards 1.3290 and then 1.3180, a local target.
Bullish scenario (alternative): if the market consolidates above 1.3533, corrective growth towards 1.3600 may develop.
AUDUSD forecast
The Australian dollar ends the first week of June in a consolidation phase after strong growth in recent months. Market participants are focused on the outlook for Reserve Bank of Australia monetary policy, the state of the US economy, and global risk appetite dynamics. Recent Australian economic data was mixed: GDP growth slowed to 0.3% in Q1, while consumer activity remains weak amid high interest rates. At the same time, inflation remains above the RBA’s target range, limiting room for policy easing. High energy prices and persistent geopolitical tensions in the Middle East add pressure to sentiment.
For the US dollar, the key factor remains expectations regarding the Federal Reserve’s next steps. Market participants continue to assess the balance between inflation risks and slowing economic activity. As a result, the AUDUSD pair remains sensitive both to changes in the interest rate differential between the RBA and the Fed and to the general level of demand for risk assets.
AUDUSD technical analysis
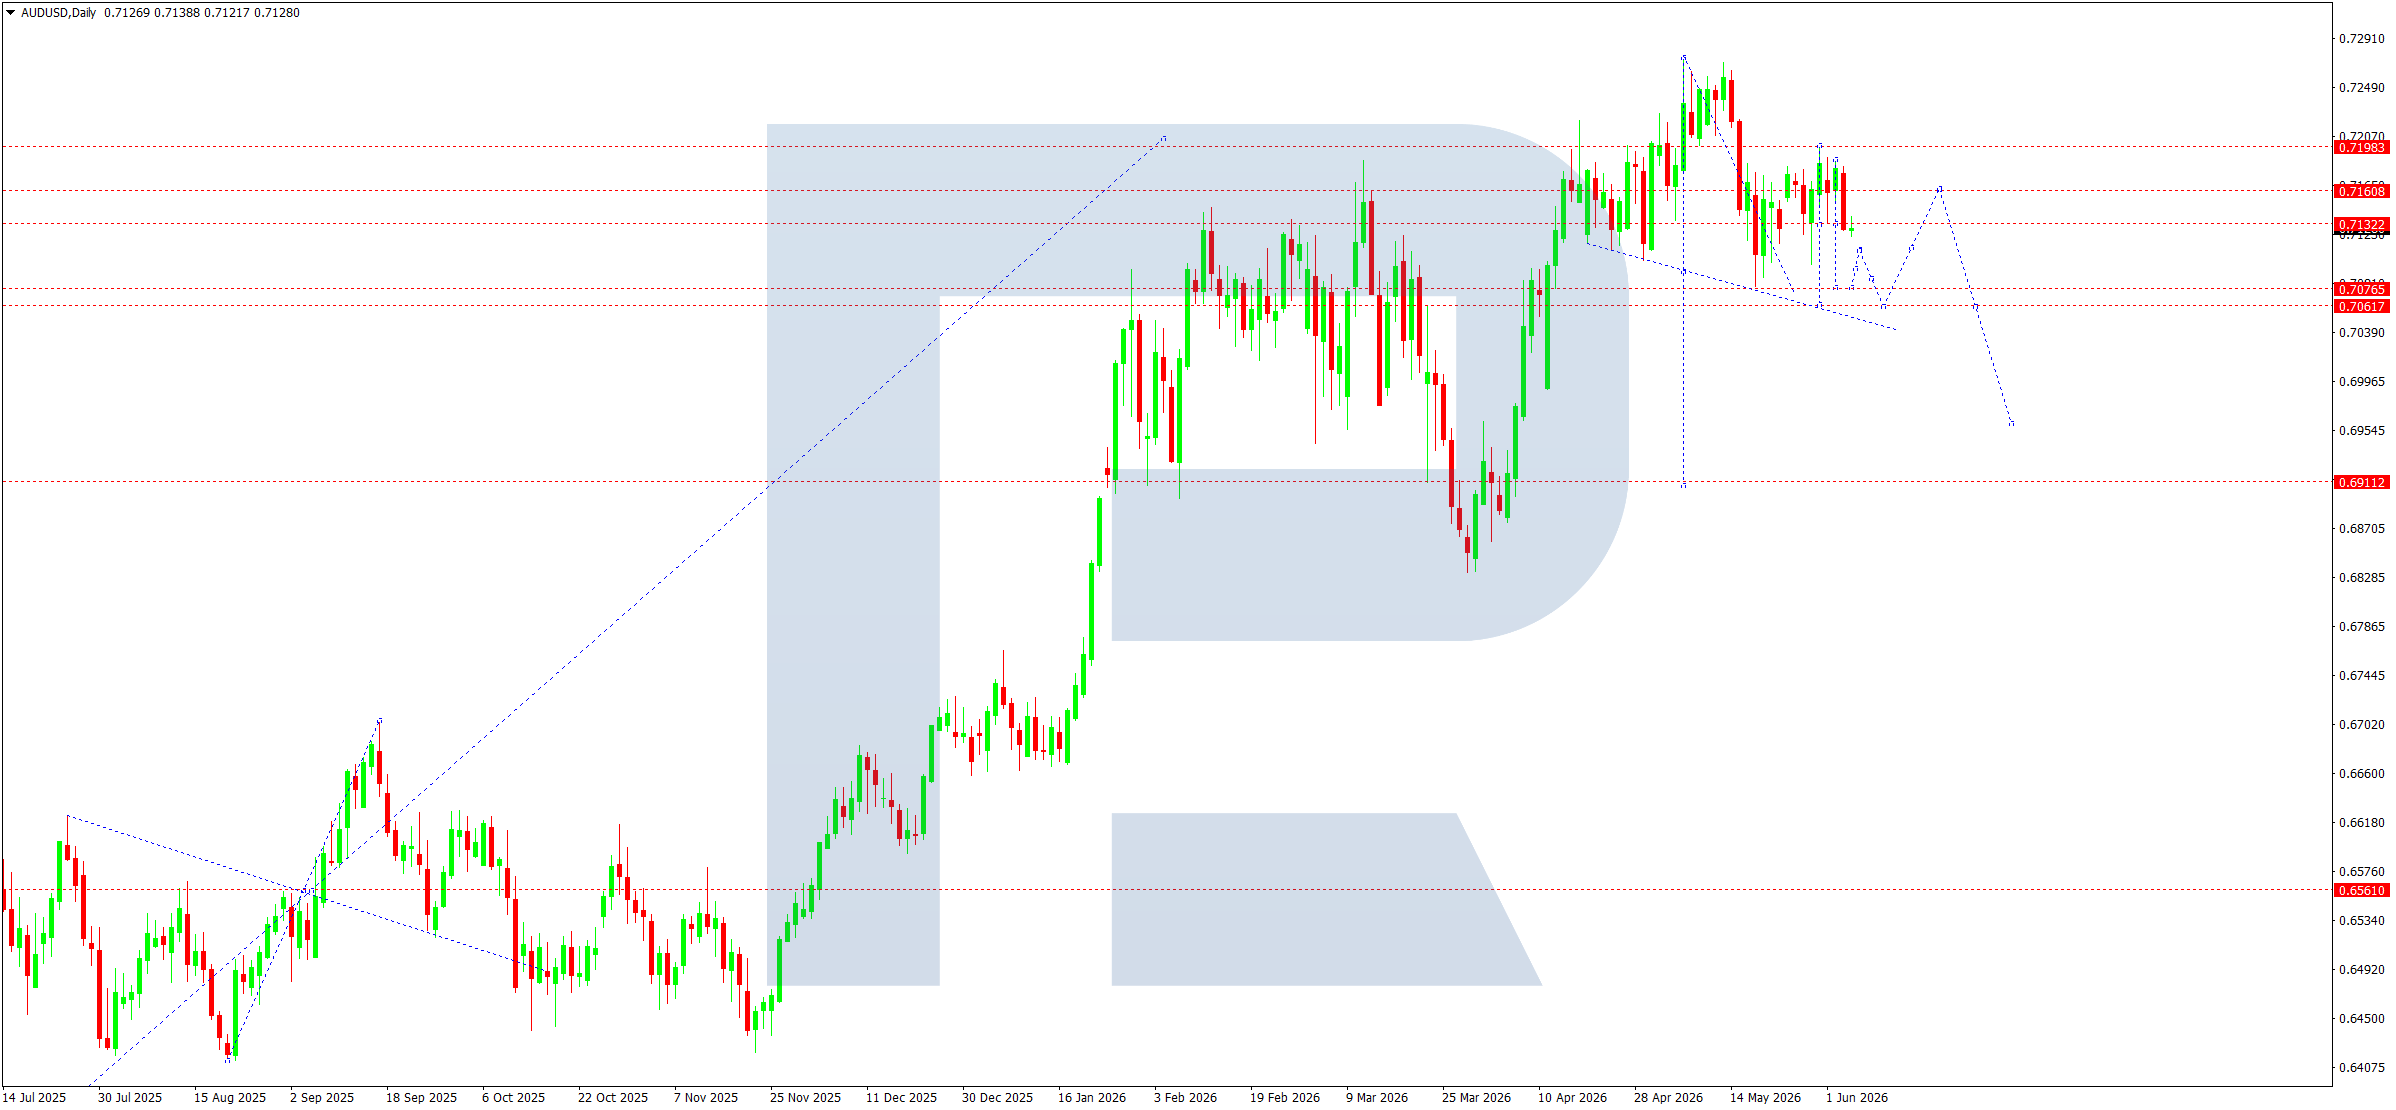
From a technical perspective, the market continues to form a corrective structure after reaching a local high near 0.7260. The daily chart maintains a medium-term uptrend, although a downward corrective channel has developed in recent weeks. At present, the price is trading near the estimated pivot point of the fifth upward wave at 0.7132.
The main scenario suggests the completion of the current consolidation, followed by a decline towards the 0.7070 support level. This mark acts as the nearest target of the current corrective structure. A breakout may increase pressure on buyers and open potential for a move towards 0.6911.
At the same time, the 0.7160–0.7198 zone remains key resistance for buyers. A return above this area will allow the market to resume attempts to rise towards local highs and complete the corrective phase.
AUDUSD forecast scenarios
Bearish scenario (baseline): a decline within the current corrective channel forms a movement structure towards 0.7070. At present, the pivot point is located at 0.7132.
Bullish scenario (alternative): if the market consolidates above 0.7160, continued growth towards the 0.7198 resistance level is possible, with a further target near 0.7260.
USDCAD forecast
In the coming week, USDCAD performance will be determined by a combination of foreign policy risks, interest rate expectations, and the state of Canada’s economy. Market participants remain focused on rising tensions in the Middle East, which support demand for the US dollar as a safe-haven asset. New trade disagreements between the US and a number of countries, including Canada, are putting additional pressure on the Canadian dollar. Recent data confirmed a slowdown in the Canadian economy: Canada’s GDP contracted for the second consecutive quarter, increasing concerns about the outlook for economic growth. At the same time, the market expects the Bank of Canada to keep the rate at 2.25%, as the regulator has to balance weak growth with accelerating inflationary pressure caused by high energy prices. Rising oil prices support the Canadian currency, although under current conditions this factor is not enough to form a sustainable CAD uptrend.
USDCAD technical analysis
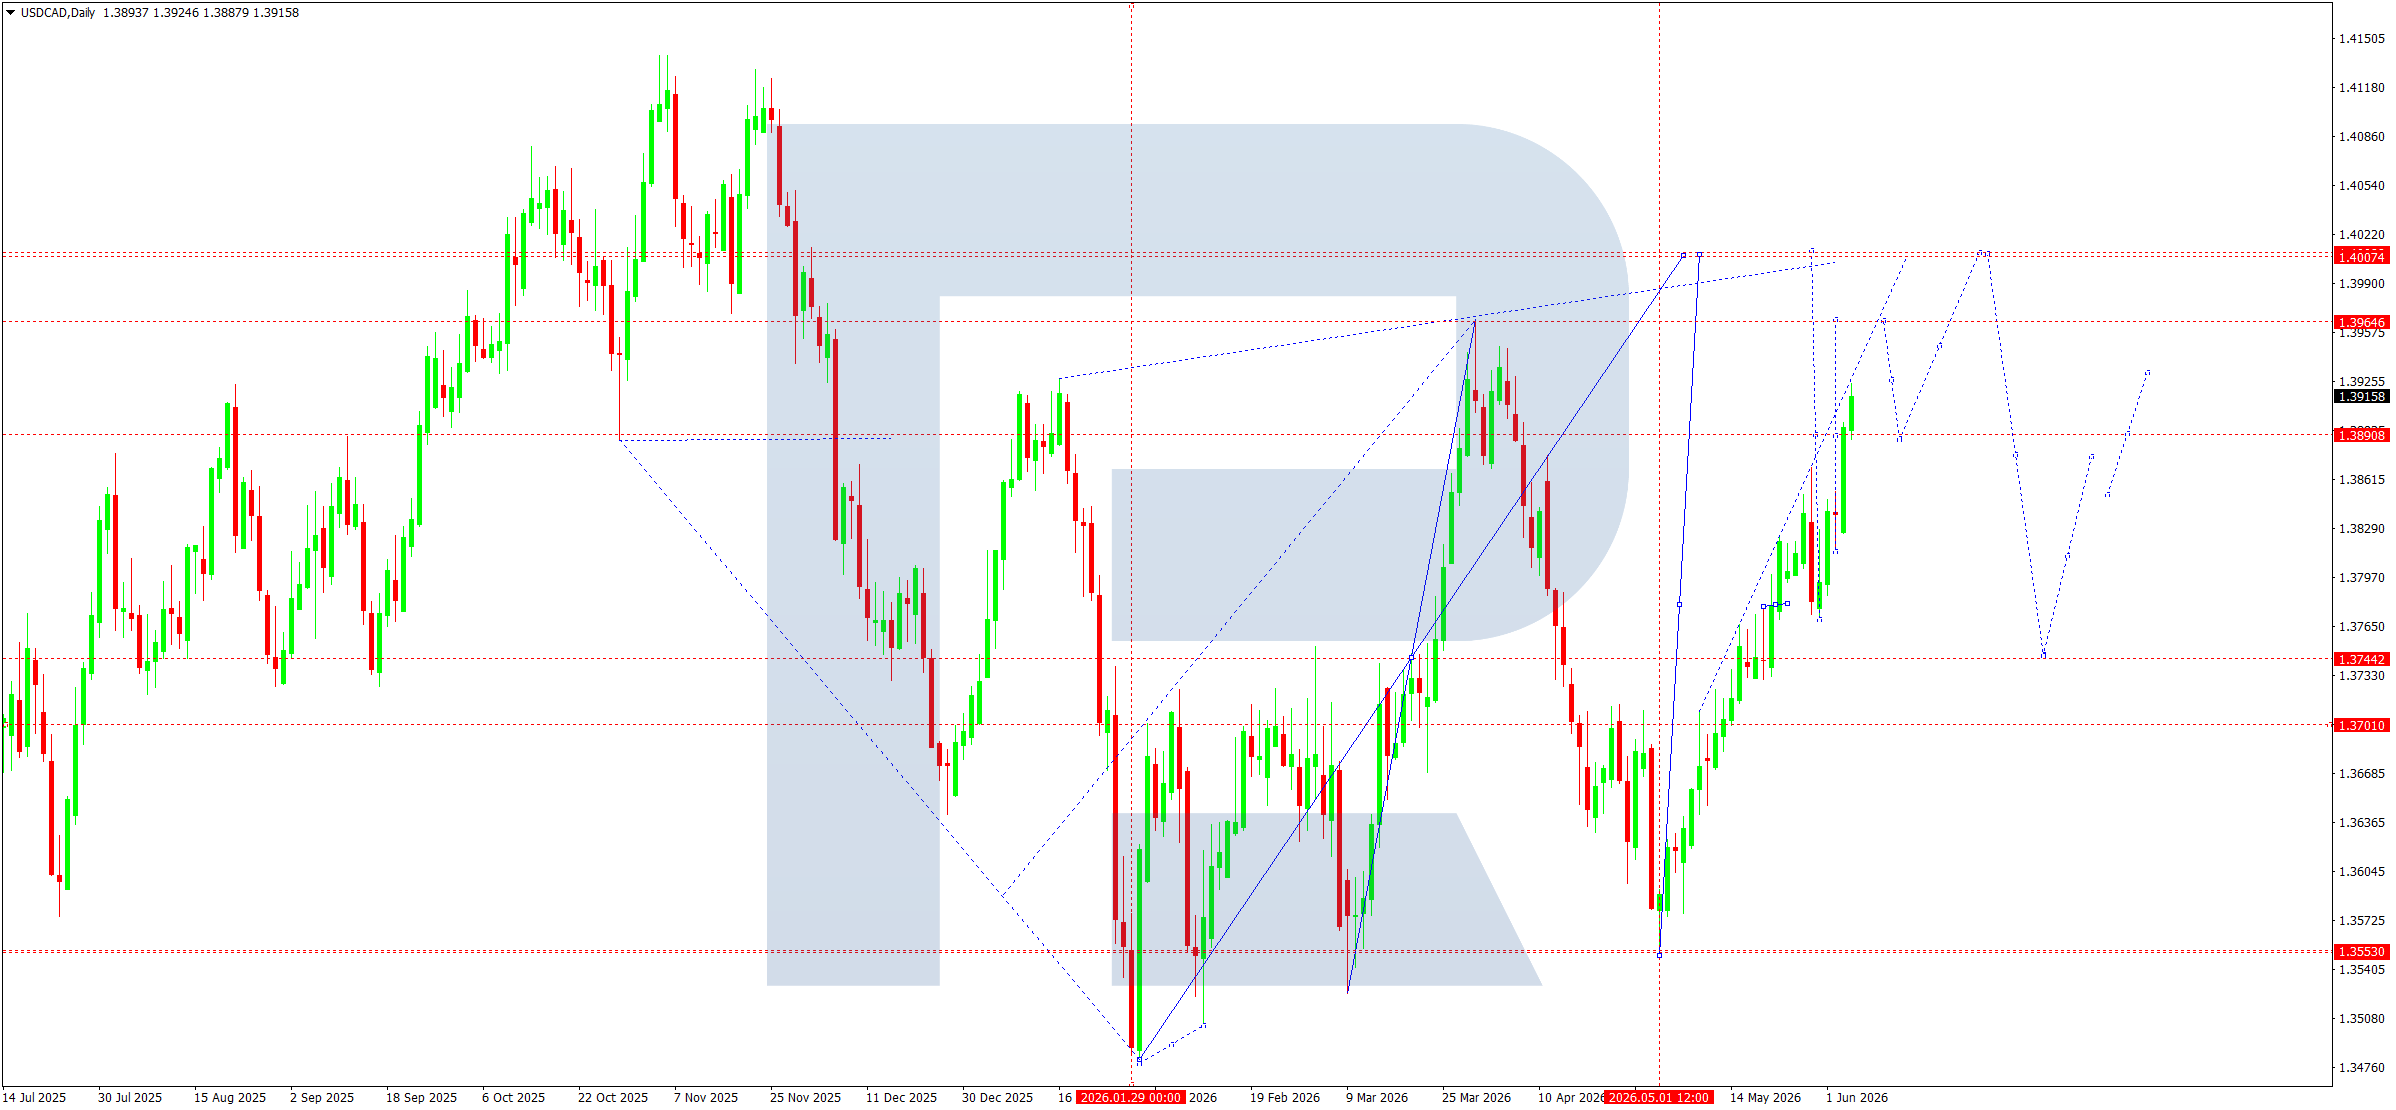
From a technical perspective, the market continues to develop an upward wave structure after forming a medium-term low near 1.3480. On the daily chart, the pair consolidated above 1.3744, which previously acted as important resistance and is now viewed as the nearest support. At present, the price is testing the 1.3890 area, where the local pivot point of the current upward wave is located.
According to the wave structure, the market is developing another growth impulse. The nearest target for buyers is 1.3965. A breakout above this level will open potential for continued movement towards 1.4007 and then the upper boundary of the medium-term ascending channel near 1.4020. This area is viewed as the main target of the current growth phase.
If a corrective wave forms after the price reaches the 1.3965 level, the market may return to test 1.3890 from above. If this level holds as support, the uptrend will retain potential for further development. The alternative corrective model allows for a decline towards 1.3744, although the structure remains confidently bullish for now, and all main targets are located above current values.
USDCAD forecast scenarios
Bullish (baseline): growth towards 1.3965. After a possible correction to 1.3890, further growth towards 1.4007 and then 1.4020 is expected.
Bearish (alternative): if the market breaks below 1.3744 and consolidates below it, a correction towards the 1.3701 area may develop, with the risk of a further decline towards 1.3553.
XAUUSD forecast
In the coming week, gold will remain in focus for investors amid expectations for key US macroeconomic statistics and the upcoming Federal Reserve meeting. Recent US labour market data demonstrates economic resilience, supporting the dollar and limiting the upside potential of the precious metal. At the same time, high inflation risks persist, linked to the energy sector and geopolitical tensions in the Middle East. The International Monetary Fund has urged the Fed to remain cautious when making further interest rate decisions, as inflationary pressure remains elevated.
Gold receives additional support from continued demand from private investors and central banks, although the pace of purchases has slowed somewhat compared with the start of the year. The market is also closely watching US dollar dynamics and US bond yields. A weaker dollar traditionally supports demand for gold, while a stronger US currency puts pressure on metal quotes.
XAUUSD technical analysis
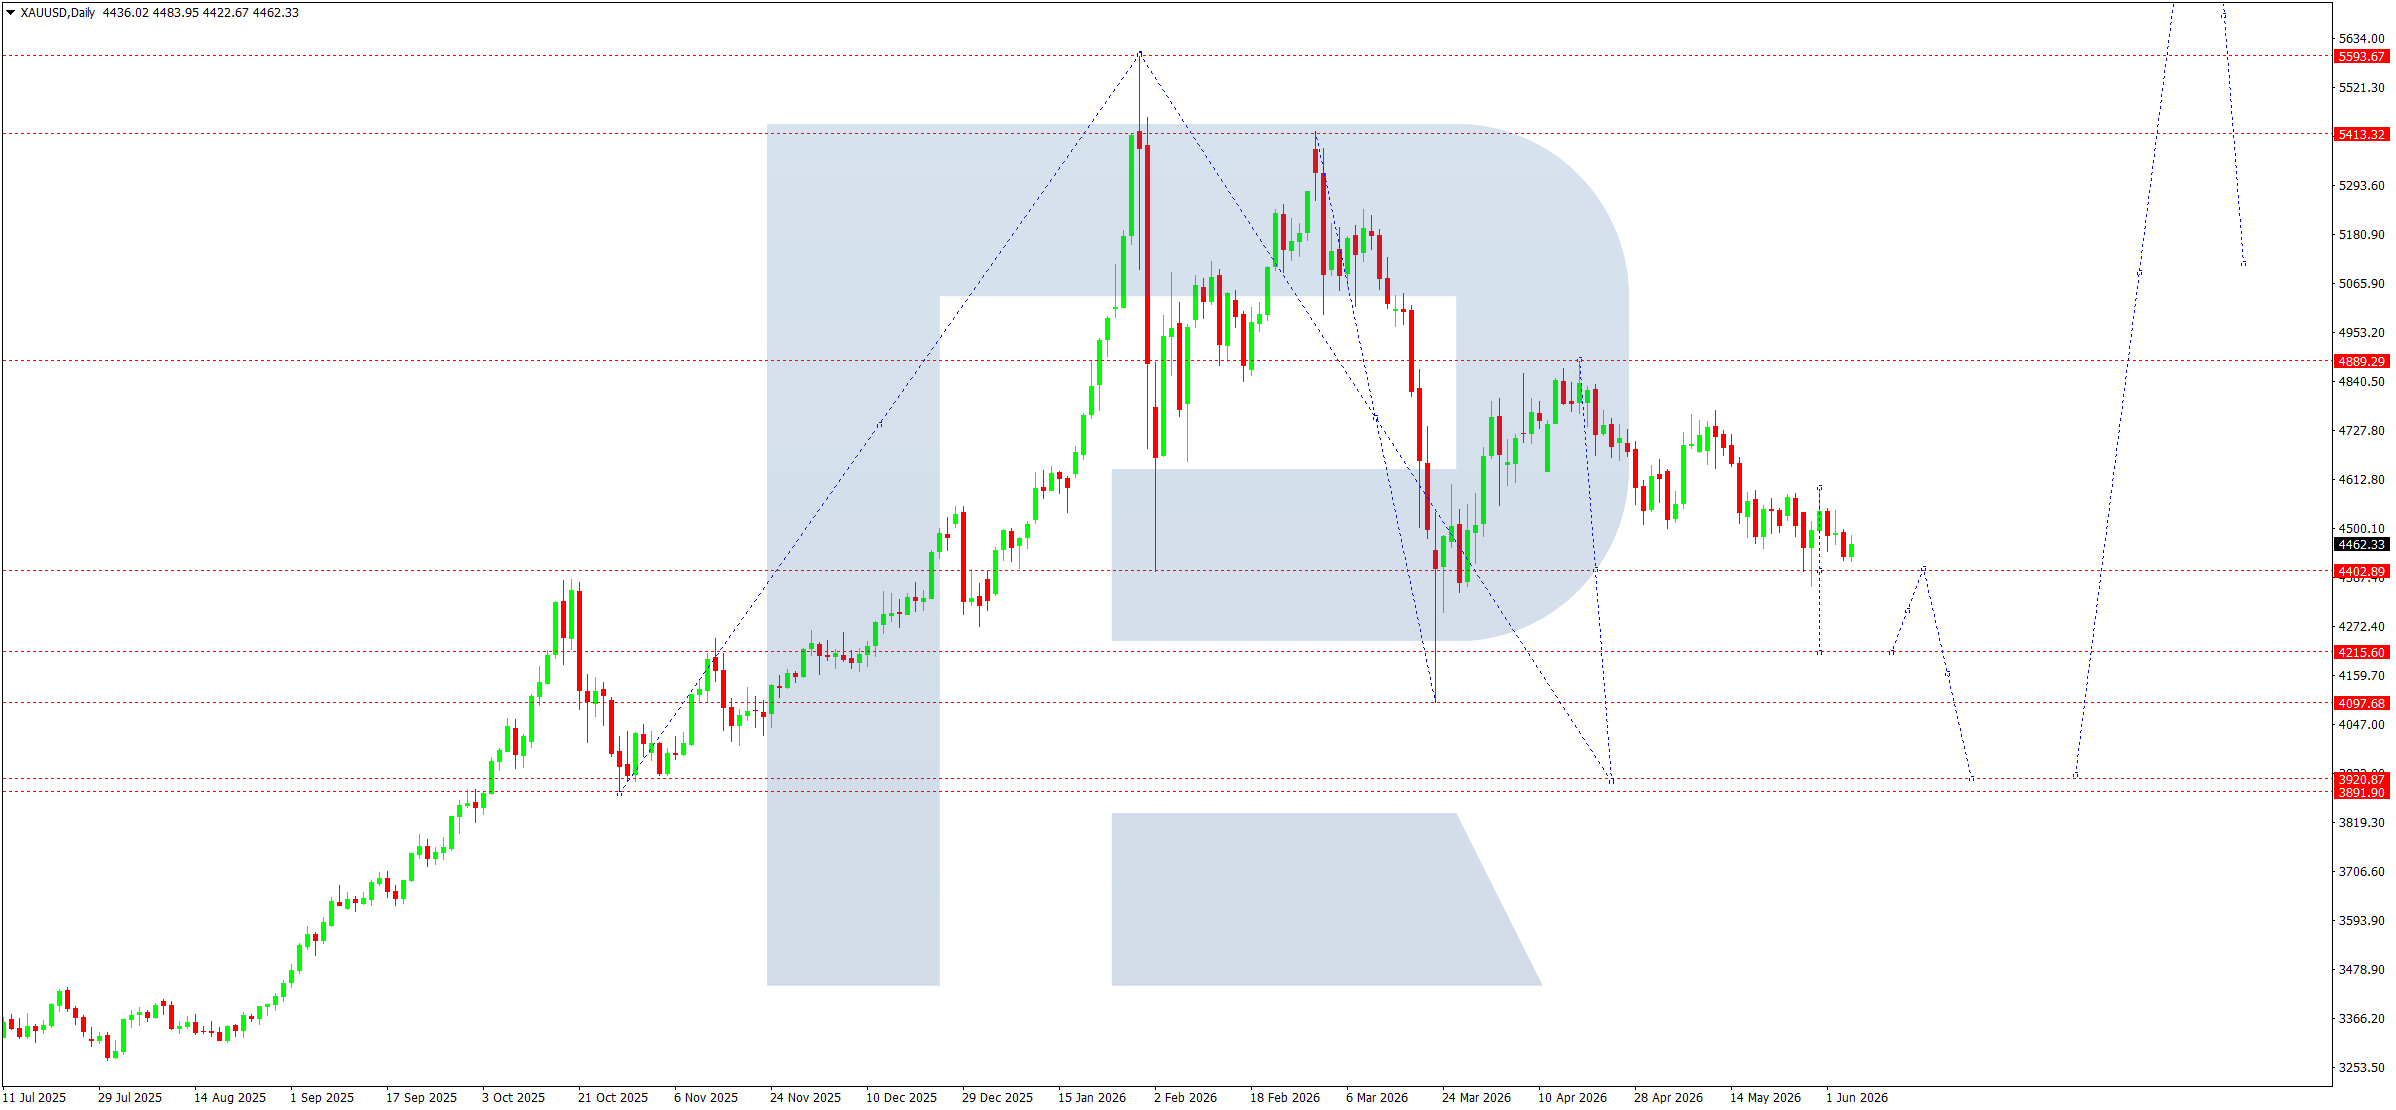
From a technical perspective, XAUUSD continues to develop a medium-term downward correction after forming an all-time high near 5,413. On the daily chart, the market is trading within the structure of a downward wave, maintaining pressure below the estimated pivot point at 4,889. The main trend remains bearish despite the formation of local consolidation near 4,402.
At present, gold is holding above support at 4,215, which acts as the nearest target for sellers. According to the wave structure, the market is completing the formation of a corrective range and retains potential for further decline. Consolidation below 4,402 will allow sellers to test the 4,215 level. A breakout below this mark will open the door for a move towards the main medium-term target at 3,920.
To change the technical picture, buyers need to return the price above 4,889, where the key pivot point of the current downward structure is located. Only consolidation above this level will indicate the end of the correction and renewed upward momentum towards 5,413 and then 5,593.
XAUUSD forecast scenarios
Bearish (baseline): a decline along the downtrend towards 4,215. The estimated pivot point is 4,889. A local target stands at 4,215, with the main at 3,920.
Bullish (alternative): if the market consolidates above 4,889, growth towards 5,413 may develop, with further movement towards 5,593.
Brent forecast
In the coming week, the Brent oil market will remain under the influence of several fundamental factors at once. The main theme remains the situation in the Middle East and its impact on global crude supplies. In early June, quotes showed elevated volatility amid reports of a possible easing of geopolitical tensions between Iran and Western countries, which temporarily put pressure on prices. At the same time, market participants continue to closely monitor supply conditions through strategically important oil export routes.
Lower commercial oil inventories and the persistent supply deficit provide additional support to the market. According to the latest estimates, global oil inventories continue to decline, while OPEC maintains its forecast for global oil demand growth in 2026. Despite some signs of weaker demand from China, the overall market balance remains fairly tight.
Brent technical analysis
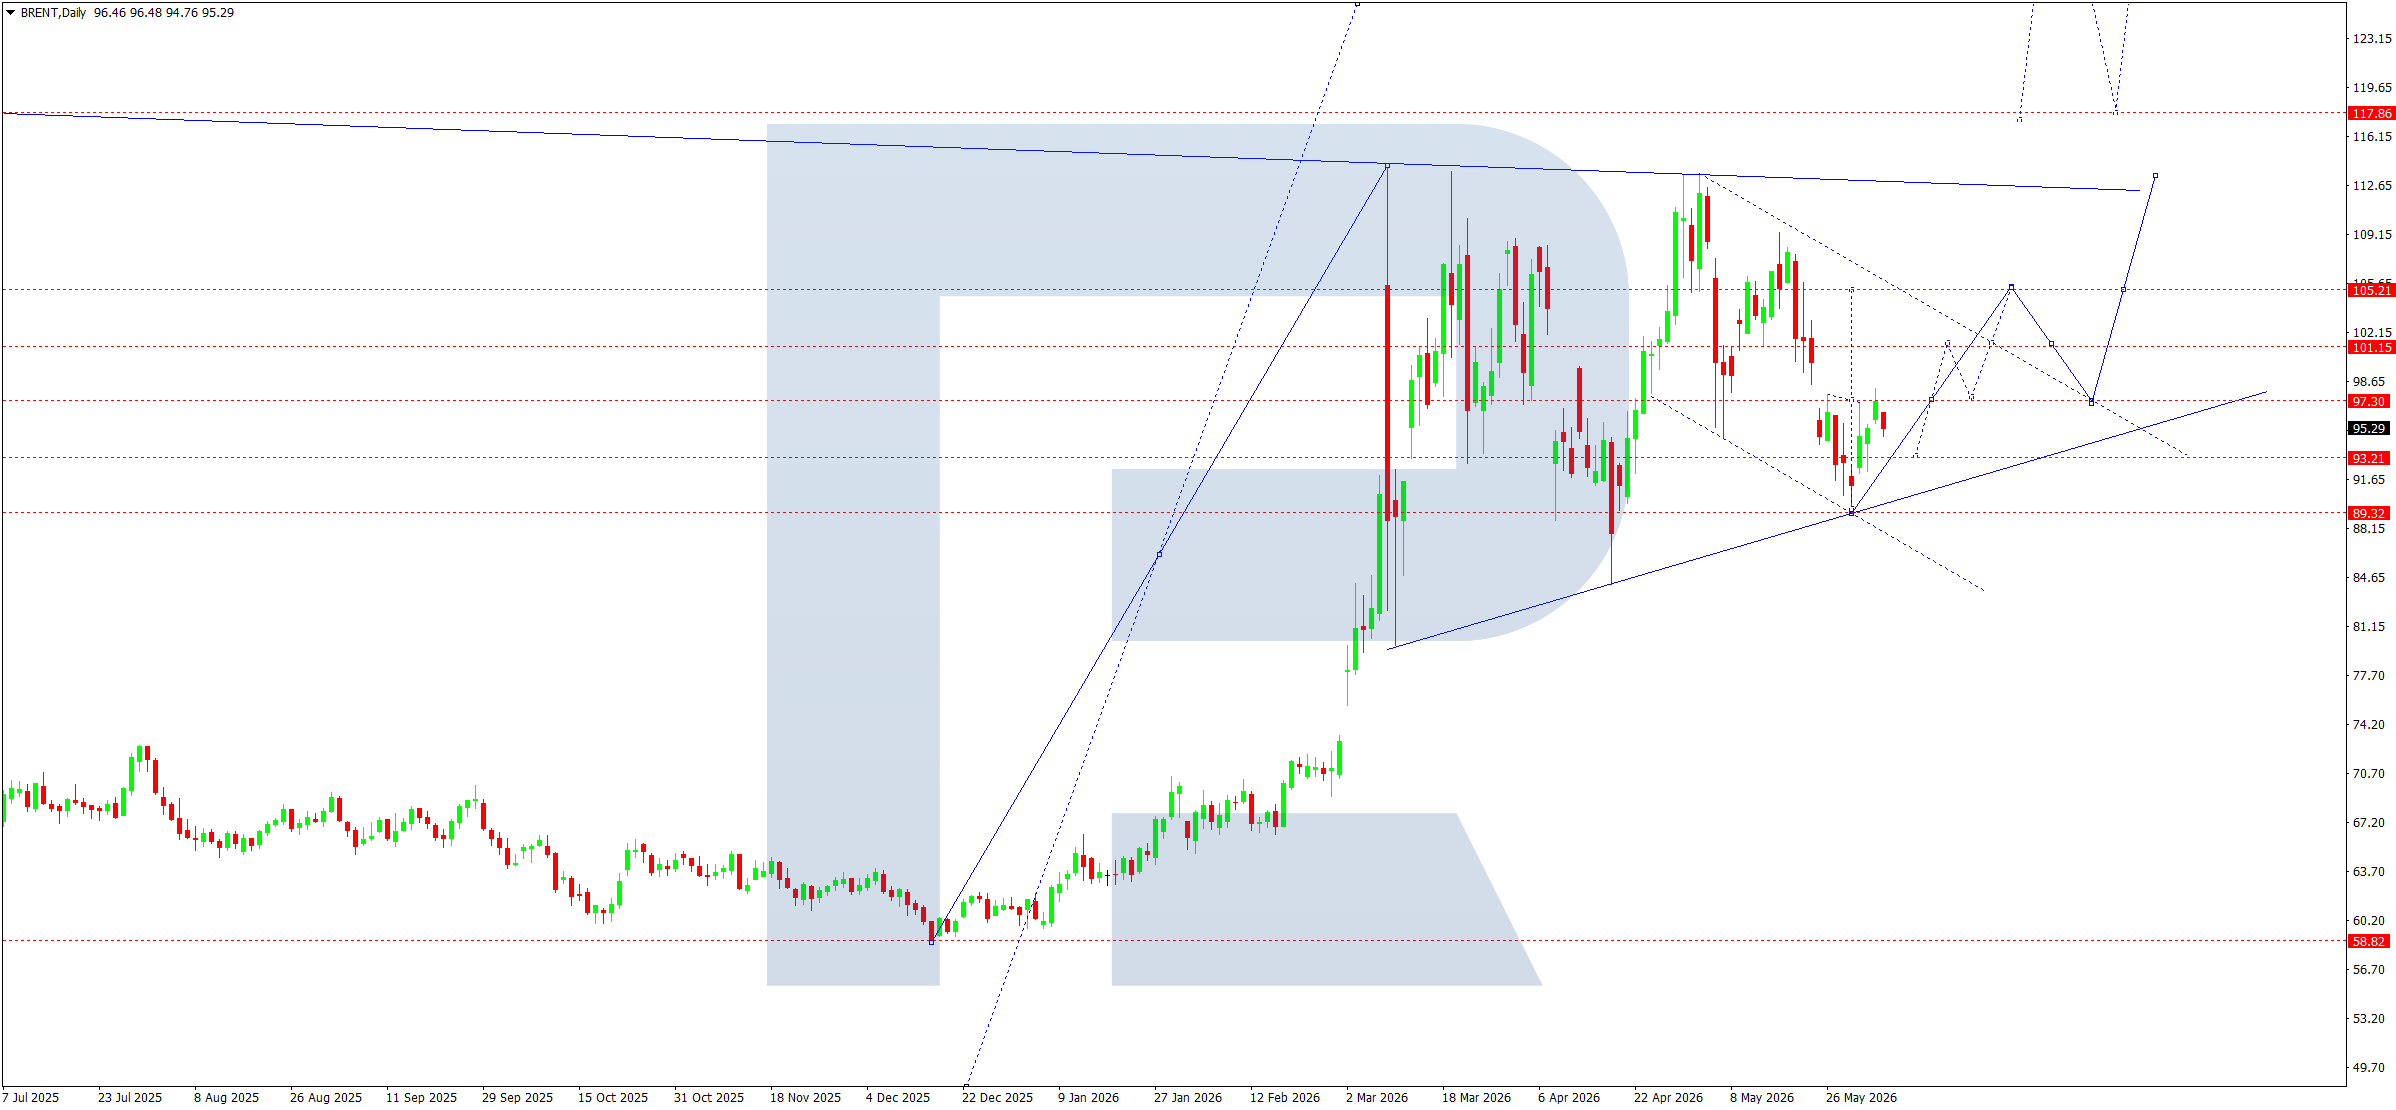
From a technical perspective, Brent is completing a corrective phase after declining from April highs. On the daily chart, the market tested the 89.60 support area and formed a reversal structure within the long-term ascending channel. A local upward momentum is currently underway after the completion of the corrective wave.
The estimated pivot point of the current structure is located near 95.16. While the market holds above the 89.60 support level, there remains potential for a new upward movement. The first target for buyers is 100.72. A breakout above this level will open the way towards the 106.42 resistance level, where stronger seller activity is expected.
The medium-term wave structure still indicates that the main uptrend remains intact. After the current consolidation phase ends, the market may continue to rise towards the upper boundary of the long-term channel. The main target of this movement is the 111.63–112.65 area. This is where the key resistance of the higher timeframe is located, from which another corrective wave may develop.
At the same time, a return below 95.16 will increase the risks of another test of the 89.60 support level. Consolidation below this level will signal a deeper correction towards 84.68.
Brent forecast scenarios
Bullish scenario (main): the market is forming a consolidation range above 95.16, with prices expected to rise towards 100.72. If this level is broken, upward movement potential will expand towards 106.42 and then 111.63.
Bearish scenario (alternative): if selling pressure increases and prices consolidate below 89.60, downside potential towards 84.68 will open, with the risk of further development of the corrective structure.
Editors’ picks
 EURUSD forecast 2026–2027: technical analysis, price levels & predictions
The ECB holds rates at 2.15% while the Fed stays at 3.75% — and that divergence is the central driver of EURUSD in 2026. The pair is range-bound between 1.1400 and 1.1915, with Deutsche Bank targeting 1.2500 and Morgan Stanley calling for 1.3000 by year-end. We analyse the technicals, break down the macro factors, and outline three trading scenarios with specific entry levels.
 Gold (XAUUSD) forecast 2026: technical analysis, price levels & predictions
Where is gold headed after pulling back from the all-time high of 5,597 USD? XAUUSD is consolidating near 4,518 USD between key levels 4,220 USD and 4,855 USD, with major banks targeting 5,243–6,200 USD by year-end. Read our comprehensive gold forecast: technical analysis across three timeframes, trading scenarios with specific entry levels, Fed policy and central bank demand outlook, and institutional predictions for 2026 and beyond.
Forecasts presented in this section only reflect the author’s private opinion and should not be considered as guidance for trading. RoboForex bears no responsibility for trading results based on trading recommendations described in these analytical reviews.